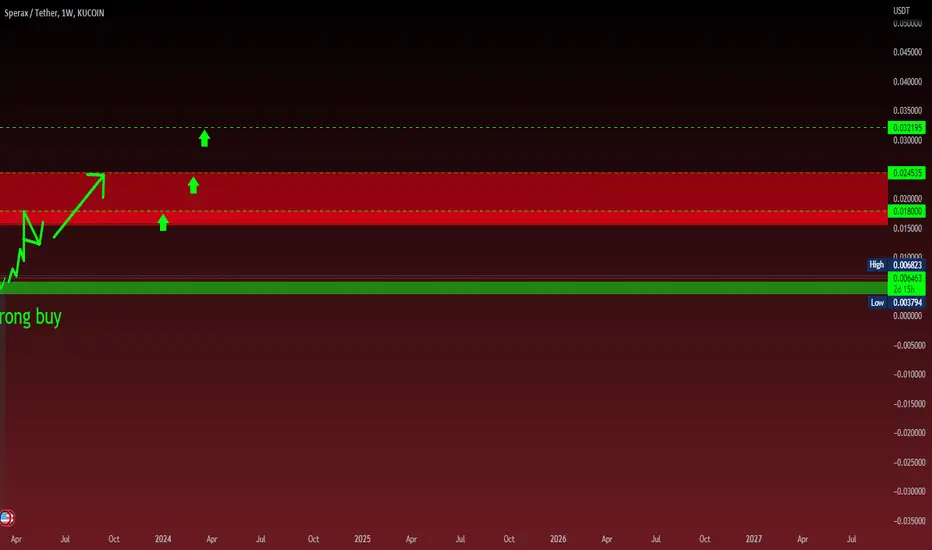
Sperax — Bullish Since Late 2023: 1860% Growth PotentialSPAUSDT (Sperax) produced an All-Time Low in September 2023, it has been growing since.
The latest low was a higher low and this one came in August 2024, almost a year after the ATL. This is a strong higher low and we currently have a resumption of the bullish trend.
We have a widening rising channel, all signals are green.
This is a pair that already moved strong but has more to give.
SPAUSDT has grown by 975% since its September 2023 low. In the coming months, this pair can enter full-blown bullish mode. This means a new bullish wave, a strong advance, and this advance can produce easily 650% profits or even 1,860% or more.
This is another hidden gem. I will continue to share more.
Namaste.
SPAUSDT trade ideas

SPAUSDT LONGSymmetrical Triangle has a 50/50 change of breaking up or down, but if we break out to the up side, this one can do some damage!!!

SPAUSDT?
I like SPA because...
It's been trading 0.01000 to 0.011 and 0.012 range
Like it's ready to spike like 50%
It's trading.. you'll need stoploss
If anything goes against.
I need to be firm on it..
I'm no hodl
I don't have the patience (self)
and I have time variable for it to work| if dont work in my timeline.
I shift.. there are more asset to trade.
All the best guys
Again, not a guru.
Be safe
From Malaysia

Video Explanation of SPA Low Marketcap, Very Bullish OverallWith a Previous high of $0.20 in a Bear Market This Coin being a Penny is pretty significant. We've been forming a support line that's been relevant for at least 18 months.
Zooming in the Support Line was tapped 4 Times and looks like it has no intention on coming back. ADX is high looking as if it's going to continue going as such. MACD Still looks bullish as can be.
This is a wonderful project i believe there's a lot of faith in.
Let me Show you something interesting about SPA is it's recently been coming up on our market sifter and Breakout finder on the BTC Pair
Tracking Tech Market Sifter,
📈 *Name*: Sperax
🔖 *Symbol*: SPA
💲 *Price*: $0.011076170319746786
📉 *24h Change*: -9.79%
📊 *7d Change*: -17.16%
💰 *Market Cap*: $18_737_070.61
🔄 *24h Volume*: $13_850_112.77
🏷️ *Tags*: alameda-research-portfolio, arbitrum-ecosytem, dwf-labs-portfolio
Do Your Own Research as Always

Scalp positionA great scalp position, given that we are in a strong uptrend and corrective wave analysis we can expect to return to the green zone.

SPA Healthy correction After 300% Breakout, Continuing Bullrun The ADX is 12 and obviously Bottoming Out.
The MACD is hovering below the signal line waiting to Make a Move.
We Broke out ran 300% to have a health pullback and run 100% again
This is a low marketcap token with a lot of potential and even has a 3x margin available on kucoin.
Don't miss this banger!
📈 *Name*: Sperax
🔖 *Symbol*: SPA
💲 *Price*: $0.011076170319746786
📉 *24h Change*: -9.79%
📊 *7d Change*: -17.16%
💰 *Market Cap*: $18737070.61
🔄 *24h Volume*: $13850112.77
🏷️ *Tags*: alameda-research-portfolio, arbitrum-ecosytem, dwf-labs-portfolio

Symmetrical Triangle, .38 Fib Bounce. Continuing Bullish Run We have an ADX that is postive 34 and uptrending suggesting trend follow tatics work best.
We can see that we've ran 300% and traced back down to a healthy .38 fib line which is expected after such a burst. This is a low marketcap coin with a lot of potential. We're proud to give it to you!

Do Not Miss This Token (SPA) an Easy 20XThe volume here says it all where it bottomed out and buying support came rushing in
We stayed bottoming on this support lined almost 2 years. We recently bounce off the support and crossed and closed above the 50-period moving average.
MACD Is above the Signal Live
Our Algorithm Gave the Signal Below This Morning (02/07/2024)
As always do your own research!
🔎 *Symbol*: `SPA/USDT`
📈 *Signal*: `Long`
💲 *Current Price*: `0.010087`
🛑 *Stop-Loss*: `0.0033446400000000007`
💰 *Market Cap*: `17192780.53204348`
🚪 *Entry Prices*:
📥 Entry Price 1: `0.007715359999999999`
📥 Entry Price 2: `0.00906732`
📥 Entry Price 3: `0.010159999999999999`
📥 Entry Price 4: `0.01125268`
🏁 *Exit Prices*:
📤 Exit Price 1: `0.018327319999999998`
📤 Exit Price 2: `0.02051268`
📤 Exit Price 3: `0.02405`
📤 Exit Price 4: `0.02758732`

Sperax (SPA)On the above 4-day chart price action has corrected 97% since the sell signal in January 2022 (not shown). Now is a good opportunity to go long. Why?
1) A strong buy signal prints. (not shown).
2) Price action resistance breakout (USD and BTC pairs).
3) Strong positive divergence between price action and multiple oscillators. This divergence occurs over an 80 day period.
4) Can price action go back to 20 cents? No idea but that would be a 5500% return.
Is it possible price action could fall further? Sure.
Is it probable? No.
Ww
Type: trade
Risk: <=1-2% of portfolio - Very small market cap
Timeframe: Don’t know.
Return: Don’t know.

SPAUSDT LongAnother one where it looks a decent pullback made look slightly ugly due to crypto dump yesterday, taking an initial position now and will keep an eye for adding more later

$SPA Breakout or No?An above average green volume bar here and a daily close above the trend line could spark a new up swing.
If we break out, expecting a potential retest at the same green line—where resistance turns support, then continues up. Let's see.

Speaking My mind SPA USDTSPA USDT is potentially a very good opportunity atm. it is making multiple reversal patterns
Always do your own research before investing.
Goodluck,

SPAUSDT looks bullishThis pair seems to be breaking out of a downtrend, also volume increase is notable.

SPA sperax price prediction 2023Price prediction based on confluence and BTC staying above 200W-MA
0.036c
Confluence 1.618 fib extension
Pattern extension meets 1.618 fib extension
Fib retrace from ATH to 0.886 gives 0.03c also keeping an eye on this price for reaction

SPA sperax price prediction 2023 update 2Update from the first idea
Using LOG FIB drawn on Weekly chart from all time high to all time low we find confluence on the 0.5 and 0.618 when compared to the recent mid term swing high to low. 1.272 and 1.618 (aug '22)
Also RSI on weekly chart looks very bullish. Strong support and bounce with continuation likely in the coming weeks and months. Targets posted on chart, not expecting all targets to be reached on first attempt.
There is possibly a correction or 2 coming this year before reaching all the targets but I expect all targets to be hit as a minimum.

SPAUSDT - Initial LONGOne alt that hasn't popped yet. Nice little breakout from the falling wedge and backtest. Initial targets 0.5, 0.55, 0.62 (don't quote me on them).

SPAUSDT Daily TimeframeClassic Flag;
- take-off
- accumulation/resting/storing energy/take profit
- next take-off?
- 1st Target at Resistance (previous rejection area)
- 2nd Target at Dynamic Resistance (EMA)

EZ Short - 0.01 TargetStop loss= 0.0247
Take profit = 0.010
ALL indicators clearly say im(SPA) over bought and the pumping group are selling by liquidating the SHORT positions

Multiple Bullish PatternsMultiple bullish patterns such as an orange bull pennant, black cup and handle, white ascending triangle which could be a part of a bigger bull flag. Price is riding the EMA's up. Volume is declining, price is right at resistance. 1hr had a bullish cross and the 1hr srsi can still move up before being overbought. 1hr hidden bullish divergence with the rsi. 2hr macd about to cross bullish. 2hr srsi oversold moving up a bit. 3hr srsi oversold with bearish cross on MACD. Hidden bullish divergence on the 3hr srsi. 4hr srsi oversold with bearish divergence. Daily srsi extrremely overbought 100 on both lines, RSI in overbought territory. 1D MACD coming from very far down so maybe it could move up a bit more, who knows. 15min MACD bullish cross and srsi can still move up. The full target is the bull flag target.

Cup and HandlePotential cup and handle and falling wedge. This is a high-risk trade because the daily SRSI is overbought but the 4hr and 1hr are oversold. Volume is declining, breakout of a falling wedge. Under EMA's but the 200. Won't be surprised if this fails.

Adam & Eve bottom with Bullish DivergenceSPA looking pretty good, as if it wants you to know a spa is coming for you! Last time bitcoin made an adam & eve it would skyrocket. Let's hope the same happens here. Nothing is guaranteed. Be wary as the daily STOCH RSI is overbought. Bullish divergence in the daily RSI. It is best to wait for the full pattern to form before making any entries. Don't be dumb lol.

SPAUSDT targeting 0.4500 on a Cup & Handle pattern!SPA has been one of the best performing crypto of the year, being supported on its 1D MA50 (blue trend-line) since December 23. The most important development is that it has now broken above the handle of the Cup and Handle (C&H) pattern of late January. The previous C&H pattern, when it broke above its handle, it reached its 2.0 Fibonacci extension before pulling back on profit taking. The current 2.0 Fib extension is at 0.4500.
--------------------------------------------------------------------------------------------------------
** Please support this idea with your likes and comments, it is the best way to keep it relevant and support me. **
--------------------------------------------------------------------------------------------------------
