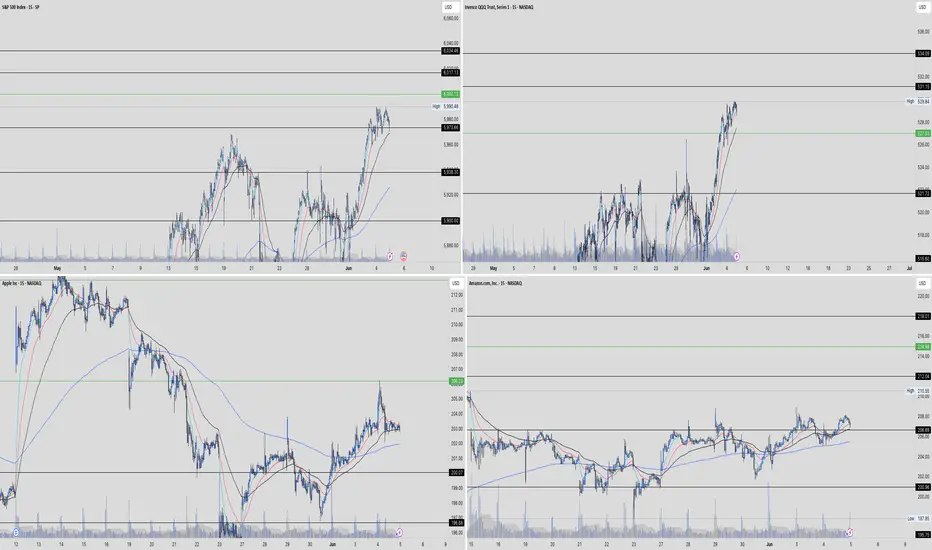
US & Global Market Breakdown | Profits, Losses & Bearish TradesIn this video, I break down the current state of the US and global economy, and why I believe we’re heading into a bearish phase.
📉 Fundamentals:
I cover the key macroeconomic factors influencing the markets — including Trump’s proposed new tariffs, slowing GDP growth, and ongoing supply chain constraints. These all point toward increasing pressure on the global economy.
📊 Technical Analysis:
I go over the major indexes and highlight their recent behavior. We’ve seen reactions from resistance levels, contraction patterns forming, and a significant volume dry-up — followed by today’s spike in volume, which occurred right at resistance. These are potential signs that the market may be shifting toward a bearish trend.
That said, we could still just be witnessing a deeper pullback within a longer-term uptrend. Markets are unpredictable, and no one knows for sure — which is why it’s important to always do your due diligence.
💰 I also review the profits and losses I’ve taken on recent bullish trades, and why I’ve now positioned myself in select short opportunities based on what I’m seeing.
If I’m sharing this, it’s because I’m personally investing my capital based on my conviction — so always use your own judgment and risk management when making decisions.
If you found value in the breakdown, leave a like, comment, and subscribe for more timely updates.
SPCUSD trade ideas

$SPX $SPY /ES! Bearish divergence at 6000SP:SPX AMEX:SPY Bearish divergence at 6000
When we dropped to the 35EMA, which happens when we see a red signal line, then we bounced but with a bearish divergence.

Come on SPX! Let's cross back over 6,000Stop playing with me SPX. So far this week, we've seen a slowwww drift up. Ok, Monday and Tuesday did put in some solid bars, but now here we are, babying this 6,000 psychological area.
Below is my write up from Sunday. While I always state different scenarios, I've been leaning bullish...though some of my individual stock plays have retested my stop levels this week. (They have been a bit more sideways)
SPX (written Sunday 06/01/25)
Still above key weekly MAs, trend remains intact
The weekly chart still shows an uptrend. We're above the 10EMA, 20EMA, and 50SMA, and those moving averages are turning up. So while the pace of the uptrend has slowed, the broader structure hasn't broken down. This past week was a digestion of the recent April and early May run, and so far, not an unraveling of it.
Friday's dip was likely just a shakeout.
Friday gave us a candle that flushed below the daily 20EMA then quickly reversed. That kind of action often traps early shorts and clears out weaker long hands…a classic shakeout. If this theory holds, we should see strength early next week. But if we break below the 5750-5725 area, that thesis gets invalidated. At that point, I'd treat the move as something more structurally weak, not just a pullback.
Confluence zone still holding for now
We're sitting right on a layered area of support above all moving averages, and a horizontal support and resistance level from earlier this year. So far, it has held. If it continues to hold, it gives the index a platform to try the upside again.
Trendlines matter, but not more than the overall structure
I was asked about trendlines this week, and it was a good reminder to step back and recognize how I was sharing my use of them. Trendlines are helpful, but they’re just one part of the picture. Same goes for moving averages, volume, and other tools. They only hold weight relative to the context. In a choppy, indecisive market, over-focusing on any single signal can do more harm than good. I'm aiming to keep my analysis well-rounded, zoomed out, and centered on structure.
What would confirm the upside?
A clean move back above 6,000 and a push through the February all-time high would help strengthen the case for continued upside. Not just because it’s a technical level, but because it’s psychological too. If we’re breaking out into new highs, especially after the chop and hesitation of the last few weeks, that’s when retail traders tend to feel like we’re “in the clear.” That can bring in more participation, more confidence, and more momentum. Ideally, we’d see a higher low hold on any dips, and then a strong push through 6,000 with follow-through, not just a quick tag and pullback. That kind of behavior would tell me buyers are stepping in with conviction again.
What would shift the bias more bearish?
A breakdown and hold below 5725 (not just a quick flush) would suggest deeper downside potential. From there, 5600 (around the daily 50SMA) becomes the next level I’d watch for support. But so far, I’m not leaning toward this as the main scenario.
What do you all see? Will we break 6,000 and get an increase in momentum?

Balance lost, 5850 is the likely next targetUnless they save the market within the next fw hours, balance has been lost on the small time frmes and 5850 is the bottom of the larger balance area. Gold could go either way from here. Oil is also at the top of balance. BTC still looks bearish

Volume Droughts and False Breakouts: Your Summer Trading TrapsThe market’s heating up — but is your breakout about to dry up? Here’s a word about the importance of summer trading success (helped by volume — the main character).
☀️ Welcome to the Liquidity Desert
Summer’s getting ready to slap the market with a whole flurry of different setups. Picture this — the beaches are full, your trading desk is half-abandoned, and the only thing more elusive than a decent breakout is your intention to actually read that big fat technical analysis book you bought last year.
And yet, here you are — eyes glued to the chart — watching a clean breakout above resistance that’s just begging for you to hit “buy.” Everything looks perfect. Price rips through the level like it’s made of butter. But there’s just one tiny problem: no volume. None. Nada. Niente.
Congratulations. You’ve just bought the world’s most attractive false breakout.
🏝️ Summer Markets: Where Good Setups Go to Die
Let’s set the scene.
It’s June. The big dogs on Wall Street are golfing in the Hamptons and sipping mezcal espresso martinis, interns are running the order flow, and every chart you love is doing just enough to get your hopes up before crushing them like a half-melted snow cone.
This isn’t your usual high-volatility playground. Summer markets — especially between June and August — are notorious for thin liquidity . That means fewer participants, smaller volume, and a much higher likelihood of being tricked by price action that looks strong… until it’s not.
And it’s not just stocks. Forex, crypto, commodities — even the bond boys — all face the same issue: when fewer people are trading, price becomes more fragile. And fragile price = bad decisions.
🚨 Why False Breakouts Love Quiet Markets
False breakouts happen when price appears to break above resistance (or below support), only to reverse sharply — often trapping late traders and triggering stop hunts.
But in summer? It’s a whole different beast. Here’s why:
No liquidity cushion : In normal markets, you need strong volume to fuel a breakout. Without that, the breakout doesn’t necessarily have the gas to keep going.
Market makers get bored : Thin markets mean it’s easier for a few big orders to push prices where they want. Welcome to manipulation season (there, we said what we said!).
Algos go wild : With fewer humans around, algorithms dominate. And they love playing games around key levels.
🧊 The Mirage Setup: A Cautionary Tale
Let’s say you’re watching GameStop NYSE:GME stock. Resistance at $30. Price hovers there for days, teasing a breakout. Then — boom — a sudden 6% pop above.
You buy. Everyone buys. The trading community goes nuts. “This is it bois!”
But there’s a problem. Look at the volume: a trickle. Not even half the average daily volume. Ten minutes later, NYSE:GME is back below $30, your stop loss is hit, and you’re left explaining to your cat why you’re emotionally invested in a ticker.
Moral of the story? Don’t trust breakouts when no one’s trading.
📉 Volume: Your Summer Lie Detector
Volume is more than just a histogram under your chart. It’s your truth serum. Your smoke alarm. Your buddy who tells you to think twice before jumping in that trade.
Here’s how to read it right when everyone else is checking out:
Confirm the move : If price breaks out, but volume doesn’t spike at least 20–30% above the average — be suspicious.
Look for acceleration : Healthy moves gather steam. You want to see volume growing into the breakout, not fizzling.
Watch for volume cliffs : A sudden volume drop right after a breakout often signals that the move is running on fumes.
Add Volume Profile Indicators : Just to be safe, you can always add Volume Profile Indicators to your chart — they analyze both price and volume and can highlight what your keen eye might miss.
Remember what happened last summer? And how we all learned the downside of something called "carry trade"? Those who were short the Japanese yen remember .
🧠 Context Over Candles: Be a Liquidity Detective
Let’s say you see a double top pattern — your favorite. Clean lines. Tight price action. Perfect setup.
But now zoom out.
It’s July 3. Pre-holiday half-day. No volume. And the S&P 500 SP:SPX has moved 0.04% all day. Still want in?
Technical analysis doesn’t work in a vacuum. Chart patterns lose their predictive power when the environment they live in is compromised. And thin liquidity is a compromised environment.
🐍 Snakes in the Sand: How Market Makers Bait Traps
Market makers (and large players) are like desert snakes — quiet, patient, and very good at making you move when you shouldn’t.
Here’s how they bait traders in illiquid markets:
Run stops above resistance to trigger breakout buyers.
Dump shares immediately after breakout to trap retail.
Ride the reversal as trapped longs scramble to exit.
They’re so powerful some say they run the game — and can stop it anytime it’s not going their way (remember the GameStop freeze? ) It’s a psychological game — and in the summer, it’s easier to do shenanigans because most players aren’t watching.
Don’t be the one jumping at shadows. Be the trader who expects the trap.
🛠️ How to Survive (and Thrive) in the Summer Slump
Not all is lost. You can still trade — smartly.
Here’s your Summer Survival Toolkit :
Wait for volume confirmation on every breakout.
Lower your position size . Less liquidity = more slippage risk.
Set wider stops , or better yet, sit out the chop.
Focus on trending names with relative strength and solid weight (think: tech titans, oil plays, or financials).
Use alerts instead of staring at charts . Don’t mistake boredom for opportunity.
And most importantly: Know when not to trade . Discipline is a position too.
🔚 Final Word: This Isn’t the Off-Season. It’s the Setup Season.
Summer might feel slow, but it’s not dead.
Smart traders know that the best trades of Q3 and Q4 often begin in July — as early trendlines form, consolidation patterns develop, and institutional footprints quietly appear in the tape.
So use this time wisely. Don’t force trades. Watch volume like a hawk. And never forget: the best breakouts don’t need hype — they bring their own thunder.
Stay cool, stay patient, and trade smart. The mirage may be tempting, but the oasis always belongs to the ones who go far enough and don’t give up.
Off to you : How are you navigating trading during the summer months? Staying poolside with one eye on the charts or actively seeking out opportunities while folks catch a break? Share your insights in the comments!

US500 potential buyUS500 is setting up for a classic Wyckoff spring. This is a high probability set up with high risk to reward (5R+)
Here is what needs to happen
For situations 1 and 2,
a. price should break blue support (traps sellers and shakes out weak hands)
b. price should then close above any of the 2 blue supports with high volume
c. enter at the close of that bar or retest of the blue line
d. T.P @ recent high.
What do you think? how would you approach this better?

SPX500 – Consolidation Between 5966–5990, Breakout to Set DirectSPX500 | Technical View
The price is currently consolidating between 5966 and 5990.
A 1H or 4H candle close below 5966 would confirm bearish momentum, with downside targets at 5938 and 5905.
However, as long as price trades above 5966, the outlook remains bullish, targeting 5990.
A 1H close above 5990 may extend the move toward 6010 and 6030.
Resistance: 5990, 6010, 6030
Support: 5938, 5905, 5858

S&P500 awaits Trade Balance and Jobless Claims figuresTrump Tightens Immigration: Bans people from 12 countries, limits entry from 7 more, and blocks foreign students from attending Harvard.
Russia-Ukraine Tensions: Putin plans to strike back after a Ukrainian drone attack. Trump says Russia’s allies won’t profit from rebuilding Ukraine.
UK Housing Boom: Home sales rose 6% in May, the strongest in 3+ years, despite the end of a buyer tax break.
Germany & U.S.: German politician Friedrich Merz meets Trump today. At home, Germany faces rising public concern about tough economic times.
ECB Rate Cut Likely: The European Central Bank is expected to cut rates by 0.25% to 2%, but may slow further cuts soon.
Key Support and Resistance Levels
Key trading leel is at: 6000
Resistance Level 1: 6090
Resistance Level 2: 6140
Resistance Level 3: 6200
Support Level 1: 5900
Support Level 2: 5845
Support Level 3: 5800
This communication is for informational purposes only and should not be viewed as any form of recommendation as to a particular course of action or as investment advice. It is not intended as an offer or solicitation for the purchase or sale of any financial instrument or as an official confirmation of any transaction. Opinions, estimates and assumptions expressed herein are made as of the date of this communication and are subject to change without notice. This communication has been prepared based upon information, including market prices, data and other information, believed to be reliable; however, Trade Nation does not warrant its completeness or accuracy. All market prices and market data contained in or attached to this communication are indicative and subject to change without notice.

S&P500 Index (US500): Bullish Accumulation Pattern
I spotted a nice example of an ascending triangle pattern on a daily time frame.
To confirm a bullish continuation, we will need a bullish breakout
of its neckline.
A daily candle close above 5996 will provide a reliable confirmation.
A rise will be anticipated at least to 6080 resistance then.
❤️Please, support my work with like, thank you!❤️
I am part of Trade Nation's Influencer program and receive a monthly fee for using their TradingView charts in my analysis.

Skeptic | SPX 500 Analysis: Long Triggers Ready to Rip!Hey, what’s good? It’s Skeptic! 😎 Last week, we scored a nice R/R on SPX 500, and now it’s looking ready for another big move, super close to our long trigger. Let’s check it out with a multi-timeframe breakdown to grab those long and short triggers!
Daily Timeframe: The Big View
The SPX was riding a strong bullish wave, then hit a deep correction. Here’s what’s up:
It’s bounced back most of that drop and is nearing its ceiling at 6128.55. 🏔️
A break and hold above 6128.55 could kick the bullish trend into high gear, per Dow Theory.
Watch the daily RSI—if it goes overbought, we might see a fast, big rally. 🚀
This is our long-term play, so let’s zoom in for the short-term action!
4-Hour Timeframe: Long & Short Triggers
On the 4-hour chart, here’s the plan for our trades:
Long Trigger: Break above 5990.67, with RSI above 66.57 to show the move’s got juice.
Stop Loss: Your choice—put it below 5955.77, or check 1H or 15-minute charts for a tighter stop under the last low. 🎯
Short Trigger: A drop below 5856.93 lets you short, but it’s against the trend, so keep it low-risk. Take profits quick, use a small stop loss, and close when you hit a good R/R. ⚠️
Shorts are tricky here, so play it safe and don’t go all-in!
RSI Trick & Your Input
Love RSI? I’ve been using it forever, and I think most guides get it wrong. They say overbought RSI means sell, but for me, it’s a go sign for longs! Want a full RSI tutorial? Tell me in the comments, and I’ll hook you up! 📢
💬 Let’s Talk!
If this got you hyped, hit that boost—it helps a ton! 😊 Got another pair or setup you want me to hit? Drop it in the comments. Thanks for chilling with me—keep trading smart! ✌️

Andycharts, publishing key levels. We have key levels across 15 different charts which I am looking at tomoorow for contination,
SPX500 — Structural Weakness Emerging on the 15-Min ChartWe may be approaching a critical inflection point.
Price action is showing signs of exhaustion after multiple failed attempts to break higher. The market structure is compressing beneath resistance, setting the stage for a potential breakdown.
🧭 Key Level to Watch:
Support at 5,790.33 aligns with previous liquidity sweeps and demand zones. A move toward this level could reflect rotation from short-term bullish euphoria into a broader correction cycle.
⚠️ Institutional traders, are you watching the same tape?
This isn’t just about price—it’s about positioning.
Market signals:
Distribution pattern forming
Liquidity void below current level
Compression likely to result in expansion (downside bias)
In markets like these, timing is everything.
Capital flows speak louder than sentiment.
#SP500 #MarketStructure #InstitutionalTrading #TechnicalAnalysis #SmartMoney #LiquidityZones #MacroStrategy #WaverVanir #RiskManagement

All-Time Highs (3% Up) or US/China Trade Gap (4-5% Down)?It's summer time (1st week of June)
Brutally slow price action thus far, Non-Farm Payroll hits this Friday
Next week will be more US Inflation Date (CPI, PPI)
S&P and Nasdaq are only 3% (or slightly less) away from all-time highs
Melt-up momentum says it's the path of least resistance
US/China Trade Agreement Gap (that silly little Monday announcement) is 4-5% lower
Whatever we hit, there will be disappointed traders and investors - the ultimate pain trade :)
I'm not bearish, I'm ridiculously cautious as a bull and wanting to see a pullback. I can tell
because it's actually annoying watching the market grind so slow to the upside shrugging
off every bad news bite and sense of reality
The big beautiful tax bill is losing support (see Elon Musk's latest comments)
The Trump Administration has pivoted so hard the other way the market is virtually
ignoring tariff news now
Let price be your guide. I'm connecting the April 7 lows forward and if the bears cross it and price sweeps some lows, there might be some pullback potential in the cards
Plenty to watch - be patient - opportunities await. Not forcing anything for now and I'm
doing the "boring" stuff for income trading.
Thanks for watching!!!

The close - no bells ring at a topMy feeling right now is one of deja vu. Like the bottom before the president delayed tariffs, there was no volume and my assumption was we would go a bit lower. Here we have no volume and my assumption has been we will go a bit higher. Could we top here? It's possible. The bear divergences are pointing to a move down at least temporarily.

S&P500: Gearing up for a push to 6,100S&P500 is bullish on its 1D technical outlook (RSI = 64.611, MACD = 85.830, ADX = 19.630) as it has been trading inside a Channel Up for over a month. Right now it is halfway through the new bullish wave. We expect it to rise by at least +4.40%, same as the previous one. Stay bullish as long as the 4H MA50 holds, TP = 6,100.
## If you like our free content follow our profile to get more daily ideas. ##
## Comments and likes are greatly appreciated. ##

SP500 would you capture or just let it slip?His palms are sweaty
Knees weak, arms spaghetti
His nervous
But on the surface
He looks calm and ready

Acorn's Smart Money S&P SignalJune 3, 2025 - After another successful S&P signal in May, we have another Bullish signal for the first part of June. If correct, the bullish S&P indicator suggests the S&P will close above 5861.43 on June 19.

S&P 500 is Under Pressure from Weak ADP Data, Strong ResistanceThe S&P 500 is showing signs of contraction just below the key 6000 level. The ADP employment report, which revealed the slowest pace of hiring since March 2023, has raised some concern among investors. Whether this weak labor data will significantly impact the broader stock market remains to be seen.
Tariff effects appear to be gradually surfacing, first in jobless claims, then in the ISM manufacturing data, and now in the ADP report. Inflation data will likely be affected last, probably in a few months, due to the fact that both households and businesses frontloaded purchases ahead of the tariffs. As a result, the market could first confront recession fears, followed later by concerns about stagflation.
From a technical standpoint, a short-term RSI divergence is emerging, and the 6000 level is acting as strong resistance. If the S&P 500 fails to break above this resistance, a selloff could be triggered, with the 200-hour moving average as the initial target. Should the index fall below the 200-hour level, bearish momentum could increase, potentially deepening the correction.
To invalidate this negative scenario, the index would need a clear breakout above 6000, confirmed by multiple daily closes above that level.

Balance could break todaySPX may go higher but it could be a false break according to the RSI. Gold looks like it will go higher. USOIL is retreating from resistance so far. BTC still looks like it will drop.

US500 Bullish Outlook US500 Bullish Outlook
US500 is well-positioned for another upward wave.
The price is forming a bullish triangle pattern, suggesting further gains if it breaks above the pattern or surpasses 5990.
Key upside targets are 6100 and 6240.
Investors are closely watching any new trade deal. If Trump rejects any deal or issues threats, the US500 could temporarily fall to 5930 before resuming its rise.
So far, the overall trend remains bullish, with no signs of reversal as long as key levels hold.
You may find more details in the chart!
Thank you and Good Luck!
❤️PS: Please support with a like or comment if you find this analysis useful for your trading day❤️

S&P 500 is going in a ranging mode5704 is a historical key level, now we are slightly above it; for serious buyers we have to wait until the news; we will watch a retracement in this zone then we can take our position long

SPX Key Levels to Watch Jun 4 In today’s analysis of the S&P 500 (SPX), we’ll break down the crucial levels to watch as we head into June 4th. After perfectly testing the 5929 level yesterday, the market bounced back, setting the stage for potential moves. We’ll discuss the new support range between 5954 and 5967 and what it means for traders. If this range holds, we might see a rally towards 6165, but if it falters, a drop to 5850 could be on the horizon. These levels are highly actionable, so stay sharp and ready to react!

Something Brewing on SPXCup and handle brewing on the SPX daily. All time highs are near. See you there before the pullback
