05/20/25 Trade Journal, and Where is the Stock Market going tomoEOD accountability report: +293.75
Sleep: 4.5 hours , Overall health: Calm and tired. need to catch up on sleep.
What was my initial plan?
Market structure was bearish so, I started the day shorting, but once market flipped bullish, I switched to BTD mode.
Daily Trade recap based on VX Algo System
— 9:00 AM Market Structure flipped bearish on VX Algo X3!
— 10:20 AM VXAlgo NQ X1 Buy Signal
— 11:18 AM Market Structure flipped bullish on VX Algo X3!
— 12:30 PM Market Structure flipped bearish on VX Algo X3!
— 1:20 PM VXAlgo NQ X1 Sell Signal
— 3:13 PM VXAlgo ES X1 Buy signal 2x signal (C+ set up)
Next day plan--> Above 5900 = Bullish, if we lose 48min support at 5900--> 5800 next
Video Recaps -->https://www.tradingview.com/u/WallSt007/#published-charts
SPCUSD trade ideas

The Three Main Things That Happen at 86 Fibs.As some of you may know, I have a bit of an interest in how trend moves have historically formed and failed.
I am interested in the subject generally, with me having put a fair amount of time into just understanding the basic timeline of historic events, reading the different studies on market hypothesis' and checking how these perform or fail in the fat tail events, but when it comes to trading I have a few main interests.
--How can we approximate what zone a top would generally come if we're topping.
--How do we survive being early on that.
--How do we know it's wrong and we should flip long.
--The typical break/capitulation level for bear trends.
--Where we tend to bull trap from.
--Styles bull traps and market recoveries.
--How markets generally bottom after extreme events.
The answer all of those questions is an optimistic endeavour but these are the main things you have to understand to make it viable to be able to bet on the major turning points in these fat tail events and to be able to take exposure without going broke if you get it wrong. Be that trying to buy lows or fade highs.
During the last bear move we posted short analysis at the top, throughout and then posted the different possible bull traps while we were at the low. To this point, the general norms of the historic analysis have held up. Now, we're into the 86 fib which has tended to be a critical area for the trend decision.
In this piece I'm going to go through the main types of reactions we get here and how one can aim to make a plan that will be profitable in all types of scenarios.
Many of the things I'll be discussing are generic retracement rules and if you follow my work you'll know them from my 76/86 theories that I discuss regularly, but all of what I am about to cover here also checks out on the SPX chart. I have manually went through every single drop of over 10% in the SPX and then modelled the different rallies from there. Be them recoveries or crashes - these rules tended to be useful in most of them.
Let me start by giving a very brief history of my use of the 76/86 fibs. The original rules I had for this was a reversal should come just a little bit before the 76 fib. I'd buy/sell close to the 76 fib and use a 76 hit as my stop loss. These were great times. It would work a lot and it'd pay over 1:10 RR sometimes when it did.
Over time this became a little harder and I had to increase my tolerance zone for spikes above the 76. My rules then became to trade close to the 76 and if the 86 hit then I'd stop out because I think it'll go higher. Most of the time we pullback first, but the 86 hitting I used to class as a failure of the reversal.
This worked well (Albeit with reduced RR) for a long time but during the 2022 bear market this theory has significant failures with us tending to trade to the 86 and then put in full reversals. Given my bias is trade the reversal on the 76 and expect continuation if the 86 hits, this was a problem. My default rules would pick up losing signals on both sides. So I had make some further amendments to the idea in 2022.
I've used the general idea for about a decade in total now, with some minor adjustments along the way.
This framing is important because the general default rule I'd have here is now we 86 has hit we probably pullback a bit but it's a net bull bias- however, that strategy has weakened and I have to be a bit more agnostic now. Before, by this point I only have bull plans and ideas of how to stop out if I am wrong. With the new tendency for 86 hits, I need a bear plan also.
First we'll deal with the outcome that I find happens least often, the clean 86 break.
I hate this move. Be it on the upside or the downside I always find it easer to make money when something happens at the 86. I don't even care what. When it trends through I don't expect it because it only happens about 20% of the time and I can end up in a tricky situation where the market jumps from one resistance level to the next and I never want to buy and generally am bias towards fading the move - which can go really bad if the reversal thesis is wrong.
When this clean break is made it's usually built in a trending way. Higher lows in an uptrend. I've found the best way to deal with this risk is if there's any credible risk of the 86 breaking I start to buy all the dips when they're at deep retracement levels. What I "Think" will happen doesn't matter. I know if we head into the type of break I dislike I'll do poorly if I do not start to fade the 86 early. I'd rather lose one or two small trades trying this than end up in a situation where I find it hard to know what to do for months.
If we get back above the 86, this is the plan. Just buy all the dips until it fails. If it fails early I'll probably lose 2-3% over a few trades. If one trade works and I lose after I'll end up even. If they all work I'll end up with over 30% for my 3% risk. Although I do not "Think" this move is likely, when you can risk 3% to make 30% and cover yourself from the things that are tough to deal with - that's a good deal.
The most typical result in SPX history (and in general 86 theory) is we make a crash like move off it but this only goes to the 50 fib.
Very common. You'll find this in SPX recoveries from as early as 1920. Obvious ones after the 2008 crash etc.
This is a net super bullish setup but we'd be in for a drop of about 10% first. It's the most common outcome and if it was not for the need to edit rules due to stop hunting this would be the only main plan I had right now. The plan would be to trade this and everything else would be planning how to not lose too much if something else happened.
If the 5o fib breaks, we tend to capitulate to the 23 fib.
From here is a bit of a tricky spot because a lot of different types of things can happen but inside the context of the overall move we have, this could foreshadow a massive break. If and when we get there I'll discuss more about the tactical trading decisions one can make in this area.
I think for the bear thesis to have a chance we need to the monthly candle to close with a wick on the top. A drop of several 100 points into the end of the month.
Giving the size and speed I'd expect this move to be, it'd almost certainly be a news related move.
If that marker hits, then we'll discuss the decisions to be made into the support levels.
If we uptrend above the 86, then it's buy all dips until it stops working, review after.
But one thing is for sure, this is historically the riskiest spot to be short term bullish. Even in a bull setup, you're wrong 3/4 times on long entries here. In a bear setup, things get really nasty.
Bulls should be super careful if the 86 can not break. Bears should be careful if it does.
The historical analysis clearly shows if you make mistakes here on either side you can take crippling losses. No one should be overconfident at these prices (most people are though).
The bears have the edge for the next 10% under the 86 but if they are wrong there are so many different ways it can end up terribly.
Bulls are at the point where they should be most careful, but as it generally is - this is when they feel bulletproof.
Interesting spot.
For my part, I plan for everything and trade what happens.
Being profitable is more important than making bold and clever predictions if you do this for a living.

SPX updateI expect a correction to retest 5400 area before last bullish leg to new ATH@6180 then in my view bearish cycle will start and push SPX to at least 4100 area

S&P500 Short: Attempting to break the trendlineAs an update to my previous idea to short S&P500, this is a short video to update the stop and to point out the break of the longer-term trendline.

Temporary euphoria fades, a sharp correction is likelyThe current index surge appears increasingly disconnected from core fundamentals. Markets have been brushing aside key economic data, rallying instead on short-term sentiment and speculative flows.
⚠️ Once this temporary momentum fades, I expect a pullback to 4800, with a possible extension toward 3900 if macro headwinds intensify. This setup reflects a growing divergence between price action and economic reality—something that rarely lasts.

S&P500 short: Bigger Picture AnalysisOver here, I updated the wave counts and commented on that the alternate count is still a bearish count. The upper trendline will be where we can consider shorting if price does make a higher high, and the lower trendline will be the breakdown line.

If We Break Here, Trend Decision is Likely Around 5500.I've recently posted various different bullish considerations for breakouts because given the macro context of where we are, if these are made they could be extremely strong.
However, at the exact moment in time we're still trading right at a major resistance level. We trade at the 86 fib. Historically, SPX pulls back from here about 80% of the time. Usually a correction, some have become crashes.
If we uptrend above the 86 - this is extremely bullish bias and the plan is buy all dips betting on the local trend structure to hold. Getting out as soon as there's not flawless higher lows on the dumps.
We have traded a tiny bit above the 86 recently but if we do not break it again then the chances of a 10% drop are strong.
At this point SPX could easily drop to around 5900 in the bullish move. That'd be expected at this point I'd say. Part of a simple trend development- but if the 5900 level breaks, then we're likely heading down close to 5500.
The 5500 forecast is the bullish forecast.
In the event of us seeing this month closing down with a big wick candle above it and then us making a bear break - next month could be a huge bearish engulfing candle.
We really are at a very interesting spot.
Sized up on various different types of bear bets here at 5940.
If we continue to see local uptrend I plan to buy all dips and trail stops and hopefully this could build into what may become a sensational breakout. But if supports start to fail - I do not think this is going to be a drop to be buying. I'll be extremely bear bias on the breaking of 5870 or so = and in terms of the RR on the move, the bear bet now is optimal.
Big decisions to be made in this area. We must be close to them.

Pretty bullishUntil the 50MA (monthly) is not broken down and the parabolic move is neither broken down. 7000 pips are coming soon.

The Bullish view under ELLIOT WAVE top of 3 6181/6235Based On what has been happening in the structure in The SP 500 I tend to think the sp cash sees a retest at 6417 or extend the rally to 6181 alt 6230 for the top of #wave 3 or Wave B . both should see a 350 point decline back to 5830/ If 5 is equal to One a 646 point rally should be seen in wave 5

US500: Bullish Trend Holds Despite Moody’s DowngradeUS500: Bullish Trend Holds Despite Moody’s Downgrade
On Sunday, Moody’s downgraded U.S. debt to AA1, citing rising interest costs and unsustainable debt growth. They noted that U.S. debt funding costs are much higher compared to similar economies, with interest payments significantly exceeding those of similarly rated countries.
At the market open on Monday, US500 dropped from 5959 to 5874, losing nearly 1.40%. While this downgrade was expected to have a bigger impact, the index quickly recovered, reaching a new high of 5972 after the U.S. market opened.
Despite the initial dip, US500 remains in a strong bullish trend. Unless a major event shifts market sentiment, the index is likely to continue rising. Even if small corrections occur, the overall trend is still intact.
You may find more details in the chart!
Thank you and Good Luck!
❤️PS: Please support with a like or comment if you find this analysis useful for your trading day❤️

Why You Shouldn't "Hope" for Bear Markets.A lot of the underlying TA analysis to support this is contained in my other post about the 4.23. It's recommended you read that first to understand context.
Click below;
This isn't an analysis post. In this post we won't be dealing at all with the idea of if you should expect, plan for or take steps to protect yourself against bear markets. We're going to focus solely on the fact some people really want it. They want it bad. You can tell by how extremely excited they get whenever there's even a mild hint it will happen.
Some people think I want this. They say the funniest of things. The amount of times I've had someone say something like, "Don't worry there will be a crash (some variation of "But when I say so" usually goes here) - which silly concept. The idea I "Worry" there will not be a crash. That I have a thesis in which millions of people get hurt, but at least my idea was right.
If you understand the scope of things that happen in a true bear market, to think this way is very shallow and selfish. People are liable to lose everything they worked their whole life for. Families losing security. Kids can end up on the streets. It's a dire tale - and to hope for this to happen just so you can say "Told you so" is a terrible way to be.
There are two good reasons as a trader you may want the market to go down.
1: Volatility. Markets get faster on the downside and if you're good, that means more money.
2: Benchmark beating. Unleveraged it's hard to beat SPX in an uptrend. Pullbacks help, a lot.
Both of these are now what I'd consider largely invalid reasons. They were good ones to have before but now we have massive volatility on both sides. We're inside an expansion of volatility which will likely continue whether we go up or down.
On benchmarking, it's important if you're in the asset management game but at this point you should be so far ahead of the benchmark that it's irrelevant. Good active traders at this point should be streets ahead of passive investors and passive investors should not even know it because we're back at highs and they think that means they have optimal performance. What they think doesn't matter, you can show people with money your results and being so far ahead of the benchmark greatly benefits you.
At this point in time you can be suitable ahead of the benchmark on a risk adjusted basis and have the prospect of heading into hyper volatile markets where you can make a fortune on either side. And if you're not in this sort of situation, you're not going to make a lot of money in a bear market - anyway. You probably have too strong a leading bias on the bear side which has led to you round tripping gains and even in a sustained bear market this same thing will happen in the bear market rallies.
A prominent reason some people hope for a bear market is simply want to see bulls fail. It seemingly annoys them no end to see other people doing well by doing something they think they should be punished for. While they often won't outright admit this, it's clear in the tone of how they speak. The way they celebrate any time someone bullish might have maybe lost some money - and they are eager to tell you how they are going to go broke in the next leg.
This is a bad way to be. In life. You should not be too bothered about what other people are doing. How they get on with that. And you should not expressly hope people fail and suffer just because they have a different idea of market analysis from you. It's not a healthy way to be. It's bitter and caustic - and that isn't stuff you want to cultivate as personality traits.
You can spot people who are like this easily. They'll generally dress it up as "Warning people" but it's not warning people when you cheer and jeer if the bad thing happens to them. That's called "Gloating" and if you were really interested in the helping of people, you'd not gloat. Indeed, the bad thing happening to them would be consider a failure on your part. Your warning sucked and no one listened.
When it becomes stupidly obvious what motivates these people is when the market goes up and they get mad. If this happens, you're not "Trying to help". You are hoping they will fail so it validates yourself in some way. Which is bad ... You want to address that and find a way to validate yourself without needing others to suffer for you to have "Told them so".
If the 4.23 thesis is correct them whatever way to market resolves there's liable to be a mega trend. If you're in the game to make money - which way is better. Up or down?
It's up. Clearly. Because when the market goes up your risk is contained to things like fraud and malpractice with your counter parts. You bank and broker are only going to go under if something extremely shocking is unearthed. In a downside market, it only takes one thing to have a problem and through the magic on contagion all of your banks and brokerages now have a problem.
You know what problems with banks and brokerages mean? They mean you put effort into making money you might not get. It's not the thing to be "Hoping" for. Is it?
It's really dump, to be blunt about it.
When you drill down into it the two main reasons people want a bear market are they don't like seeing bulls succeed and they want to be able to say they got it right. That's the bottom line with most bear forecasts. And you can always tell because they'll be upset if the market goes up.
The other is basic ideology of how markets "Should act" but this is basically just hoping the bulls fail and also generally totally detached from the reality of how markets have always acted. Markets have never acted "As they should". Never in 200 years. Why show up now and moan about it?
These things are all entirely non important. When you weigh them against the known outcomes of bear markets. Millions of people suffering. Risk to financial structures. Increased chance of slippage and gap events in the market making it hard to understand and control risk. Just so you can "Be right". Or just so people you don't know can suffer because they did something you didn't do and you're not happy that went well for them.
At the risk of repeating myself ... not a good way to be.
There used to be a bit of a good reason when it comes to social media because sites like this have become increasingly less useful/interesting as the uppy markets continue. More and more we have the future knowers that will insist you use their ideas. You may not even discuss your ideas. If you do, you should be mocked and branded as .
While a solid bear market would bring an end to this we'd run into a couple problems. One - the bears would take their place. We seen this at the April lows. When I posted bull analysis at the April lows bears showed up with all the same tone and noise of bulls when you post into resistance. Like the bulls, if they're right they come back to tell you how stupid you were and if they're wrong you'll just not see them again until they're right. Where they'll come back to remind you how stupid you were, even if you've already banked profits on all your ideas at this point.
This is mildly annoying but it's not the sort of thing that you should pick global disaster over. All you have to do is just not read the comments. Granted .... the fact you have to post analysis that's the popular idea here or you should not bother reading the comments because it's be full of childish nonsense isn't ideal for social networking. It doens't make these kinda place "Fun" places to be. But it's better than the wipe out event.
And now even the wipe out event will not significantly improve the content one should expect. It used to be the case if there was a wipe out event then most of the people posting would be -people who have some deep experience trading either side of the market and can offer insightful ideas.
In the previous drop we seen how this will play out now. People will not know what they're talking about but rather than let that slow them, they'll just get ChatGPT to write the post for them. And it will be entirely standard and predictable posts. Most of the "Bear market analysis" I seen in April can be duplicated by putting about 6 words into ChatGPT.
If I can prompt ChatGPT and read your post - why would I read your post? I can ask ChatGPT the same thing. Can ask for more detail. Give more context. Chat back and forth about different outcomes. Or I can come to social media and read the same 5 bulletpoints over and over again. It's not hard to see which is more interesting.
So even the idea that we'll have more interesting content from more objective traders is largely out the window now. We'll probably just have generic ChatGPT posts.
"Hey ChatGPT, write me an essay on tips to trade a bear market".
That's how most of the bear analysis in April was written.
All in all, the only two reasons people hope for bear markets at this point is ideology and ego. Both are things you should leave at the door when you enter the market.
Whether it will happen or not is something yet to be determined, but it's not something to hope for.
Although I will say this, if the 4.23 breakout comes I think sites like this will become essentially unusable for people interested in discussing strategy, odds and contingency planning in markets. It kinda already is and it would get much worse. Unless you want to post, "I too agree with the popular idea" you may as well not post.
And if everyone is posting the same thing, you may as well not post.
But these are small prices to pay to know your broker is probably going to stay in business.

S&P500 Steady Channel Up to 6100The S&P500 index (SPX) has been trading within a Channel Up pattern from the moment (April 22) it broke above the 4H MA50 (blue trend-line). For that 1 month period, it has held the 4H MA50 and that maintains the bullish trend, generating Bullish Legs to High after High.
The last two Bullish Legs have increased by +4.92%, so as long as the 4H MA50 holds, we expect the current Leg to be completed at 6100.
-------------------------------------------------------------------------------
** Please LIKE 👍, FOLLOW ✅, SHARE 🙌 and COMMENT ✍ if you enjoy this idea! Also share your ideas and charts in the comments section below! This is best way to keep it relevant, support us, keep the content here free and allow the idea to reach as many people as possible. **
-------------------------------------------------------------------------------
Disclosure: I am part of Trade Nation's Influencer program and receive a monthly fee for using their TradingView charts in my analysis.
💸💸💸💸💸💸
👇 👇 👇 👇 👇 👇

Should you listen to JP Morgan CEO, Jamie?Jamie could be right about Quarter 2 where we start to see the effects of the tariff hurting the US markets. Earnings down, that means PE will follow and share price comes down.
But should SELL all your US assets like what some influencers are telling you? I can't decide for you but I am holding to it and ride it through. Why? Simple - I am not smart enough to TIME the market knowing exactly when is the bottom and when is the peak.
That is what some gurus are positioning themselves to be, naturally with some courses involved and a membership into their group chat,etc. It is obvious only the profitable trades are displayed on social media for all to see so that FOMO effects kicks in. WHY didnt I join this club else I would be the one also making the profit?
What I love about WB is his wisdom. He said learnt to take the risk and the returns will come. In that, he means doing the necessary work , research on why in the first place are you buying a particular company and not midway, let it affects your decision to start dumping.
I also think some traders/investors have unrealistic expectations, thinking that every single trade they undertake must yield a profit. They believe in the method they are using so it is hard to accept when SL is hit. I have said umpteen times. Whoever can come up with a system that yields consistent profits, he would not be marketing it but first borrow so much money to bet on it himself and make a millionaire or multimillionaire out of it. That is the logic instead of touting it online and kept promoting how good it is.
So for me, I am hanging on tight to my good quality companies and not selling anything at this juncture but keeping an open mind to what's to come in the near future.
As usual, please DYODD

S&P500 Short: 5 waves with Fibo Extension levelMy previous nasdaq idea was stopped out. But I think it is worth it to try again. But try on S&P instead.

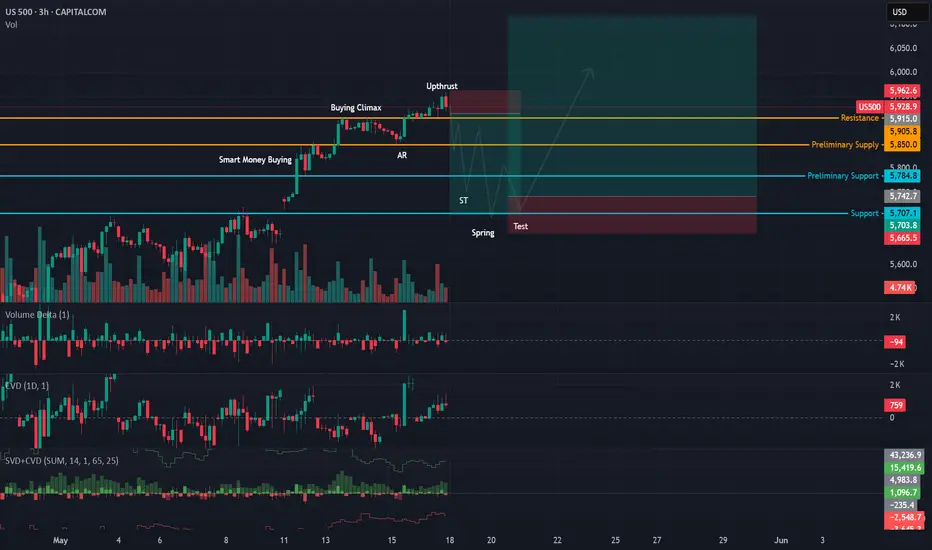
US500 | Potential Wyckoff Reaccumulation UnfoldingThe US500 appears to be working through a classic Wyckoff reaccumulation phase following a strong rally during price mark-up. After a swift move upward, price formed what looks like a Buying Climax , followed by an Automatic Reaction (AR) and now an Upthrust at the recent highs.
So far, volume and delta behavior are aligning well with this. During the upthrust , we saw increased volume, but delta turned negative, indicating selling pressure into strength. This was also accompanied by a CVD divergence, showing that although price pushed to new highs, the underlying buying wasn't supporting the move just yet. That often hints distribution by strong hands as late buyers step, likely fuel by the good ol' Trump Pump.
With that in mind, a pullback into the lower range is expected to create the Secondary Test (ST) . This could lead to a possible Spring , a shakeout below recent support (around the 5700–5720 zone) meant to trap sellers. Ideally, this would be followed by a Test , where price returns to the Spring zone on lower volume and stronger delta/CVD confirmation, signaling demand returning and absorption of supply. But this is all to be determined.
This doesn't have to play out exactly as I mapped. But if we see something similar play out, it would lead to higher prices and confirmation of the mark-up phase. Until then, patience is key, this phase of the structure is about traps and tests, not breakouts.
The Macro Importance of the 4.23 Breakout or Fake-outWe are at an incredibly interesting and unique point in SPX. I am fascinated to see how this ends up resolving.
Based on everything I know, these things predict extreme trend events come next.
First let's take a moment to qualify the idea the 4.23 is going to be important. The idea of using a line generated by a multiple of a swing that happened almost 20 years ago to make decision on what will happen in the next years sounds silly. I know that. But look at what happened on all of the previous fibs. Seeing is believing.
This doesn't tell me the 4.23 has to be important, but it supports the idea it may be. If you bet any of the previous fibs would not be important, you'd have been wrong. All of these did their thing in one way or another at one point. It's quite incredibly, really. Especially if you understand that these pullback/breaks levels are common any time you use these fibs in a developing trend. They tend to react to the same levels in the same ways. Then it happens on the Big Stage .It's amazing.
And if it continues, the next thing is ultra amazing.
The 4.23 head fake has disastrous forecasts. In the full play out of the 4.23 rejection we return to the 1.27 fib. In this case, that'd be a Depression style event. When a trend forms through fibs having all these pullback/break reactions and it gets to the 4.23, if the trend fails there -a massive mean reversion move happens.
When applied to a decade long rally, that would be horrific. This is the macro bear risk I have discussed at length, generally taking shorts into the fibs and covering/reversing long into supports). In the grand scheme of things the 4.23 area would be seen to have been essentially the top with some wild blow off action above it that turned into a head fake. We'd be right in the end times. A lot of nuance is needed for real trading but in a historical analysis it'd be seen that we were at the high now.
On the other hand, if the 4.23 breaks we usually see a move that is equal in size to all of the move before but happens in a fraction of the time. 4.23 breaks can be a wild with all supports/resistances being easily broken in big persistent candles. 4.23 breaks are rare, but they tend to put you into the most exceptional of price moves.
For context, when a 4.23 breaks when I am trading them on a 15 min chart prices are moving that fast I generally don't have time to do much. Even if I am sitting there watching at the exact moment it kicks off. It's like this;
"Wow! Okay I need to think what to ... WOW!".
Prices are moving too fast to process any reasonable plan. By the time you consider the situation you're in, you're in a totally different one. Nice conditions to be trailing stops. Hard to enter into.
The magnitude of a 4.23 break here would be astonishing based on the previously discussed norms. It'd predict that SPX would go into a move where it was doubling from the high. Furthermore, it was doing it in a tiny fraction of the time it took the previous rally.
For our doubling number it'd be best to take the breakout of the 4.23. Let's call it 5000 to keep it simple. Would give us an upside target of 10,000 in SPX without accounting for any stop hunting or overshoots. It would also imply that this happens in a crash up type of move. "Crash" being defined as a strong and sustained breaks of SR levels with no big reactions.
When it comes to tactical trading this is a total nightmare at this moment in time with the suggestion of massive profits (with potentially easy markets) in the coming year or so. At this point in time it's very tricky. If you accept the premise that either we're in a head fake over the 4.23 and a very aggressive rejection is coming or we're now into the start of what will become hyper over performance in the trend you have to consider this as a bit of a limbo point where there could be a chance to do well one way or the other but if you screw up something terrible will happen to you.
If it was a 4.23 fake out we'd have a super strong sell off. There could then be a big bull trap coming up to a double top/spike out and this would then turn into the most sensational of crashes down to under the 4.23- as the macro uptrend experiences what will become its first major trend failure.
The action in that move short term would be insane. There could be some late month rejection here (or next month) and then a massive monthly engulfing candle. We could see a month -20% or so and then see follow through down months. The amount the market could drop and how fast it'd be predicted to drop make it enticing to bet on this.
To bet on this, you have to bet into the rallies. There are too many times we dip and rip to try to sell after bear candles etc. They produce too many false signals. You can end up losing money even if you hit the big trade eventually. Betting on rallies allows you higher RR and when there are short term pullbacks you can get stops into even.
But that leads us to the headache ...
If we're inside a real breakout of the 4.23, we're in the foothills of what will become the most exceptional of rallies. During this, we should see massive high momentum moves up. These will generally go from one resistance level to another. Said differently, you'll see the spikes that seem ideal to fade into the levels you think are the levels to fade - and they won't be levels to fade.
Conversely, the bull strategy would have you aggressively buying all dips and breakouts. When you see momentum looking to get in one it quickly. If it pulls back, all the better. Doesn't matter if you take a string of losses because if you end up in lower at the end and it makes a new high you'll be net up on the round trip. The trend is going to be accommodating and it's only going to get better and better. You can't lose on the upside, and if you come at it in a really attacking way you could perhaps position before a massive upside move.
But you might be doing that into the very end of the trend and have all sorts of sickening gap risk/slippage risk and margin call risk.
Of course, the 4.23 thing might end up not even being important. But from the lens I see markets through, I have to think it will be. If it's not, I'll be surprised. And it makes me believe that whatever way it goes there has to be something exceptional.
When it comes to these juxtaposed outcomes watching price is not all that helpful. Because this can happen in an up move.
With this happening in a down move.
It can be really hard to tell things apart until the point where you've lost is crossed.
If we break the high and you think we're going higher, it's important to be aware of the risk of a bigger pullback. But it can just break and run, too.
Or to the downside it could break abruptly.
Breaks more commonly have traps in them and would look something like this.
So we have a unique situation where I think it's fully justifiable to expect there would be exceptional moves with the market going up 100% or down over 60% - and both of these would be expected to happen within a short period of time. Bulk of it over a couple years. But the nuances of how to go about positioning in a risk efficient way are tricky.
On the bear side, you should be fading this rally and looking to build positions into drops as they develop. But if you're doing that against a bull trend you'll get decent entries if you're good with resistances but build up a position into support and end up down/even on all your entries. And you'll lose a lot of entries with no reaction - so you'll lose overall.
On the buy side you should be aggressively accumulating and buying close to supports but in the 4.23 head fake thesis this would be literally the worst time in your life to do that.
If you're buying and we go up and breakout, you should buy more. But if it's a breakout/correction then you'll get nailed. You can buy more into the correction but you might be "Exit liquidity" in the dump. In the dump, you can short aggressively but are liable to get cut up a dozen different ways.
This set of dilemmas are always something faced when you're trading at a binary inflection point. Even on small charts when we trade at 1.61/2.61 and 4.23 levels this set of paradoxes exist and are tricky to know exactly what's best to to do - on the Big Stage, it's mindboggling the different things that may happen. And daunting knowing the different traps.
If this 4.23 thing is going to be right, the one thing that is sure is there's going to be well above average chances to make big money when the 4.23 decision is resolved.
The 4.23 rejection would be a terrible event. And with who knows what types of real world impacts/reasons. From an intellectual standpoint it is fascinating. If we went into that style of crash now we'd have done it off basic TA patterns, mirroring major crashes of the past and even the interest rates cycles would have been the same as previous bubbles. In the final analysis of it, almost all aspects of the formation and bust of the bubble would have been foreseeable with basic pattern matching ideas. All of the things that have happened in the last 50 years and then all of the crazy things that'd have to happen for a depression crash in the years to come - all foreseeable with extremely basic pattern ideas. The fact everything has matched as well as it has so far trading through the fibs is already remarkable. If it was punctured by a mean reversion fat tail ... wow! On a personal level, even just in the minor drops of 2020, 2022 and recent one it's clear to see indices going down a lot is going to really hurt people. At this point we're just seeing this in speculators but it makes me think about what this would be like on a grand scale. It'd not be nice.
The 4.23 breakout thesis is fascinating and exhilarating. A prospect of heading into the major boom section of a mega trend and having full awareness of that being what you're heading into and approximately where you can expect that to end up going. These would be conditions where someone who knows what they're doing can make insane amounts of money. Even just showing up will make money (as long as you don't end up overstaying). In this extreme doubling event we would still be predicting bad times ahead - but they'd be differed by a couple of years. From a selfish point of view this would all seem great. To benefit from a bubble and be able to bet on a spectacular reversal later. From a humanistic point of view it seems like it'd only cause greater devastation later. No one cares now because we're back at all time highs and boohoo anyone who sold the bottom, but at the lows of April there were anti suicide posts pinned in trading forums. That's how bad things are now on a 20% drop. Think how much worse they'd get if mania develops more.
It's an interesting time. For the sake of sanity and profitability I am doing my best to be as agnostic as possible about what the outcome will be. Plan for all, execute as suitable. I hope we see the 4.23 break. It's the better of the trading ops (Since it offers two massive swings) and if we can crash up or down by the same amount of points, who cares which way it goes? Trading long can be logistically easier in many ways, so it'd be the preference if all else was equal. And being a bear is tiring. It's particularly tiring having to explain to people stating a statistical observation on a SR level doesn't mean you're depressed, angry, a shill and having a different opinion about markets does not mean you hate them. So they don't have to try to fight with you. Every 5 mins...
If you're a bull and say something will go from 100 to 130. And it goes to 40 then it goes to 129 ... you were always right. That's what people say. If you're a bear at 100 and it goes to 120 then 40 you were an idiot that got lucky eventually. I always find that funny about social media.
We're in interesting times. If my 4.23 hypothesis turns out to be correct we're heading into the history books. It's just a question of "For what?.

US500: Resumed the Predominant TrendUS500 Resumed the Predominant Trend
US 500 index on a 4-hour timeframe, is showing upward price movement with target levels marked at 5,980 and 6,100.
The current price is indicating strong bullish momentum after the breakout of this solid triangle pattern.
The price may test the broken resistance zone again near 5730 before it moves up further.
If the price holds above key support levels, it could aim for the upper targets.
You may find more details in the chart!
Thank you and Good Luck!
❤️PS: Please support with a like or comment if you find this analysis useful for your trading day❤️

We're Likely to Come Out this Zone Extremely Strong. Inside the general zone I have marked in here is where the 4.23 / spike out range of the 2008 drop was.
The 4.23 is a massive inflection level and when we get to a 4.23 three are usually one of two things that happen. The trend either drops by usually more than 50% - or the trend goes onto double in a manner far faster than the previous occasions.
It's difficult to put an exact price or condition on when this zone has failed because stop hunts suck - but if we keep uptrending above local resistance levels then it's wise to begin to consider the failure or the resistance zone may be happening.
I really want to enthesis the historic importance of 4.23s. At them we're usually seen major bubbles end (1929 was a 4.23 top) or uptrends turn into exceptional bubbles (Nasdaq broke a 4.23 in 1996 and went ultra parabolic).
Truly exceptional conditions are likely to happen upon the resolution of this 4.23 zone.
What happens here I think will set the trend for the coming couple of years.
And if it breaks, I think you'll see SPX doubling from the high price.
Based on all historical instances, if we break the resistances markets are liable to go vertical here. Really not a time to be stubborn with a bear bias.
Bear trades into resistance have a good case, but buying all the 76 dips until they fail is a total no brainer and would become insanely profitable if the breakout holds.
Even if we're going to make a top, you could typically make about 10% based on 1% risk per trade 1:3 RR on longs if local lower highs hold.
To my bearish friends, be very careful. If the break comes, it's likely we'll only get stronger and stronger.

update at 215pmmarket may stay bullish into the end of the day but there are warning signs that we may pullback overnight and into tomorrow. Bias is still firmly up however, so nothing is certain regarding a pullback until we actually see one.

If SPX Uptrends Above 86 Fib, It's Buy All DipsIt's really surprising to see SPX rallying again today after the 86 fib hit - with the drop off it holding basic trending conditions.
This doesn't happen very often. When you look at all instances of this in SPX history you'll find about 80% of the time it drops much more from here. Whether it's a bull or bear move overall.
In this area there's a lot of risk of being rugged on the long side because the move is hyper extended / high ATR and even a moderate correction can be 10% - however, if we continue to consistently uptrend above the 86, then it's buy all dips.
When an 86 breaks without any notable pullbacks, it tends to trend on small timeframes. Bluffs bear moves a lot - but keeps holding inside the last low and makes new highs.
This is something that can happen inside of both tops and breakouts. Topping moves can spike out the high by a nominal amount and then drop - like the2007 high did.
Trending moves can break the high, hold retests and continue to grind up, like the 2021 rally did.
In either event - the smart bet is to buy all the dips because they offer 1:3 RR, you'll usually only have to lose 3 of them to work out that's a bad idea and that means it's quite unlikely youll lose money - conversely, if it continues to uptrend, you'll make bank!
If the 86 is not a resistance level, then next upside level is 6130. This would seem best case scenario for bears.
In the bigger picture, SPX has come down off extremely important long term resistance levels. These could be a major top. It's a considerable risk ... but if those levels are going to break, then we are probably going to head into exceptional uptrends.
If we do not top out at the macro resistance levels, then it's probably going to become close to impossible to make money as a bear. And I mean that in terms of over the next couple years. Not just for a little while.
The last 5 yrs have been optimal yrs to be willing to trade both sides of risk assets. There have been a lot of ups and down. I think if we have a failure of the bear attempt here that will turn into a market that's very unfriendly to bears. Even if you only trade good levels you'll lose money.
If you used good entry and stop trailing rules, there've been fortunes to be made on the bear side of the last years.
But if we break this time, I find it very unlikely you'll see me being bearish for the foreseeable future.
The upside potential on a monthly resistance break here would be staggering.
While we were at the low I made a detailed explanation of how my bias over the coming years would be informed by the outcome of the rally. We're into the action end of that now.
If we uptrend above resis, it's buy all dips. There could be a tricky spike out bull trap and there could be an exceptional rally.
In the rally scenario, we'd soon enter into conditions where massive profits could be made over the next 2 year.

Why Greer Buy Zone is so powerfulSPY has just entered the Buy Zone. Historically, buying at this point has led to positive returns over the past few decades. Check out the video and let me know what you think!

SPX Dead Cat Bounce now its time to go down.There was an extreme case of dead cat bounce and now its time for the index to go back down

5/19/2025 sp500It was a great purchase, I bought it based on the balanced fvg on the larger graphic times and the liquidity that needed to be captured on the buying side, it would be better if I posted on lower timeframes to have a better idea of the liquidity regions but it is not possible to post below 15m, hope you guys enjoy
