US 500 Index – Upside Rally Facing A Ratings ChallengeThe US 500 index recorded a 2-month high of 5958 on Friday before settling back to close the week at 5922, an incredible 24% rally from the index's tariff induced lows at 4799 seen on April 7th. Impressive indeed.
However, late on Friday evening the ratings agency Moody’s downgraded US government debt from its top credit rating of Aa1 to Aaa, citing a ballooning budget deficit and no clear plan to narrow this in the future.
This Moody’s decision generated some weekend headlines in the financial press around the sustainability of President Trump’s plans for unfunded tax cuts as the US economy slows due to his recent trade tariff announcements. This even led to a comment on the downgrade from the much-respected US Treasury Scott Bessant, who played down concerns over the US government debt and attempted to reassure investors the Trump administration is determined to bring down spending and grow the economy.
Early Monday Trading:
Given the extent of the recent upside rally to just short of the physiological 6000 level, perhaps unsurprisingly, early Monday trading possibly suggests traders are reacting with caution to this news, with the US 500 trading down 0.6% at 5888, at time of writing. However, there is a long trading week ahead and it will be important to see how markets respond once US traders are back at their desks.
Technical Update: Looking For Potential Support and Resistance Levels This Week
As seen on the chart below, the move in the US 500 index from the April 7th low at 4799 into last Friday’s latest recovery high at 5958 completed a rally of 24%, as recent concerns over global trade eased.
However, Friday’s downgrade of US debt may prompt some traders to question the sustainability of the current advance, even concluding it is something that could lead to the potential for fresh price weakness.
With that in mind, let’s look at possible technical levels in the US 500 that can be monitored this week to gauge the next potential directional price risks
Potential Support Levels:
The first possible support level to focus on if a more extended phase of price weakness is seen, may be the 38.2% Fibonacci retracement of May price strength which stands at 5813.
While by no means a guarantee of continued declines, if closing breaks of 5813 are seen, a more extended price correction may then be on the cards, which could suggest tests of the 61.8% Fibonacci retracement, which stands at 5722, or even 5575, equal to the May 7th session low, are possible.
Potential Resistance Levels:
Previous price highs can be viewed by traders as possible resistance levels, as having previously marked a point where selling pressure has been found, it may be the case again.
As such, with the latest price strength trading close to 5988/6007, which is an area where sellers were previously found between February 26th 2025 and March 3rd 2025, this may now be a resistance focus for some.
However, closing breaks of this 5988/6007 price range may lead to attempts at further strength, with the next resistance perhaps then marked by 6144, which is the February 19th 2025 all-time high.
The material provided here has not been prepared in accordance with legal requirements designed to promote the independence of investment research and as such is considered to be a marketing communication. Whilst it is not subject to any prohibition on dealing ahead of the dissemination of investment research, we will not seek to take any advantage before providing it to our clients.
Pepperstone doesn’t represent that the material provided here is accurate, current or complete, and therefore shouldn’t be relied upon as such. The information, whether from a third party or not, isn’t to be considered as a recommendation; or an offer to buy or sell; or the solicitation of an offer to buy or sell any security, financial product or instrument; or to participate in any particular trading strategy. It does not take into account readers’ financial situation or investment objectives. We advise any readers of this content to seek their own advice. Without the approval of Pepperstone, reproduction or redistribution of this information isn’t permitted.
SPCUSD trade ideas

S&P 500 Falls Following Downgrade of US Credit RatingS&P 500 Falls Following Downgrade of US Credit Rating
On Friday, 16 May, after markets had closed, Moody’s Ratings announced a downgrade of the long-term sovereign credit rating of the United States from the highest level of Aaa to Aa1. The key reasons cited by Moody’s were the rising national debt and interest payments, as well as expectations of a further increase in the budget deficit. Notably:
→ The downgrade was hardly a surprise. A similar move was made by Standard & Poor’s back in 2011, while Fitch Ratings followed suit in August 2023.
→ The official response may be seen as reassuring for market participants. US Treasury Secretary Scott Bessent played down concerns about the downgrade in an interview with NBC News, calling credit ratings “lagging indicators” and placing the blame on the previous administration.
→ Despite the downgrade, Moody’s acknowledged the US dollar’s role as the world’s reserve currency and stated that the United States “retains exceptional credit strengths, such as the size, resilience, and dynamism of its economy.”
Stock Market Reaction
The announcement triggered a negative market reaction, reflected in falling prices during Monday morning’s opening session. E-mini S&P 500 futures (US SPX 500 mini on FXOpen) retreated, as indicated by the arrow on the chart, pulling back from the highs reached by Friday’s close.
Last week, we pointed out signs of slowing momentum in the S&P 500 rally. Could the decline continue further?
Technical Analysis of the S&P 500 Chart
By drawing lines A, B, and C through the May rally peaks, we can observe a gradual flattening of the slope — suggesting that the bulls are losing momentum and confidence.
The price is currently trading between local lines C and C1, but it is reasonable to assume that the opening of the US session may bring renewed bearish pressure — potentially pushing the price lower, towards the bottom boundary of the broader upward channel (marked in blue).
This article represents the opinion of the Companies operating under the FXOpen brand only. It is not to be construed as an offer, solicitation, or recommendation with respect to products and services provided by the Companies operating under the FXOpen brand, nor is it to be considered financial advice.

SPX500 H4 | Falling toward a pullback supportSPX500 is falling towards a pullback support and could potentially bounce off this level to climb higher.
Buy entry is at 5,789.71 which is a pullback support.
Stop loss is at 5,630.00 which is a level that lies underneath an overlap support and the 23.6% Fibonacci retracement.
Take profit is at 5,994.08 which is a multi-swing-high resistance.
High Risk Investment Warning
Trading Forex/CFDs on margin carries a high level of risk and may not be suitable for all investors. Leverage can work against you.
Stratos Markets Limited (tradu.com/uk):
CFDs are complex instruments and come with a high risk of losing money rapidly due to leverage. 63% of retail investor accounts lose money when trading CFDs with this provider. You should consider whether you understand how CFDs work and whether you can afford to take the high risk of losing your money.
Stratos Europe Ltd (tradu.com/eu):
CFDs are complex instruments and come with a high risk of losing money rapidly due to leverage. 63% of retail investor accounts lose money when trading CFDs with this provider. You should consider whether you understand how CFDs work and whether you can afford to take the high risk of losing your money.
Stratos Global LLC (tradu.com/en):
Losses can exceed deposits.
Please be advised that the information presented on TradingView is provided to Tradu (‘Company’, ‘we’) by a third-party provider (‘TFA Global Pte Ltd’). Please be reminded that you are solely responsible for the trading decisions on your account. There is a very high degree of risk involved in trading. Any information and/or content is intended entirely for research, educational and informational purposes only and does not constitute investment or consultation advice or investment strategy. The information is not tailored to the investment needs of any specific person and therefore does not involve a consideration of any of the investment objectives, financial situation or needs of any viewer that may receive it. Kindly also note that past performance is not a reliable indicator of future results. Actual results may differ materially from those anticipated in forward-looking or past performance statements. We assume no liability as to the accuracy or completeness of any of the information and/or content provided herein and the Company cannot be held responsible for any omission, mistake nor for any loss or damage including without limitation to any loss of profit which may arise from reliance on any information supplied by TFA Global Pte Ltd.
The speaker(s) is neither an employee, agent nor representative of Tradu and is therefore acting independently. The opinions given are their own, constitute general market commentary, and do not constitute the opinion or advice of Tradu or any form of personal or investment advice. Tradu neither endorses nor guarantees offerings of third-party speakers, nor is Tradu responsible for the content, veracity or opinions of third-party speakers, presenters or participants.

Liquidity sweep. I see a nice opportunity for a buy after tapping into a liquidity pool . If SL is hit then I will start looking for sells.

had a dream market went down 80%...an anecdotal visual representation of what that might look like. we may enter another depression, but its weather dependent. entering a 90 year drought cycle aka gleissburg cycle. hopefully i'm wrong.

SPX: in an optimistic moodIt was a good week for the S&P 500, which managed to gain each day during the previous week, surging by around 5% on a weekly basis. Positive market sentiment was supported by easing of trade tariffs tensions between the US and China. It should be also noted that the US Administration signed significant partnerships with countries in the Middle East, mostly in the field of technology and further support to AI development. These agreements will ensure that US companies, mostly in the AI and tech industry, will secure trillions of US Dollars in investments within the next couple of years. In this sense, the US tech companies gained during the week, with Nvidia as a leader in the chip industry, surging around 16% on a weekly basis. META was traded higher by some 8%, Apple surged by 6%, while Microsoft gained modest 3% on a weekly basis.
Analysts are noting that the markets are currently re-thinking the stagflation risks, which was previously priced during the peak of US-China trade tariffs tensions. This was the major catalyst for the positive sentiment during the previous week, and easily might support its continued optimism also in the weeks ahead. Still, it should be considered that the US equity market continues to be vulnerable to fundamentals, especially toward the news related to trade tariffs. Such fundamentals might bring some short term volatility, however, general positive sentiment is currently holding.

SPX Roadmap May 2025Bears got trapped so then the bull scenario is on as long as key support holds into summer

SPX potentials for resistance & lowsI do dowsing & that's where I get my information from. I am expecting a move up tomorrow and then a high Wed./Thurs. with a reversal back down.
I've had levels around the 5450 area even since September, as well as dates suggesting a return to prices even lower from around November/December 2023, which if you recall, was the start of this big run up. I'm only showing the more near term idea, because that's what seems more clear.
The areas at the top are likely resistance in the near term. I'm not sure on timing for lows, but suspect something big in June/July.
I have some potentially important dates including this Thursday, as well as April 18th, 23rd, June 2nd and twice I get July 14th as well.

Has this strategy works for you ?I was quite surprised when one of my followers shared that buying into SPX is boring and has nothing much worthy of bragging rights in social media. Wait, you mean you are buying or selling just because you want to brag? For ego sake ? Value at ??????
Ok, so I am old school and are unlikely to notice stocks like POPMART or Nvidia for that matter. Some of my friends are just busy trading on small time frame of 1-5 mins daily on these stocks, it requires skills, eye power and definitely not for me.
If you had invested in SPX when I mentioned it here , here or here
When you are clear why you are buying and have the conviction that it will continue to pay you handsomely in the long term, then you have lesser headache of searching for quality companies like UNH which plunge so much lately ! Really, you are OK with it after the death of one CEO and then the next is resigning and then getting sued for fraud. Market first react to it be it truth or rumours and then self correct later, that is the brutal and hard to accept for many.
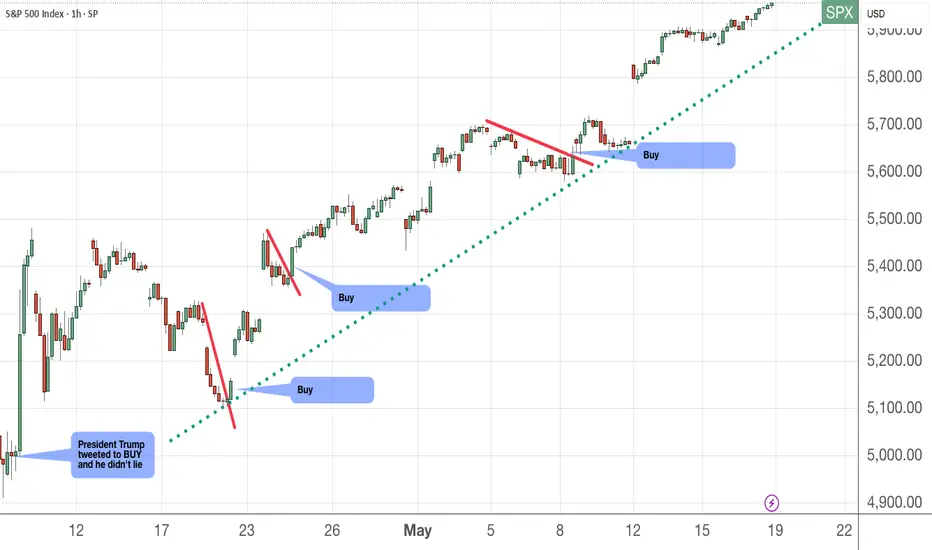
Consider the SPX index like a basket of different fruits that yield you good benefits in the long term. The probability of ALL these stocks or majority falling 10% within a day is RARE except 9th April (thanks to President Trump) but if you ignore that and took that opportunity to DCA, you are well rewarded as data shown.
So now, the market is again haunting you that another selldown is coming - downgrade of US AA1 rating by Moody .
Good, if it comes down another 5-10% , then it is another great opportunity to buy more at cheaper price. The reasons many are afraid to go LONG is because they let the media scared the hell out of them. Bro, that is how media make their money - viewership.
News must be sensational, ya ? The bloodier, creating more fear, uncertainty , the better and the more people hooked on reading, forwarding and commenting on it.
So, perhaps the market will react to this negative news and come down and close the gap around 5666 price level. That would be nice to buy more. Be patient and wait for the green dotted bullish trend line be broken down first.
Of course, maybe the Gen Z finds this strategy too slow, giving peanut returns year on year and prefer to long crypto where overnight millionaires are made and they were sold that dream, fast and furious.
Do what suits you but as always, know what you are doing and protect yourself - NEVER EVER borrow to invest/trade, NEVER EVER go on MARGIN no matter how smart/confident you are on the trade, always use a Stop LOSS.
SPX headed for a correctionMoody's has downgraded US Debt. This news is a catalyst for a overdue correction (Or reversal?)
I published this script some days back. It can predict price inflection points very well
Based on the past behaviour, I can say we are heading for a correction technically and the fill the gap of last week

SPX : Where Where - according to the F
This is a continuation of the previous SELL idea. This time, we go into the details, where we can actually see price action moving in lock-step.
Lets make lots of money. Please keep the SL tight.
Good luck.

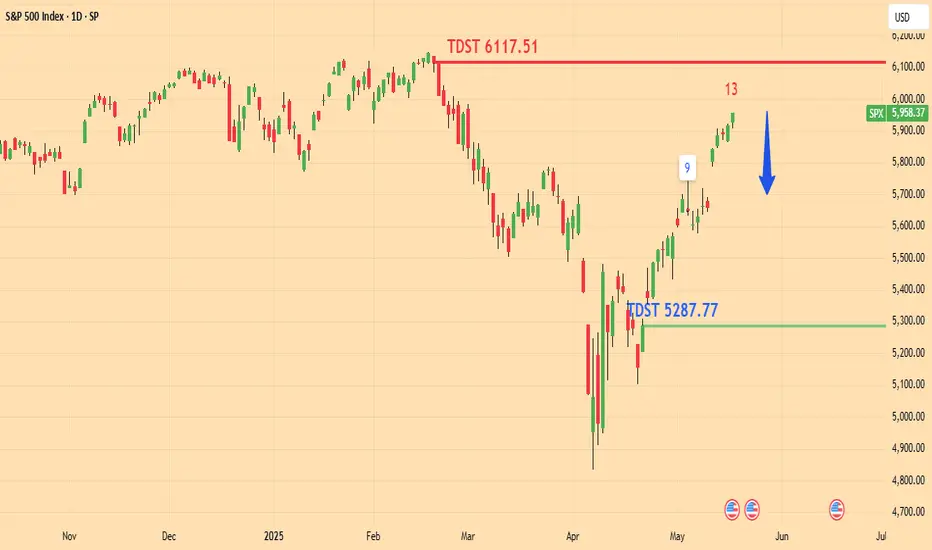
S&P 500 to be in troubleAs seen on the chart, a TD COMBO (TomDeMark) SELL has been completed at the close on Friday 16th May
This means a higher probability of a sell zone above that close.
The support is the TDST line. If broken SPX would plunge further.
Most strategies collapse under pressure Most strategies collapse under pressure — either during wild trends or during boring consolidations.
Not this one.
🔥 Introducing the TCS System (Trend & Consolidation Slapper) by CMA Technologies
Built for crypto traders who demand:
• Structure in the chaos
• Precision during noise
• Profit in all phases
✅ Fully automated algorithm
✅ Works across 200+ crypto pairs
✅ Optimized for 4H timeframes
✅ No indicators – just probabilistic logic
✅ Dynamic pyramiding and exit planning
🔒 Invite-only script. Code is protected.
📈 Real performance. Real trades.
Interested in access?
🌐 www.cmatech.co
📩 info@cmatech.co
#quant #algotrading #crypto #tradingstrategy #breakout #consolidation #inviteonly #cmatechnologies

Moody’s U.S. Downgrade – Why Markets May Stay ResilientMoody’s downgrade of the U.S. credit rating from Aaa to Aa1 is notable but unlikely to trigger a major market sell-off. Here’s why:
Why a Severe Drop Is Unlikely:
Already Priced In: Follows similar actions by S&P (2011) and Fitch (2023); markets may have already adjusted.
Minimal Regulatory Impact: Aa1 is often treated similarly to Aaa in capital and collateral rules.
Stable Outlook: Signals no immediate risk of further downgrades, offering reassurance.
U.S. Strengths Intact: Economic size, resilience, and dollar reserve status continue to underpin investor confidence.
Possible Reactions:
Treasury Yields: May rise slightly on risk re-pricing.
Equities: Modest pullback possible, but no sharp correction expected.
Sentiment: Could revive fiscal debate, but not a game-changer for positioning.
Conclusion: The downgrade highlights longer-term fiscal concerns but is unlikely to cause immediate market turmoil.
#Moody’s #USDebt #CreditDowngrade #MarketOutlook #TreasuryYields #SPX #RiskSentiment

Correction and up for SPX500USDHi traders,
Last week SPX500USD slowly went up some more. The pullbacks are overlapping so it looks like price is forming a leading diagonal (wave 1).
I'm still expecting a downmove because of the price action. Price came into the 4H FVG and is showing a bearish doji. So next week we could see a (corrective) move down.
Let's see what the market does and react.
Trade idea: Wait for price to develop some more before you take any trades.
If you want to learn more about trading FVG's & liquidity sweeps with Wave analysis, then please make sure to follow me.
This shared post is only my point of view on what could be the next move in this pair based on my technical analysis.
Don't be emotional, just trade your plan!
Eduwave

SPX: time to digest the uptrend?The S&P closed the week at 5,958, continuing its climb along a steep uptrend that’s been in place since mid-April. While momentum remains bullish, we’re now entering a zone where digestion or short-term pullbacks would not be surprising. And not because of weakness, but after every run is a period of digestion.
In this video I first go through how I clear out the noise to focus on the outlook for the next few weeks, re-chart my levels and trendlines, and walk through potential scenarios for the coming week.

S&P 500 Daily Chart Analysis For Week of May 16, 2025Technical Analysis and Outlook:
The S&P 500 Index showed a steady upward trend during this week's trading session, successfully reaching a key target at the Outer Index Rally level of 5955. However, it's important to note the significant downward trend due to letter completion, which could lead to a decline toward the Mean Support level of 5828. Additionally, there is a possibility of further drops to the Mean Support level of 5661. On the other hand, the index may continue to rise from its current level, potentially advancing toward the Inner Currency Rally target set at 6073.

S&P 100Trade Plan BUY S&P 100 ENTRY-1
Entry-1 5720
SL 5578
RISK 142
REWARD 1717
Target as per Entry 7437
RR 12.1
Last High 6147
Last Low 4843
Trend: All timeframes are in a clear UP trend, suggesting bullish sentiment across the board.
Demand Strength: As we move from macro to micro, the demand zones are increasing:
Macro demand: 4750 (lower)
Mid-term demand: 5398 (higher)
Micro demand: 5668 (highest)
Implication:
The upward trend across all timeframes and rising average demand zones suggest strong bullish momentum.
If price pulls back, the 4750–4807 zone could act as strong macro support.
For short-term entries or intraday trades, 5668 is the key support level to watch.
🔹 Macro View (Long-Term Demand Zones)
Time Frame Trend Proximal Distal Avg
Yearly UP 4818 4682 4750
Half-Yearly UP 4818 4682 4750
Quarterly UP 4818 4682 4750
Macro Avg UP 4818 4682 4750
🔹 Mid-Term View
Time Frame Trend Proximal Distal Avg
Monthly UP 4931 4682 4807
Weekly UP 5720 5578 5649
Daily UP 5787 5692 5740
Mid-Term Avg UP 5479 5317 5398
🔹 Micro View (Short-Term)
Time Frame Trend Proximal Distal Avg
240 Min UP 5691 5644 5668
180 Min UP 5691 5644 5668
60 Min UP 5691 5644 5668
Micro Avg UP 5691 5644 5668

BUY s&p 500Elliott wave forecast clearly indicates 3 wave ABC is ended.
a new ABC wave emerging to reach the previous highs
Traders can use this bullish recovery for short term oppertunity

MASTER PATTERN TEACHING using TradingView charts. Master pattern - Tonight we are looking at the SPX 500 index directional trade. Using Options.
This is a master pattern technical analysis set up for entry, discipline and execution of a trade.
I will use the 3 time frames to identify
1) Higher time frame ( HTF) Direction trade, trend & liquidity, volume confirmation, and the contraction box
2) Lower time frame ( LTF) Market makers and smart money set up contraction and expansion phases
3) Lower time frame ( LTF) Continuation leg of the trend
Once I have identified and selected my option DTE and spread I will execute when the LTF has reached a new low in the intraday.
Hope you learned something new.
Happy Trading.
Tommaso

Master Pattern SPX 500 We can see the Master pattern from Daily, 4 HR, and 30 Minute. We use the Larger Time Fram to identify the trend. Using the Lower time frame, the 30 minute, to enter the trade in the direction of the trend.

SPX500 Hits Major Supply Zone – Will the Bears Take Over?The S&P 500 (SPX500) just tapped a significant supply zone between 5945–5952, a key level where previous selling pressure led to strong bearish moves. Price is currently showing signs of exhaustion at the top of this zone on the 4H timeframe, and we may be witnessing a potential reversal setup.
Key Levels:
Supply Zone (Resistance): 5945 – 5952
Mid-Support: 5478
Demand Zone (Strong Support): 4916 – 4920
Possible Scenarios:
1. Rejection from the supply zone could trigger a pullback to 5478, and if that breaks, the next bearish target would be the demand zone at 4916.
2. If the bulls break and close above 5952 with strong momentum, we might see new highs, but volume confirmation is needed.
Watch for:
Bearish candlestick patterns in the supply zone
Reversal confirmation with RSI or MACD divergence
Volume drop on the breakout attempt
Red Arrows Mark: High-probability downside targets in case of reversal.
With key economic events marked on the chart (highlighted on May 22), volatility is expected. A fakeout or whipsaw move could be in play—stay cautious!
Are you bullish or bearish on SPX500? Drop your thoughts below and don’t forget to like and follow for more institutional-level analysis!
#SPX500 #S&P500 #LuxAlgo #SupplyDemand #TradingView #Forex #Stocks #PriceAction #SmartMoney #TechnicalAnalysis #SP500Analysis

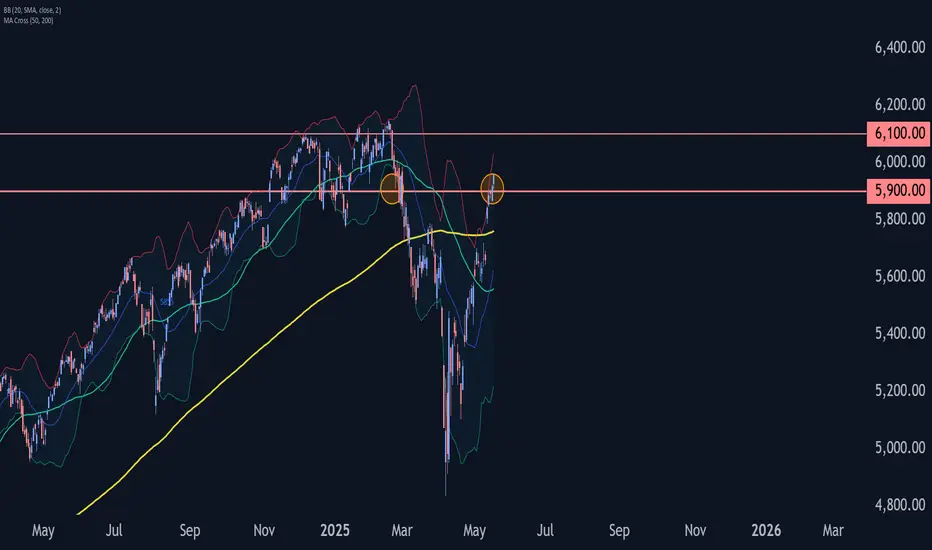
S&P 500 Wave Analysis – 16 May 2025
- S&P 500 broke the resistance level 5900.00
- Likely to rise to resistance level 6100.00
S&P 500 index recently broke the resistance level 5900.00, the former support from January and February.
The breakout of the resistance level 5900.00 should accelerate the active short-term impulse wave 3, which belongs to the intermediate impulse wave (3) from the end of April.
S&P 500 index can be expected to rise to the next resistance level 6100.00, which reversed the price multiple times from December to March, as can be seen below.