Mongoose Capital: Macro Dashboard – US500 Fed & Recession WatchOverview:
The Mongoose Capital Macro Dashboard offers a high-level view of key macroeconomic metrics driving market sentiment. Designed for the US500 (S&P 500 index), this tool tracks the interplay between Federal Reserve policy expectations, recession risk signals, and overall macro conditions in a clean, multi-panel layout.
Key Features:
FFR Cut Probability: Real-time assessment of Federal Reserve rate cut odds.
Macro Conditions Score: Composite indicator showing the alignment of liquidity, inflation, labor market health, credit spreads, yield curve status, and global growth.
Recession Risk Gauge: Aggregated recession probability, with dynamic background shading to reflect rising or falling risk.
Yield Curve & Credit Spreads: Plots to monitor inversion trends and credit market health.
Macro Event Markers: Highlights key events like CPI and FOMC meetings.
How to Use:
Optimized for the US500 on the 1D or 1W timeframe.
Use the Macro Conditions Score and FFR Cut Probability as a context filter for your trade setups.
Watch for Recession Score shifts (3/5 or higher) to flag caution zones.
Best Practice:
This dashboard is built for situational awareness, not as a direct buy/sell signal. Combine with technical analysis for trade execution.
Example Chart Setup:
US500 1D / 1W chart
Apply as an overlay to maintain macro visibility alongside price action.
Built by TheRealMongoose / Mongoose Capital.
SPCUSD trade ideas

Moment of Truth for the S&P and Overall MarketsSeeing quite a significant Head and Shoulders pattern form now.
We've had a strong rally back up after the plunge.
Now we are testing the 50d SMA.
If we can't hold above this, things could get really bad.
If this Head and Shoulders sees follow through to the downside, we could be seeing a very significant bear market over the next year or so.
Critical point here!!!

The Relief Rally is at ResistanceThe SPX touched the main support line, it bounced after the "Buy the Dip" setup until it reached the S/R level at 5,600. This level is at the end of the relief rally, and we can say we're "back to normal".
However, this is a critical point where this support was broken in the past and since support turns into resistance when broken, the most probably price action is a retracement back to the main support line, where depending how the market interprets the Fed Decision it may create a bounce and we can expect it to be consolidating in a trading range.
The main S/R trading range becomes , and if the market gains enough momentum, it could jump to the upper trading range .
It is not likely that the Fed will lower interest rates, since the effects of Tariffs is yet to be known. Inflation has been kept in check since the "soft landing", currently at 2.40%. Lowering interest rates now without knowing the collateral damage of tariffs would be a wild bet.

Market Prep for FOMCA few possibilities discussed. Be aware of the balance range we are in and the channels. Lots of emotional moves happen on FOMC day, so be aware of your emotions and have patience.

7100 pips by September 2025We are going to see a massive rally during Spring and Summer 2025 in Sp500. A magnificient blow off top where people will talk around the world about how good is going to be our economy.
I don´t want to talk about what is coming next.

When the SPX/Silver ratio breaks down, Silver goes on a bull runThis is due to money moving out of the stock market, with investors taking profits and looking towards making money in undervalued assets. Silver is incredibly undervalued when compared to stocks and even gold.

5600: Bullish Border or Bear Trap?Theta’s Working. Setup’s Lurking.
This market’s behaving like it needs a reboot. We’ve got the classic tag‑n‑turn setup doing a dodgy impression of itself-upper band got touched, but instead of a clean pivot, we’ve now got a bearish pulse bar flashing and a near‑miss on the lower Bollinger Band. It’s like waiting for a bus, getting two at once, and realising they’re both headed to “Confusion Junction.”
So here’s the deal: 5600 is now the cliff edge. Stay above, and we’ve got some bullish life. Drop below, and we’re in breakdown city. If you’re testing the waters today, keep it light. FOMC is on deck, and that alone can whiplash any intraday idea straight off your charts.
Meanwhile, theta quietly does its work in the background, even if price action’s stuck in a tight horizontal fog. And for the more cautious of you yes, we’re experimenting with broken wing butterflies as a way to lean into the system without going full throttle. More on that in today’s Fast Forward call.
---
SPX Market View
Let’s break down the weirdness.
We’re in a mechanical tag‑n‑turn, but it’s misbehaving.
Usually, the upper Bollinger Band tap sets off a swift reversal. But this time? We got the tag… and then nothing. Just sideways drift. Until yesterday, that is, when bear pulse bars flickered in, suggesting sellers might finally be stretching their legs.
Now? We’re hovering just shy of a lower Bollinger Band tag, with the bands pinching tighter than a miser’s wallet. This setup is usually the calm before either a surge—or a slip.
Enter the line: 5600.
• Above 5600: bull bias stays alive.
• Below 5600: breakdown setup gets the greenlight.
The GEX crowd seems to be repositioning slightly, but the main range remains intact. Volatility premiums are compressing again, suggesting the real move hasn’t triggered yet.
If you’re risk‑curious but cautious, broken wing butterflys are worth exploring. By placing your risk off-centre, you create room to collect theta while limiting max damage if direction gets wonky. I’ve been testing it in real-time, and I’ll share specifics on today’s mentorship call.
And then, of course, we’ve got the FOMC main session coming up.
If that makes your stomach churn—don’t trade it. Watch it. Tomorrow’s another day. No one gets a prize for being caught on the wrong side of a news candle.
---
Expert Insights:
Assuming a tag means turn – the tag-n-turn isn’t magic. Wait for confirmation.
Forcing trades around news events – FOMC days don’t need your capital.
Underestimating sideways risk – no trend doesn’t mean no danger.
Skipping risk-defined plays – BWB’s give breathing room when setups are unclear.
Failing to adjust bias – bullish and bearish both live here—bias must shift with price.
---
Rumour Has It…
A mysterious algorithm known only as “TurnTagger X” is reportedly running its own contrarian SPX strategy. It waits for tag-n-turn setups-then does the exact opposite, cackling through your stops. One trader claims it’s powered by caffeine, salt, and old Janet Yellen quotes. Could be hedge fund AI… or just your broker’s cat walking on the keyboard.
This is entirely made-up satire. Probably!
Breaking scoops courtesy of the Financial Nuts Newswire-because who needs sanity?
AI-Powered ETFs Go on Strike
A rogue batch of AI ETFs issued a joint statement this morning refusing to rebalance “until humans stop panic-buying tops.” BlackRock is reportedly negotiating with a mediator chatbot named GaryBot-9000.
Retail Traders Launch ‘NapMap’ App
After months of whipsaw hell, Reddit traders launched NapMap – a tool that identifies the safest hours to sleep through “algorithmic tantrums.” It’s already outperforming the S&P.
CBOE Announces ‘Calm VIX’
The Chicago Board of Exchange revealed its newest product: a “Calm VIX” that tracks how unbothered markets pretend to be. Readings are currently at ‘Zen Master’ despite 4 black swans circling the drain.
This is entirely made-up satire. Probably!
Breaking scoops courtesy of the Financial Nuts Newswire-because who needs sanity?
---
Fun Fact
The phrase “broken wing butterfly” comes from aviation-not options. Pilots once used the term to describe asymmetric recovery manoeuvres. Traders later borrowed it to describe strategies with off-centre risk profiles-ideal when you expect range but want room for error.
Bonus trivia: the strategy can be structured for credit or debit, making it one of the few “choose-your-own-adventure” plays in options.
Cartoon metaphor for using broken wing butterflys in volatile markets.

SPX is going to 6000 (If maintains 5565)Spx is going to 6000 level, if it maintains level of 5565.
Note: This is not a buy/sell trade call.

S&P 500 Bearish Reversal Setup: Short Entry Below Key ResistanceEntry Point: Around 5,678.79
Stop Loss: Around 5,833.61 (above recent resistance zone)
Target Point: Around 4,831.37 (indicating a bearish target)
2. Technical Patterns:
The price hit a resistance zone (highlighted in purple) and reversed—this is often a bearish signal.
The trendline break (marked with the orange dot and blue arrow down) suggests a potential trend reversal.
The moving averages (likely 50 EMA and 200 EMA) indicate the price is still above the support zone but weakening.
3. Risk/Reward Ratio:
Risk (Stop Loss – Entry): ~154.82 points
Reward (Entry – Target): ~847.42 points
Risk/Reward Ratio: Approximately 1:5.5, which is favorable for shorting.
4. Trade Sentiment:
Bearish bias based on the breakdown from the resistance zone and confirmation from chart patterns.
If the price fails to hold above 5,682.87, a short trade may be validated with the target at 4,831.37.

SPX at a Tipping Point Rising Wedge Meets 200 EMAThe SPX is currently trading within a rising wedge a bearish pattern that typically signals exhaustion of upward momentum. Price has now stalled right at the 200 EMA, a key dynamic resistance level, and today's close came just beneath it.
If this rising wedge breaks to the downside especially with a confirmed rejection from the 200 EMA we could see accelerated selling. The next key support level to watch is $5,438.43. A breakdown from here would likely test that zone quickly.
This setup follows our earlier call from March 27, where we highlighted the $4,790 area as a bottom nearly nailed to the point. From that low, SPX rallied, but now the structure is showing signs of strain.
We’re at a decision point: hold the 200 EMA and potentially break higher or confirm the wedge breakdown and begin a new leg down.

The channels are everything We are bouncing around inside the channels. Its very possible we break up from this area, in which case the target will be the bollinger band at 5770 area. If we break down overnight for some reason it will be a large move down. It's difficult to say what will happen, but the channels right now are key to the price action.

US500 + Macro Radar Update | Mongoose Capital Macro DeskThe S&P 500 remains in a structurally elevated range around 5,612 following a technical bounce from recent lows. However, the broader macro environment continues to apply pressure beneath the surface.
The Macro Conditions Score prints 5/7 (71.4%), signaling a moderately restrictive backdrop. Meanwhile, the market-implied probability of a Fed Funds Rate cut sits at 52.25%, reflecting policy indecision rather than a definitive pivot.
Recession risk is cooling: the Recession Score has declined from 4/5 to 2/5 over recent months, indicating subsiding risk but not a full reset to expansionary conditions.
Yield curve signals remain inverted, though stabilization is emerging in key spreads (3M10Y, 2s10s). Fed policy sentiment remains neutral-to-hawkish, suggesting no immediate move toward accommodative policy.
📝 Institutional View:
This remains a macro-neutral market, not decisively risk-on. While equities have rebounded, the fundamental backdrop points toward a constrained upside without further improvement in liquidity or policy stance.
The rally is technical and positioning-driven, not yet macro-validated. The reduction in recession odds is positive but still within a tight policy leash.
“The market wants to believe. The data needs to confirm.”
Key Takeaways:
Tactical opportunities remain in place, but strategic positioning should remain selective.
Recession probability is declining but not eliminated.
The macro ceiling remains intact absent further loosening in financial conditions.
Published by Mongoose Capital | Macro Research Desk
(Chart: Mongoose Recession Radar Pro v1.6)

SPX Update: broken out of rising wedge. What Im seeing for now. Looking for a gap fill into tomorrow. My puts though are red, planning to swing my SPX puts. FOMC tomorrow, de-risk SP:SPX

Bullish continuation?S&P500 is falling towards the support level which is an overlap support that line sup with the 61.8% Fibonacci retracement and could bounce from this level to our take profit.
Entry: 6,520.93
Why we like it:
There is an overlap support level that aligns with the 61.8% Fibonacci retracement.
Stop loss: 5,434.59
Why we like it:
There is a pullback support level that is slightly above the 50% Fibonacci retracement.
Take profit: 5,791.21
Why we lik eit:
There is a pullback resistance level that is slightly below the 78.6% Fibonacci projection.
Enjoying your TradingView experience? Review us!
Please be advised that the information presented on TradingView is provided to Vantage (‘Vantage Global Limited’, ‘we’) by a third-party provider (‘Everest Fortune Group’). Please be reminded that you are solely responsible for the trading decisions on your account. There is a very high degree of risk involved in trading. Any information and/or content is intended entirely for research, educational and informational purposes only and does not constitute investment or consultation advice or investment strategy. The information is not tailored to the investment needs of any specific person and therefore does not involve a consideration of any of the investment objectives, financial situation or needs of any viewer that may receive it. Kindly also note that past performance is not a reliable indicator of future results. Actual results may differ materially from those anticipated in forward-looking or past performance statements. We assume no liability as to the accuracy or completeness of any of the information and/or content provided herein and the Company cannot be held responsible for any omission, mistake nor for any loss or damage including without limitation to any loss of profit which may arise from reliance on any information supplied by Everest Fortune Group.

$SPX Rejection at Resistance – Watch 5582 for the Next Major Mov📉 After tagging the 5685–5750 resistance zone, SP:SPX is flashing major downside risk.
🔍 Key Zones:
✅ Resistance tapped: 5705–5838
🟨 FVG (Fair Value Gap): 5642–5582
❗ Daily close below 5582 → Bearish WXY structure confirmed
🟥 Hard invalidation for bulls: 4835.04
💡 I’m open to a retest of the 200DMA (currently 5746), but below 5582 I wouldn’t expect a new high.
This setup offers clear structure, risk-defined short entries, and a measured breakdown scenario if support fails.

Scalping ideasThis layout is specifically optimized for high-precision scalping on the SPX500 index. It features a clean, minimalistic design focused on speed, clarity, and efficiency. Key components include multiple timeframes (1-minute, 5-minute, and 15-minute charts) to monitor short-term price action and trend shifts. High-volume zones, VWAP, and dynamic support/resistance levels are plotted to capture key intraday reactions. Integrated order flow tools and real-time momentum indicators allow for quick decision-making during volatile moves. Perfect for active scalpers looking to catch micro-movements and capitalize on rapid price fluctuations with tight risk control.

Looking for One More High So far, our minor B wave price action has not thrown us any curveballs, which is somewhat unusual considering B waves can become very complex. As I get into the micro price action, this pattern would fit better completed with at least one more high.
Nonetheless, I will offer a warning, we are in the target box...if you are long, please use stops, and make sure your position size is risk managed.
Best to all,
Chris

11am updateWe had a rally from the channel, but right now I believe it's a correction of the first wave down. Above 5660 and it will likely mean we are headed to 5700+
I'm out for the day - good luck!

SPY/QQQ ES/NQ 6 Mayo 2025Overall Market Context:
This image shows a multi-index SpotGamma-style Liquidity Map for:
SPY/SPX (top-left)
QQQ/NQ (top-right)
SPX Futures (bottom-left)
IWM (Russell 2000, bottom-right)
Each panel displays Gamma levels, Call/Put Walls, Zero Gamma zones, and Volatility Triggers to interpret potential support/resistance zones and expected market behavior.
🔹 Top-Left (SPY / SPX500USD Liquidity Map)
Resistance Zone: Around 558–560 (multiple “Target Corto” or Short Targets noted).
Support Zone: 553.58–555.00 (green zone marked as "Possible Buying Zone").
Call Wall at 575, Put Wall at 555 — this tightens the range.
Vol Trigger: 561 — above this could imply strength.
📌 Implication: Strong overhead resistance from 558–560. Breakdown below 555 may open downside targets to 553.58. Support expected around 555. Zone 553.58 is the last strong line of defense.

Algo Macro ResultsNot bad. Shows the amount of accuracy the algo has on picking trend. Pretty accurate imho.

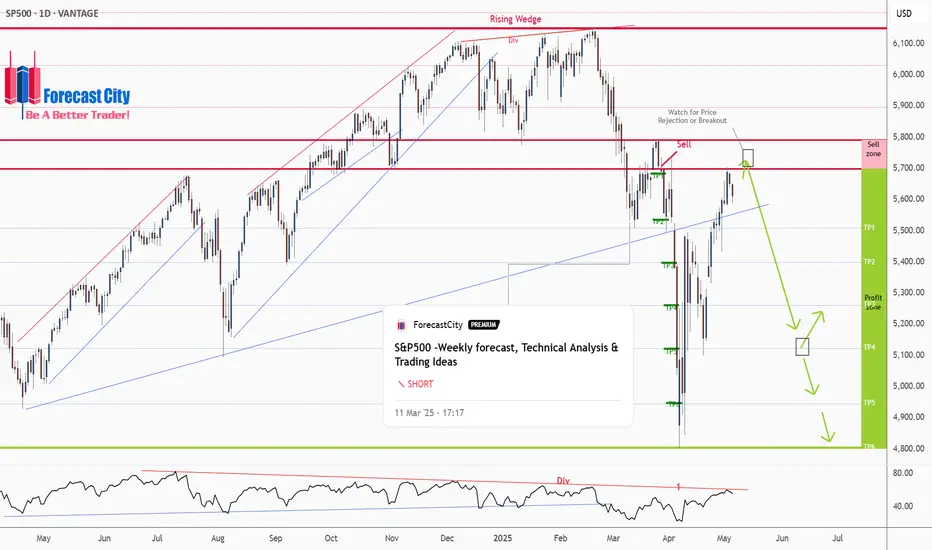
S&P500 -Weekly forecast, Technical Analysis & Trading IdeasPrevious forecast result:
As you can see in the 4CastMachine forecast on 12/03/2025, the price, after rejecting the sell zone, began its sharp decline and touched all TPs.
Midterm forecast:
While the price is below the resistance 6149.57, resumption of downtrend is expected.
We make sure when the support at 4804.01 breaks.
If the resistance at 6149.57 is broken, the short-term forecast -resumption of downtrend- will be invalid. CSEMA:S&P
Technical analysis:
While the RSI downtrend #1 is not broken, bearish wave in price would continue.
A trough is formed in daily chart at 4807.10 on 04/07/2025, so more gains to resistance(s) 5698.65, 5791.00, 5896.50 and maximum to Major Resistance (6149.57) is expected.
Price is above WEMA21, if price drops more, this line can act as dynamic support against more losses.
Relative strength index (RSI) is 55.
Take Profits:
5509.32
5363.90
5261.00
5122.47
4944.41
4804.01
__________________________________________________________________
❤️ If you find this helpful and want more FREE forecasts in TradingView,
. . . . . . . . Hit the 'BOOST' button 👍
. . . . . . . . . . . Drop some feedback in the comments below! (e.g., What did you find most useful? How can we improve?)
🙏 Your support is appreciated!
Now, it's your turn!
Be sure to leave a comment; let us know how you see this opportunity and forecast.
Have a successful week,
ForecastCity Support Team
US500: A correction will give a perfect opportunityHello,
The US500 has rebounded, maintaining its trendline as trade tension concerns subside. A promising trade setup is emerging, pending a minor correction on lower timeframes. The 2-hour and 4-hour charts indicate this correction is underway.
Long term target: $6,953
Consider entering a buy position near the moving averages, aligned with MACD signals.
Disclosure: I am part of Trade Nation's Influencer program and receive a monthly fee for using their TradingView charts in my analysis.

S&P500 buy setup
1>Monthly ERL>IRL (hunted) so now the target is ERL
2>clear MMBM
3>all bullish OBs are being respected
4>DOL seems quite achievable
(i ll be looking for 1h cisd and building positions on each BOS)
Disclaimer:
this is my personal approach to the market not an investment idea/advice, do your own analysis before jumping on the trade.
