Deflation in Our Time? Analyzing the Multifaceted Risk of a Deflationary Bust in the 21st Century United States
Scene setting;
===============================================================================
Shifting Focus from Inflation to a Latent Deflationary Threat
===============================================================================
For decades, the dominant macroeconomic preoccupation in the United States, reflected in policy debates and market anxieties, has centered on managing inflation.
The specter of rising prices eroding purchasing power has been the primary dragon for central bankers and governments to slay. However, lurking beneath these immediate concerns are powerful, long-term structural forces that converge to present a different, arguably more insidious, potential threat: a deflationary bust.
Deflation, a sustained decrease in the general price level, can morph from seemingly benign cheaper goods ("good deflation") into a destructive economic vortex ("bad deflation") characterized by falling demand, contracting output, rising unemployment, crippling debt burdens, and financial instability.
This essay looks into the confluence of factors;
technological disruption
demographic shifts
unprecedented debt levels
– These create a credible vulnerability to such a scenario in the US over the coming decades. It will further explore how policy choices, global trade dynamics, and speculative market behavior could act as amplifiers or triggers, transforming latent risk into acute crisis. While not predicting an inevitable outcome, this analysis aims to provide a comprehensive assessment of the multifaceted nature of this significant long-term economic challenge.
===============================================================================
Technological Double-Edged Sword: AI, Automation, and the Price Level
===============================================================================
Technological advancement, particularly the accelerating capabilities of Artificial Intelligence, robotics, and digitalization, stands as perhaps the most potent and complex force influencing future price levels.
Its impact is fundamentally dual-natured:
-- The Promise of "Good Deflation" : Efficiency and Abundance: Technology inherently drives efficiency. AI can optimize supply chains, automate manufacturing processes, reduce energy consumption, and streamline service delivery, leading to lower production costs. These savings can translate into lower prices for consumers, boosting real incomes and living standards – a beneficial form of deflation. Furthermore, in the digital realm, AI pushes towards zero marginal cost production for information goods. The ability to generate personalized software, entertainment (films, music, games), designs, or sophisticated analysis on demand at negligible incremental cost represents a powerful deflationary force in these sectors, potentially leading to an unprecedented abundance of certain goods and services.
-- The Peril of Disruption and Demand Destruction : The same technologies that promise efficiency also threaten widespread labor displacement. If automation eliminates jobs across various sectors (from manufacturing and logistics to white-collar professions like coding, design, and even legal analysis) faster than the economy can create new roles or adapt wage structures, the result could be significant unemployment or wage stagnation for large segments of the population. This directly undermines aggregate demand. Even if goods become cheaper, falling or insecure incomes prevent consumers from purchasing them, nullifying the benefits of lower prices. This risk is amplified by the "productivity paradox" – if AI adoption leads to job losses without simultaneously generating the massive, broad-based productivity gains needed to boost overall wealth and create new demand, the net effect could be strongly deflationary. The destruction of incomes in industries disrupted by zero-marginal-cost AI could further exacerbate this, crippling the vital income-spending-income cycle necessary for economic vitality. Uncertainty about future employment prospects can also trigger increased precautionary savings (hoarding), slowing the velocity of money and adding further deflationary pressure.
===============================================================================
The Demographic Drag: An Aging Population and Shifting Consumption
===============================================================================
Compounding the technological shifts are profound demographic changes underway in the United States. While not as advanced as in Japan or parts of Europe, the US population structure is undergoing significant transformation:
The Aging Baby Boomer Cohort : The retirement of this large generation is leading to slower labor force growth and a higher dependency ratio (more retirees relative to workers).
Shifting Consumption Patterns : Older populations typically exhibit different consumption behaviors. They tend to save a higher proportion of their income and spend less, particularly on durable goods, vehicles, and housing expansion, compared to younger, family-forming households. Their spending priorities often shift towards healthcare and services.
Impact on Aggregate Demand : This demographic evolution acts as a persistent, gradual drag on overall consumer demand, which has historically been the primary engine of US economic growth. Reduced demand for goods and services exerts a gentle but constant downward pressure on prices and growth potential. While immigration can partially offset these trends, the underlying shift towards an older population profile contributes to a macroeconomic environment more susceptible to deflationary forces. It represents a structural headwind that makes the economy less resilient to negative shocks.
========================================================================
The Mountain of Debt: Vulnerability and the Debt-Deflation Spiral
========================================================================
Perhaps the most acute vulnerability amplifying the risk of a deflationary bust is the staggering level of debt accumulated across the US economy – encompassing government, corporate, and household sectors. Decades of low interest rates, financial innovation, and fiscal deficits have resulted in debt-to-GDP ratios hovering near historic highs.
Scale and Scope : From towering federal deficits to increased corporate borrowing (often used for share buybacks rather than productive investment) and significant household mortgage and consumer debt, the US economy operates with substantial leverage.
The Debt-Deflation Mechanism : As articulated by Irving Fisher, debt becomes exceptionally dangerous during deflation. When the general price level falls, the real burden of existing, nominally fixed debt increases. A dollar owed becomes harder to earn back when wages and prices are declining. This forces debtors (households, corporations, potentially even governments) into distress:
-- Forced Deleveraging : Debtors must cut spending drastically to service or pay down debt. Businesses slash investment and payrolls; households cut consumption.
-- Asset Fire Sales : To raise cash, debtors may be forced to sell assets (homes, stocks), further depressing asset prices and exacerbating the downturn.
-- Demand Collapse : The combined effect of spending cuts and asset deflation crushes aggregate demand.
-- Feedback Loop : Falling demand leads to further price declines, which further increases the real debt burden, triggering more defaults and spending cuts – a vicious downward spiral.
Heightened Fragility : The sheer scale of existing debt means the US economy is acutely sensitive to this dynamic. Even a mild deflationary impulse could potentially trigger significant financial distress and initiate this destructive feedback loop, turning a manageable slowdown into a severe bust.
===============================================================================
Amplifiers and Triggers: Igniting the Latent Risk
===============================================================================
While the underlying forces create vulnerability, specific events or policy choices often act as catalysts, turning potential risk into reality. Several potential amplifiers and triggers exist in the current context:
-- Policy Missteps : Abrupt or misjudged policy actions could destabilize the system.
-- Monetary Policy Shock : An overly aggressive tightening cycle by the Federal Reserve, perhaps reacting belatedly to persistent inflation, could dramatically raise borrowing costs, crush asset values held by indebted entities, and freeze credit markets, potentially triggering a deflationary collapse despite the initial inflationary trigger.
-- Sudden Fiscal Austerity : A sharp, unexpected shift to fiscal consolidation (deep spending cuts, large tax hikes), potentially driven by political gridlock or a sudden panic over debt levels, could withdraw critical demand from the economy, tipping it into deflation.
-- Disruptive Regulation : Hasty or poorly designed regulations targeting key sectors (e.g., finance, technology) could inadvertently curtail credit, destroy perceived wealth, or halt investment.
-- Loss of Credibility : A rapid erosion of market confidence in US fiscal sustainability or the Federal Reserve's competence could lead to soaring interest rates (market-driven), capital flight, and financial chaos, potentially triggering a bust.
Trade Wars and Deglobalization: Beyond specific tariffs (which can be inflationary for targeted goods), the broader trend of escalating trade friction and deglobalization acts primarily as a deflationary force on the overall economy. It reduces global efficiency, disrupts supply chains, dampens business investment due to uncertainty, and slows global growth, thereby weakening the capacity of economies worldwide to service debt and maintain demand.
Speculative Unwinding and Retail Exposure: The significant increase in retail investor participation, often concentrated in highly speculative assets like meme stocks and cryptocurrencies, creates a specific vulnerability. A sharp, correlated downturn in these markets would trigger:
-- Negative Wealth Effect : Millions feeling suddenly poorer would drastically cut discretionary spending.
-- Confidence Collapse : Shattered confidence would lead to increased hoarding (precautionary savings) and delayed purchases.
-- Direct Liquidity Shock : Forced selling and realized losses would directly reduce spending power. This mechanism provides a direct channel from financial market volatility to a sharp contraction in real economic activity, amplifying deflationary pressures.
========================================================================
Interactive Effects and the Downward Spiral
========================================================================
Crucially, these factors do not operate in isolation; their danger lies in their potential interaction and ability to create self-reinforcing negative feedback loops.
Synergistic Weakness: Imagine technology displacing workers (reducing income) while an aging population inherently dampens demand, all within an economy saturated with debt. This combination is exceptionally fragile.
Cascading Failures: A shock in one area (e.g., a tech stock collapse) can trigger deleveraging that worsens the debt problem, which then further reduces demand, validating initial pessimism and potentially leading to further price drops and layoffs.
The Power of Expectations: Once businesses and consumers expect prices to fall, deflation can become entrenched. Businesses delay investment, and consumers postpone purchases, waiting for lower prices, thereby validating the expectation and deepening the slump. Breaking these expectations becomes incredibly difficult for policymakers.
===============================================================================
Countervailing Forces
===============================================================================
Despite these significant risks, a deflationary bust is not preordained. Several factors could counteract these trends or mitigate their impact:
US Economic Dynamism: The US economy possesses inherent strengths, including a culture of innovation, relatively flexible labor markets (compared to some peers), and a deep pool of capital.
Inflationary Pressures: Persistent inflationary forces may counteract deflationary drivers. These include the costs associated with reshoring supply chains (deglobalization), massive investments required for the green energy transition, geopolitical instability impacting commodity prices, and potentially persistent labor bargaining power in certain sectors.
Policy Responses: Governments and central banks are aware of deflation risks (particularly informed by Japan's experience). They possess tools like quantitative easing, negative interest rates (though controversial), forward guidance, and substantial fiscal stimulus (like direct payments or infrastructure spending) to combat deflationary pressures. Novel policies like Universal Basic Income (UBI) might even be considered in a future of AI-driven job displacement. The effectiveness and potential unintended consequences (e.g., fueling asset bubbles, future inflation risk) of these tools, especially near the zero lower bound, remain subjects of debate.
===============================================================================
Vigilance in the Face of Structural Change
===============================================================================
The risk of a deflationary bust in the United States over the coming decades is a credible, complex threat arising from the confluence of powerful structural forces. Transformative technology offers efficiency but risks income destruction; demographic shifts promise longer lives but dampen demand; accumulated debt fuels growth in the short term but creates profound fragility in the face of falling prices. These underlying vulnerabilities can be ignited by policy errors, geopolitical turmoil, or the unwinding of speculative excesses in financial markets, potentially trapping the economy in a debilitating downward spiral. While countervailing forces exist and policy tools are available, their efficacy in navigating such an unprecedented confluence of challenges remains uncertain. Addressing this latent risk requires more than traditional macroeconomic management. It demands forward-looking policies that foster inclusive growth, manage the societal transitions accompanying technological change, ensure long-term fiscal sustainability without triggering austerity shocks, promote financial stability that accounts for new forms of speculation, and maintain adaptability in the face of profound global shifts. Recognizing and proactively addressing the gathering chill of potential deflation is essential for securing long-term economic prosperity and stability in the 21st century.
SPCUSD trade ideas

SPXGiven the escalating tariff pressures, it's clear that this scenario is unsustainable for any economy in the long term. I anticipate a resolution to the US-China trade issue within the next few weeks to months.
The current market correction is likely a reflection of the accumulated negative impacts from Trump's second term, and from a technical analysis perspective, further downside levels are indicated on the charts.
However, looking at the broader, four-year horizon of Trump's presidency, there are several potentially bullish factors, including tax cuts, financial deregulation, continued Fed dovishness, and the possibility of renewed quantitative easing.

Surfs up for riskMany analyst's have been calling for this. Record money printing since 2010. what is the flight to safety in the midst of this absurd paper growth? bitcoin? Gold? wristwatches? Get ready to test 2020 levels for the cleanse of middle class hopefuls. Gotta make way for the next generation of dip buyers!

stuck between 2 trend lines!Boost and follow for more 🔥SPX is holding trend support, resistance = support is also showing up. push higher into trend resistance can happen from here.
maybe we get a break of the trend resistance sometimes in the next few weeks.. this seems like a choppy week with no crazy moves
chart request from @sweatytrigger

Detailed Technical Analysis of the S&P 500 Index – 4-Hour TimefrWhat triggered the recent movements?
As per analyst analysis, since February 20, 2025, the S&P 500 Index began a gradual decline, forming a clear downtrend that resulted in a total drop of approximately 21.14%. This sharp retreat was primarily driven by mounting investor concerns over President Donald Trump's foreign trade policies, particularly the increased tariffs on several countries, which led to widespread fear and uncertainty in financial markets, concerns about a potential global recession, slowing international trade, weakened economic growth and resurgence of inflationary pressure.
After reaching the key support level at 4798.58, its lowest point since January 2024, the index saw a brief consolidation phase, before a major market-moving development occurred: the announcement of a 90-day suspension of tariffs on selected countries by the U.S. President.
As per analyst interpretation, this event acted as a turning point, triggering a sharp rally of nearly 10% in a single session, which effectively broke the downtrend on the 4-hour timeframe and led to the formation of a new high (2), surpassing the last corrective peak (1). This confirmed a bullish reversal on the 4-hour chart.
What’s next on the 4-hour chart?
Although the index has shifted into an upward trajectory, a short-term pullback appears more likely at this stage, especially following the failure of trough (3) to break above the previous peak (2) at 5487 – a sign of weak bullish momentum.
If the price breaks below the 5107.40 level, a further decline toward the 4948.10 support level is expected. This level could serve as a potential rebound zone, where bullish traders might regain control and resume the uptrend, possibly retargeting the 5487 peak.
When is the bullish scenario invalidated?
According to analysts, the current bullish outlook would be invalidated if the price breaks below 4798.58 and confirms a 4-hour candle close beneath it. This would strongly indicate a shift in market structure from bullish to bearish, prompting a reassessment of the medium-term trend.
Important Note:
This analysis strictly reflects price action and technical patterns on the 4-hour timeframe only.

S&P INTRADAY key resistance at 5509
Donald Trump said there was “big progress” in trade talks with Japan, easing fears of higher tariffs. This boosted the Nikkei 225, as traders grew less concerned about U.S. pressure for a stronger yen.
Meanwhile, U.S. stock futures pointed to a rebound after Wednesday’s selloff. The drop was sparked by Fed Chair Jerome Powell, who struck a cautious tone on tariffs and signaled no rush to cut rates, disappointing markets looking for quicker support.
Key Support and Resistance Levels
Resistance Level 1: 5509
Resistance Level 2: 5660
Resistance Level 3: 5787
Support Level 1: 5110
Support Level 2: 4947
Support Level 3: 4816
This communication is for informational purposes only and should not be viewed as any form of recommendation as to a particular course of action or as investment advice. It is not intended as an offer or solicitation for the purchase or sale of any financial instrument or as an official confirmation of any transaction. Opinions, estimates and assumptions expressed herein are made as of the date of this communication and are subject to change without notice. This communication has been prepared based upon information, including market prices, data and other information, believed to be reliable; however, Trade Nation does not warrant its completeness or accuracy. All market prices and market data contained in or attached to this communication are indicative and subject to change without notice.


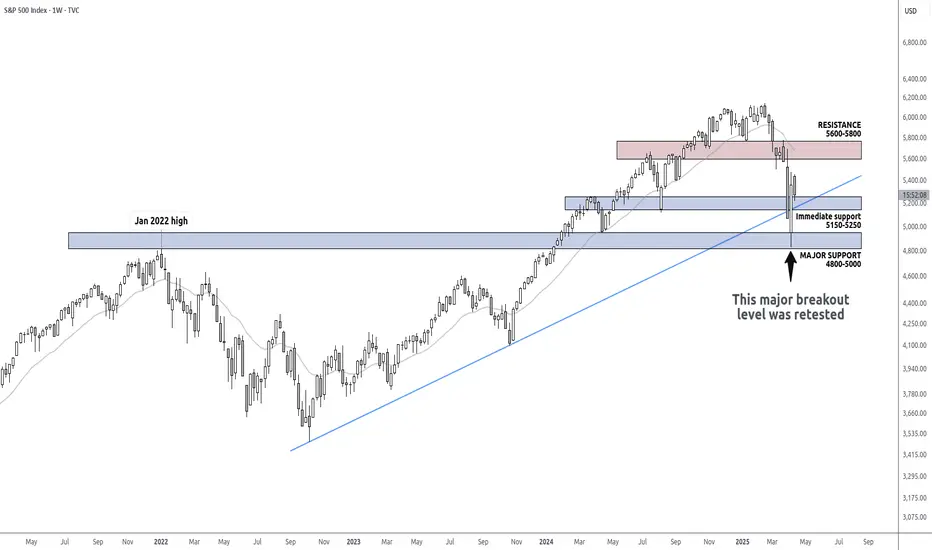
Could be a good time to build a longer term SPX long Potentially good reward:risk here for investors / longer timeframe swing traders or position traders
Last week was a big test for the SPX index - it tested two crucial supports
1) Retest of the 2022 highs
2) Retest of the major trendline which has held the trend for around 2.5 years now
It looks like buyers came in strong at support giving us a big bullish candle - likely forming a capitulation low.
Major pullbacks like these come only a few times a year - and if managed well can be good R:R trades.
For investors/position traders:
If the low from last week holds, any pullbacks into 5250 or lower seem like a good time to add - for a longer term hold for a few months or even a few quarters.
For traders wanting to see some clear momentum first:
The most important resistance up above is the 5600-5800 area & the 20w ema (which aligns with it currently). You might want wait for a clean reclaim of this resistance first. For investors, you could think of adding to your buys once this resistance is reclaimed strongly.
TLDR;
SPX might have capitulated
This is a decent area to start buying for a longer term hold - targeting the prior highs first and holding some into price discovery
Invalidation: if a weekly candle closes below the recent low
When to observe PA closely: test of the 5600-5800 resistance / 20w ema
SP500 Buy/Sell/Hold zones for next couple of days
Buy/Sell/Hold zones marked in grn/red/ylw drawn-in lines. Tomorrow if it gets below ~5,200 I'm shorting or above ~5,350 I'm buying back in, look for a big reaction outside of these levels.

We Now Have Conditions for Limit Down Days in SPXMassive intraday pop today but it did not manage to advance much past the last high.
The size of the move today means if we had a big one day rejection of it that would now be a limit down day.
Which this specific thing does not have to happen (could down trend over a few days) break the low in this setp would give a strong case for limit down days to come.
It's not a term I use loosely.
In an optimistic outlook today we have a bullish wave 3 and the foothills of a new uptrend (or at least bull trap).
But if today rejects and turns out was a big bull trap - then we'd be about to head into the crash section of the move.
If you think it's been crashy so far - know that the second half is not slower than the first.

S&P 500 - Key Levels and April 7-11 Weekly Candle StructureApril 7-11 will easily be remembered in 2025 as one of the craziest weeks in modern history.
Intraday swings were face ripping all from a Monday "fake news" becoming Wednesday "real news" with the US pausing tariffs for 90 days
5500 major resistance on S&P
4800 major support on S&P
I believe the market will struggle to provide any clear direction in the coming weeks without some shift in narrative (for better or worse). I'm sure most traders are hoping for an optimistic tone but be prepared to be disappointed as the world's alliances and economies are being strained with massive uncertainty and angst.
There are trading opportunities in the short-term, but I'm not taking any major risks. If I can survive, the upside will be easier and a pleasant surprise.
I expect the weekly candles to dance inside the April 7-11 low and high levels and hopefully it provides some ventilation to a VIX > 30

It That was Just Wave C - Big Puke ComingI had a fair crack at being bullish and it was profitable for a while but last attempt ran my entry levels. We're back to retesting them now but I've ditched all my longs other than super lotto calls.
If might turn out that big W move was just an ABC. That 6% down day was wave 1. The failed new high was wave 2.
If those things are true, I think you're going to see limit down days.
I don't throw that term about loosely. If we're heading into wave 3, at some point limit down days are likely.

Into the closeJust some thoughts about what's next. I strongly feel that a B wave bounce may be next to test the recent highs (again) and then failure for C down.

Expecting a buy positionWe anticipate that after the formation of point 3, the chart will rise to the level indicated (👇). We expect to enter a buy trade at the ND point.
If you need further clarification or assistance with chart analysis, feel free to ask!
VANTAGE:SP500 BLACKBULL:US30

S&P 500 Outlook Post-PowellBelow is a focused prediction for the S&P 500’s direction in both the short term (next few days to 1–2 weeks) and long term (next 3–12 months) following Federal Reserve Chairman Jerome Powell’s speech on April 16, 2025. The analysis is based on Powell’s remarks, market reactions, and economic context, avoiding speculative overreach and grounding predictions in available data.
Short-Term Prediction (Next Few Days to 1–2 Weeks)
Outlook: Downward Bias (60%–70% Probability of Decline)
Prediction: The S&P 500 is likely to face further declines, potentially dropping toward 4,800–4,900 or Morgan Stanley’s projected 4,700 level (a 7%–8% decline from the April 8, 2025, close of 5,074.08, likely lower post-speech). A temporary bounce is possible but expected to be limited.
Key Drivers:
Hawkish Fed Stance: Powell’s cautious tone, emphasizing persistent inflation (PCE at 2.3% headline, 2.6% core) and no urgency for rate cuts (rates steady at 4.25%–4.5%), has dampened hopes for monetary easing. His view that Trump’s tariffs could drive sustained inflation increases the risk of prolonged high rates, pressuring equities.
Tariff Uncertainty: Powell’s remarks on “larger-than-expected” tariffs, alongside U.S.-China trade tensions and the World Trade Organization’s slashed 2025 trade forecast, fuel fears of a trade war, higher costs, and slower growth.
Weak Sentiment: Declining household (March 2025 confidence at its lowest since January 2021) and business sentiment, as noted by Powell, could curb spending and investment, weighing on stocks.
Market Momentum: The S&P 500’s 9% drop in the week ending April 8 and its decline during Powell’s speech signal bearish momentum. Technical weakness, with many stocks below their 200-day moving averages, suggests vulnerability.
Potential for a Bounce (30%–40% Probability): Oversold conditions could trigger a technical rally toward 5,200–5,300, especially if trade policy fears ease (e.g., signals of negotiation) or softer economic data renews rate-cut hopes. However, Powell’s inflation focus limits upside, making a sustained rally unlikely.
Key Levels:
Support: 5,000 (psychological), 4,800–4,900, or 4,700 (Morgan Stanley’s target).
Resistance: 5,200–5,300 (recent pre-sell-off levels).
Catalysts to Watch:
Q1 2025 GDP (due in ~2 weeks): Weak growth could deepen fears, while strong data might reinforce inflation concerns.
Trade policy: Escalation (e.g., new tariffs) could drive further declines; de-escalation could spark a bounce.
Inflation data (CPI, PCE) and consumer sentiment reports.
Short-Term Verdict: Expect downward pressure toward 4,800–4,700, with a possible short-lived bounce to 5,200–5,300 if positive catalysts emerge. Monitor GDP, trade developments, and Fed commentary.
Long-Term Prediction (Next 3–12 Months)
Outlook: Cautiously Optimistic with Volatility (55%–60% Probability of Modest Gains)
Prediction: Over the next 3–12 months, the S&P 500 is likely to experience volatility but could see modest gains, potentially reaching 5,500–5,800 (8%–14% above April 8’s 5,074.08 close) by mid-2026, assuming no severe economic downturn or trade war escalation. However, significant risks could cap gains or lead to stagnation/declines.
Key Drivers Supporting Gains:
Economic Resilience: Powell noted the U.S. economy remains “in a solid position,” with a balanced labor market (4.1% unemployment, 150,000 jobs added monthly) and positive consumer spending. If growth stabilizes (e.g., Q1 2025 slowdown proves temporary), corporate earnings could support higher valuations.
Historical Trends: The S&P 500 often performs well in the second half of election years under a first-term president, with gains potentially extending into the following year. Seasonal strength could bolster markets if trade and inflation fears subside.
Potential Fed Pivot: If inflation moderates toward 2% (e.g., due to weaker demand or resolved supply chain issues), the Fed could signal rate cuts by mid-2025, boosting equities. Markets historically rally when monetary policy eases.
Corporate Adaptability: Companies may adjust to tariffs by diversifying supply chains or passing costs to consumers, mitigating earnings damage over time.
Key Risks Capping or Reversing Gains:
Persistent Inflation: If tariffs drive sustained inflation (Powell’s concern), the Fed may maintain or raise rates, squeezing valuations. Core PCE above 2.6% or rising CPI could trigger tighter policy.
Trade War Escalation: A full-blown U.S.-China trade war or broader global trade disruptions could slow growth, hurt earnings, and push the S&P 500 toward bear market territory (e.g., 4,500 or lower).
Economic Slowdown: If Q1 2025’s slowdown (weak GDP, souring sentiment) persists, consumer spending and corporate investment could falter, risking a recession. Morgan Stanley’s bearish scenario (4,700) could extend if growth weakens further.
Geopolitical and Policy Uncertainty: Trump’s trade policies, combined with global risks (e.g., China’s response to chip restrictions), could keep volatility high, deterring investment.
Key Scenarios:
Bull Case (20%–25% Probability): Inflation moderates, trade tensions ease, and the Fed cuts rates by Q3 2025. The S&P 500 could rally to 5,800–6,000, driven by strong earnings and renewed optimism.
Base Case (55%–60% Probability): Volatility persists, but growth stabilizes, and tariffs are partially mitigated. The S&P 500 grinds higher to 5,500–5,800, with periods of pullbacks.
Bear Case (20%–25% Probability): Inflation spikes, trade wars escalate, or growth slows sharply, prompting tighter Fed policy or recession fears. The S&P 500 could fall to 4,500–4,700 or lower.
Key Levels:
Upside Targets: 5,500 (near recent highs), 5,800 (moderate growth scenario).
Downside Risks: 4,700 (Morgan Stanley’s target), 4,500 (bear market threshold).
Catalysts to Watch:
Fed policy: FOMC meetings (e.g., May 6–7, 2025) and Powell’s comments on inflation vs. growth.
Economic data: GDP, inflation (PCE, CPI), unemployment, and consumer confidence over Q2–Q3 2025.
Trade policy: Resolution or escalation of U.S.-China tariffs and global trade dynamics.
Earnings: Q1–Q2 2025 corporate earnings for signs of tariff impact or resilience.
Long-Term Verdict: The S&P 500 is likely to see modest gains to 5,500–5,800 by mid-2026, driven by economic resilience and potential Fed easing, but volatility will persist due to tariff and inflation risks. A bearish outcome (4,500–4,700) is possible if trade wars or inflation worsen. Stay vigilant on Fed signals, trade policy, and economic indicators.

"Let that Sink In" Short Sellers Tarrif started this harmonic trend last week and here it is back again
Same reason - Same Structure - Same result..
Make your fortunes a little bit diffrent this time..Join the sellers

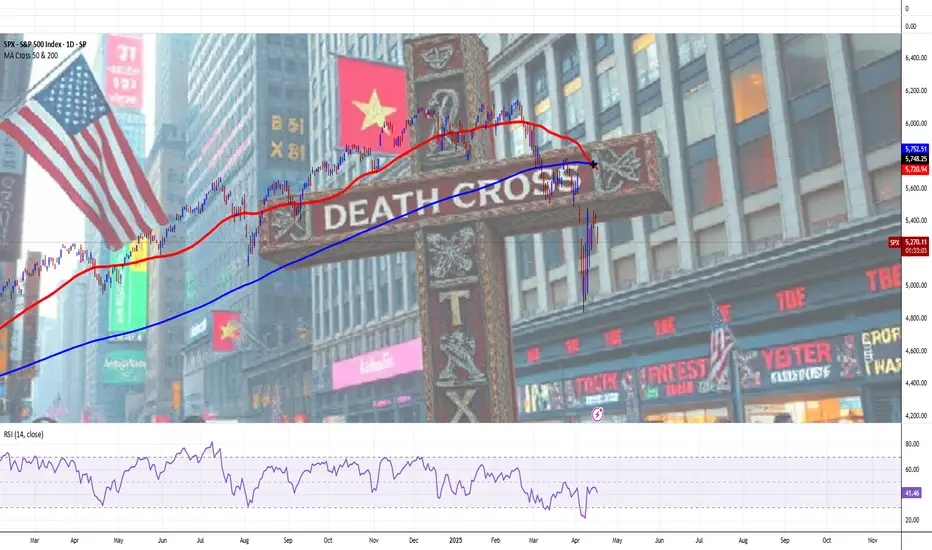
S&P 500 Index Goes 'Death Crossed' Again, Due To Unruly EconomyThe "Death Cross" is a technical chart pattern signaling potential bearish momentum in the US stock market, occurring when a short-term moving average (typically the 50-day) crosses below a long-term moving average (usually the 200-day).
Despite its foreboding name, historical data shows its implications are often less dire than perceived, serving as a coincident indicator of market weakness rather than a definitive predictor of collapse.
Historical Examples and Market Impact
The death cross gained notoriety for preceding major market downturns:
2000 Dot-Com Bubble: The Nasdaq Composite’s death cross in June 2000 coincided with the burst of the tech bubble, leading to a prolonged bear market.
2008 Financial Crisis: The S&P 500’s death cross in December 2007 foreshadowed the 2008 crash, with the index losing over 50% of its value by early 2009.
2020 COVID-19 Crash: The S&P 500, Dow Jones, and Nasdaq 100 all formed death crosses in March 2020 amid pandemic-driven panic, though markets rebounded sharply within months.
2022 Ukraine's War Crisis: The S&P 500, Dow Jones, and Nasdaq 100 all formed death crosses in March 2022 due to proinflationary surge on Ukraine's war and Arab-Israel conflict, leading to a prolonged bear market within next twelve months, up to March quarter in the year 2023.
These examples highlight the pattern’s association with extreme volatility, but its predictive power is inconsistent. For instance, the 2022 death cross in the S&P 500—its first in two years—occurred amid Fed rate hikes and geopolitical tensions, yet the market stabilized within weeks rather than entering a prolonged downturn.
Perspectives on Reliability and Use Cases
While the death cross reflects deteriorating short-term momentum, its utility depends on context:
Lagging Nature: As a lagging indicator, it confirms existing trends rather than forecasting new ones. The 50-day average crossing below the 200-day often occurs after prices have already declined.
False Signals: Post-2020 data shows the S&P 500 gained an average of 6.3% one year after a death cross, with Nasdaq Composite returns doubling typical averages six months post-cross.
Combined Analysis: Traders pair it with metrics like trading volume or MACD (Moving Average Convergence Divergence) to validate signals. Higher selling volume during a death cross strengthens its bearish case.
Strategic Implications for Investors
For market participants, the death cross serves as a cautionary tool rather than a standalone sell signal:
Short-Term Traders: May use it to hedge long positions or initiate short bets, particularly if corroborated by weakening fundamentals.
Long-Term Investors: Often treat it as a reminder to reassess portfolio diversification, especially during elevated valuations or macroeconomic uncertainty.
Contrarian Opportunities: Historical rebounds post-death cross—such as the 7.2% Nasdaq gain three months after the signal—suggest potential buying opportunities for risk-tolerant investors.
Fundamental Challenge
Stocks Extend Drop as Powell Sees Economy ‘Moving Away’ From Fed Goals
Powell sees economy ‘moving away’ from job, price goals due to Trump's tariff chainsaw.
Fed well positioned to wait for policy clarity. Strong jobs market depends on price stability, he adds.
Stocks extend declines, bonds rally as Fed chair speaks.
Conclusion
The "Death Cross" remains a contentious yet widely monitored pattern. Its dramatic name and association with past crises amplify its psychological impact, but empirical evidence underscores its role as one of many tools in technical analysis. Investors who contextualize it with broader market data—such as earnings trends, interest rates, and macroeconomic indicators—are better positioned to navigate its signals.
While it may foreshadow turbulence, its historical track record emphasizes resilience, with markets often recovering losses within months of the pattern’s appearance.
--
Best wishes,
Your Beloved @PandorraResearch Team 😎
// Think Big. Risk Less
spx/ETH ShortLong ETH is the new buzz word in wall street right now, SEC is pro crypto now, there is no reason why ETH will not have those applications denied.


S&P500 - Temporary snap back rally to kill some bears ?Markets are in correction mode as everyone has (hopefully) noticed by now, with the NASDAQ and S&P500 breaching key lows.
Forced selling like we saw on Friday usually gives us a reaction rally that can last a few days.
Prices have already dropped too much already so don't try an be bold now with any agressive shorting, especially if you plan to keep positions overnight!
You have to stay alert and react quickly to be able to profit on short-term setups within this bear market.
Be disciplined, protect your capital, stay active—this is not an investor's market !!!

The short and long termI explain what I think will happen in the next two days before we close the week, but I also wanted to take time to look at the weekly charts and RSI. I believe we're in a bottoming process.

Bulls and Bears zone for 04-16-2025Earlier this week S&P 500 has formed a Death Cross which could be significant or not only time will tell.
Any test of yesterday's Close could provide direction for the day.
Level to watch: 5354 --- 5356
Reports to watch:
U.S. Housing Market Index at 10:00AM EST
U.S. Jerome Powell Speaks at 1:30PM EST

$SPX - APRIL 16 2025 contract
Today’s Trading Range has Downward pressure from the top - you can see it in the way the moving averages come down and their angle.
The implied move is 5320-5475 today (1.35%)
5295-5500 tomorrow (1.88%)
And 30 day average volatility 5205-5590. (3.53%)
That spreads am I looking to today? 5320/5296 Bull put spreads feel too close for me… But I’m still keeping them on my radar. That is 25 dollars wide.
If we Trade up 5475/5500 That’s a real possibility because of the 1hr 200MA coming down like that. (That is also a 25$ wide spread today.)
But more likely - and especially because we have Jerome powell today at 1:30 ET, I will be looking 5230/5205 bull put spreads & 5565/5590 above.
Big Bear gap at the top as well.
Let’s see how it goes today.
