shot down in flamesone more wave down is likely to 4600 area. SPX should not get back to 5200 if this is correct.
SPCUSD trade ideas

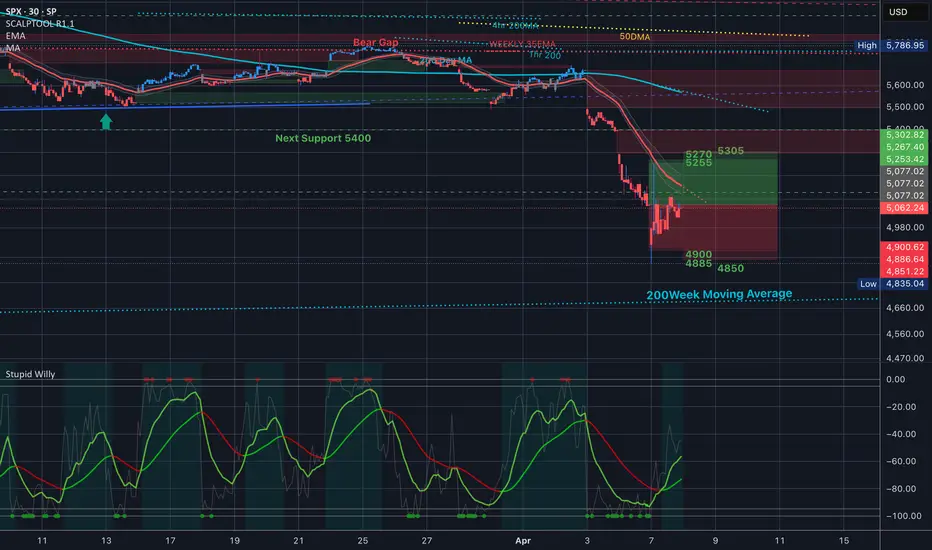
SPX500 Short at M5 supply zone due to tariffs uncertainty
Market overview and macro outlook
Rise in the equities market mainly due to the possibility of a 90 days postponement of the tariffs
1. What can kill this optimism: A single Trump administration comment otherwise.
2. We've risen by close to 8% from the lows.
3. Until the postponement is confirmed, i don't think there's much upside, thus, the risk is to the upside, and we should be looking for downside trades now
Upcoming news
1. FOMC meeting on Wed - probably to the downside as it should be comments on keeping rates high to combat the tariffs uncertainty
2. US CPI/Unemployment on Thu - TBD
- If high CPI - good for equities as it raises probability of interest rates cut
- If high unemployment - good for equities as it raises probability of interest rates cut
3. US Core PPI on Fri - TBD
- If high PPI - good for equities as it raises probability of interest rates cut
Thus, I have a bearish view of the market and look to take Short positions here.
Technical View
At a higher time frame, I want to see price hit 5500 for a short position then.
In the short term of today and tomorrow, I want to see prices hit 5267 for me to take a Short position - there's a Supply zone there from the M5 TF.
SL: 5300 (Above supply zone and a major psychological point)
TP: 5130 (Slightly above the lows of the previous trading zone before the breakout)
Execution
1. Limit order
- SL: 5300 (Above supply zone and a major psychological point)
- TP: 5130 (Slightly above the lows of the previous trading zone before the breakout)
- TF: Close limit order before CPI or PPI reports. If no entry by then
Results of ideas thus far:
Number of trades: 2
WR: 0%
Profit: -1.1R
Notes: This is currently for personal practice to write out trade ideas. Feedback is welcome, and please don't mind if none of this makes sense.

S&PThe SPX touched a long-standing overhead, and came down ever-so-slightly to retrace the most recent peak. This is all totally normal. There is nothing here to worry about. In fact, the more touches of this overhead, the more likely it is that we break above it. You can see this has happened many times before in the S&P, where it breaks above an overhead, only to land on top of it, and then launch for a new even steeper part of the curve. The macro parabola that the markets are in.


Is Trump Intentionally Crashing the Econ?I want to preface this by saying I'm a TA and this is just dinner table chat as far as I am concerned.
I've no interest what-so-ever in why a market moves. All the money is made based on how it moves- and the TA is working great for that.
Just sharing a theory that is floating about (It's not mine).
The idea is Trump is intentionally crashing the markets in an attempt to reduce the debt burden on the US.
This would work by this sequence of events;
1 - Markets crash. Making people who care about their money anxious and less eager to take risk in the stocks (etc) markets.
2 - This money moves to bonds. Pushing bond prices up. Rising bond prices push interest rates down. So crashing the econ can lead to lower interest rates.
3 - At a lower interest rate (say 2%) the US can refi its debt.
Inside of this theory, everything we're seeing is part of a calculated plan to, literally, force stocks lower.

S&P 500: Bottoming Out or Just a Bounce?Has the market bottomed?
The S&P 500 has bounced 10% from the critical 4800 level, signaling strong buyer interest and disrupting the bearish trend that’s been in place since February 2025. Selling pressure appears to have exhausted as the bearish pattern reached its target near 5000.
This bounce is a positive sign, suggesting downward momentum may be fading. However, for a stronger confirmation, we need to see the index hold above the 4800–5000 zone. If it fails to stabilize here, the 4500 level could act as the next buffer.

S&P Weekly chart @ 4650 holds huge Price-Demand for a Bounce!1). The S&P 500 could bounce back soon, especially if Tariffs prove to be overwhelming! A). Price is on a wave 5 South towards 4650. 2). 4650 is at the 27% retracement, and typically a reversal level.

SPX - Melt up & Crash series [4]Just sticking to SPX this time due to the constant f'ery of the markets
Not financial advice

SP500: Is This the 2025 Correction? Or Just Another Bounce?Looking at the weekly chart of the S&P 500 with RSI and key support trendlines, it’s clear we’ve entered a historically important level.
🔍 Context:
2020 → COVID Crash, RSI bottomed 💥
2022 → Bear Market, RSI again flagged a major drop 📉
2023 → Healthy correction, price respected trendline support
2025? → RSI flashing oversold, price testing the long-term trendline again.
📊 RSI is approaching the same low levels as the previous two macro shocks — is this a signal of another reversal opportunity? Or could this time be different?
🚨 If we break below this trendline convincingly, it could open the door for a deeper bear leg. But if we hold, we might just see another bounce-back rally like in 2020 and 2022.
📈 Watch for confirmation:
A strong bounce with bullish RSI divergence = potential long
Breakdown + volume spike = more downside ahead
Let’s see if the trendline holds up — it has for 5 years… 👀
#SP500 #Correction #BearMarket #RSI #TechnicalAnalysis #MarketUpdate #2025Outlook #StockMarketIdeas

Watch for a Bull trapWith the market up at open you would expect buyers to come in. It could very well be a trap. Both Vix and SPX rsi is telling me a test of the low - or lower is possible in the next few days.

$SPX Trading Range for April 8 2025SP:SPX Trading Range for April 8 2025
So the arrows are pointing right to the spread I am taking today!! Credit spreads are wide here, y'all!!

Buy Low Sell High (Buy The Fine Dip)
When the market becomes "Cheap" it's time to buy. And when the market is in decline "Sell High, Buy Low". At this time we saw a lot of Institutional activity, they were positioning at the top, when the index was struggling to make new All Time Highs, which according to the Wyckoff theory, it signals a reversal. It happened way harder than anticipated. There was a tiny Dead Cat Bounce not long ago, followed by a flush in the market.
We reached the main trend line that was supported during the "COVID19 recession", the "FED's Soft Landing" and now the moment of truth, the "Tariffs & DOGE" period. If we compare the three critical moments in the market, we realize they all are the same size, 1,200 points. Let's go from there and assume the flush was the same and the support line holds. We have the ingredients for a dead cat bounce, taking the index back to 5,500, which will be another moment of truth. Will the short covering and the "buy the dip" mentality will be able to hold the levels and at least make the market pause the decline and best case scenario, consolidate? This will be answered if the index keeps above the 4,900 - 5,000-ish levels.
I don't see a change in the economic policies of this administration, which makes me think a decline will happen after this Dead Cat Bounce. In which case the markets may fall back to the 3,600 levels, which will be signaled if the main support line doesn't hold, then brace for impact. The interest rates are relatively high, the inflation is ticking up and the unemployment, after the layoffs and the DOGE purge is ticking up as well. I don't see a forced slow down in the interest rates since this would take us to a scenario of high inflation and low rates, similar to what happened during the late 70's during the "Stagflation" period where after the initial high inflation peak, lowering the interest rates only exacerbated the economy.
In the Weeks ahead we'll see the "Back to Normal" and the fanfares of a "quick recovery" in the markets, so I go long in the short term and wait for direction in the range.

Has SPX formed a bottom?SPX500USD - 24h expiry
Price action looks to be forming a bottom.
A Doji style candle has been posted from the base.
Setbacks should be limited to yesterday's low.
We look to buy dips.
Risk/Reward would be poor to call a buy from current levels.
We look to Buy at 4900.5 (stop at 4767.5)
Our profit targets will be 5295.5 and 5365.5
Resistance: 5219.6 / 5350.0 / 5500.0
Support: 5100.0 / 5000.0 / 4812.2
Risk Disclaimer
The trade ideas beyond this page are for informational purposes only and do not constitute investment advice or a solicitation to trade. This information is provided by Signal Centre, a third-party unaffiliated with OANDA, and is intended for general circulation only. OANDA does not guarantee the accuracy of this information and assumes no responsibilities for the information provided by the third party. The information does not take into account the specific investment objectives, financial situation, or particular needs of any particular person. You should take into account your specific investment objectives, financial situation, and particular needs before making a commitment to trade, including seeking advice from an independent financial adviser regarding the suitability of the investment, under a separate engagement, as you deem fit.
You accept that you assume all risks in independently viewing the contents and selecting a chosen strategy.
Where the research is distributed in Singapore to a person who is not an Accredited Investor, Expert Investor or an Institutional Investor, Oanda Asia Pacific Pte Ltd (“OAP“) accepts legal responsibility for the contents of the report to such persons only to the extent required by law. Singapore customers should contact OAP at 6579 8289 for matters arising from, or in connection with, the information/research distributed.

$SPX Review of Black Monday
Alright - Yesterday - We stayed completely with in the implied move - you can see that both sides got tested which gave us some wild swings. Spreads on both ends paid. 10% intraday moves
We hit the bottom of the implied move, the top of the implied move and we saw resistance at the 35EMA.
S&P INTRADAY oversold bounce backTrump threatened a 50% import tax on China, adding confusion over his global tariffs. China promised to hit back and moved to support its markets.
Stocks bounced slightly as investors looked for bargains, but uncertainty around U.S. trade policy remains. U.S. Treasuries rose after falling on Monday.
Wall Street is getting more cautious. BlackRock downgraded U.S. stocks, and Goldman Sachs warned the selloff could turn into a longer bear market.
Key Support and Resistance Levels
Resistance Level 1: 5273
Resistance Level 2: 5379
Resistance Level 3: 5510
Support Level 1: 4815
Support Level 2: 4700
Support Level 3: 4585
This communication is for informational purposes only and should not be viewed as any form of recommendation as to a particular course of action or as investment advice. It is not intended as an offer or solicitation for the purchase or sale of any financial instrument or as an official confirmation of any transaction. Opinions, estimates and assumptions expressed herein are made as of the date of this communication and are subject to change without notice. This communication has been prepared based upon information, including market prices, data and other information, believed to be reliable; however, Trade Nation does not warrant its completeness or accuracy. All market prices and market data contained in or attached to this communication are indicative and subject to change without notice.

SPX bounce is dueSPX RSI hasn't been so oversold since the Corona crash, plus bouncing from the 2022 ATH
Relief is due
