Bearish Alt-Bat Pattern Completed on SPX | Potential PullbackOANDA:SPX500USD
The Index is approaching a critical technical juncture as a bearish Alt-Bat harmonic pattern* completes on the 4-hour chart. This formation, finalized at the 113% Fibonacci extension level at $5,924 , signals a potential shift in market sentiment after a sustained period of upward momentum. Price action recently touched a new high at $5,924 , with immediate fractal resistance forming just above at $5,927 .
Despite this bullish extension, momentum indicators are flashing warnings. Both RSI and MACD are showing clear signs of bearish divergence, indicating that upward strength may be waning. When momentum weakens while prices continue rising, it often suggests that the underlying trend is becoming unstable.
A decisive break below $5,849 would likely confirm the pattern’s bearish implications and open the door to a corrective move. In that scenario, we will be watching for potential support near $5,579 , a previously tested level. If selling pressure continues, the next downside target could be around $5,500 , aligning with the 38.2% Fibonacci retracement level and the projected Alt-Bat target zone.
* This setup doesn't guarantee a reversal, but it significantly raises the probability of a pullback in the short term. Price confirmation below key levels will be essential to validate the pattern and assess the strength of any emerging downtrend.
Happy Trading,
André Cardoso
SPIUSD trade ideas

[𝟬𝟱/𝟭𝟮] 𝗪𝗲𝗲𝗸𝗹𝘆 𝗦𝗣𝗫 𝗚𝗘𝗫 𝗣𝗹𝗮𝘆𝗯𝗼𝗼𝗸🔍 IF/THEN QUICK GAMMA PLAYBOOK
IF > 5825 THEN path to 5900 → stall/profit-taking likely
IF > 5900 THEN path to first 5950, then 6000 → gamma squeeze extension zone
IF < 5825 THEN path to 5700 → test of transition zone support
Chop Zone: — re-entry = short-term balance/testing zone
IF < 5700 THEN path to 5500 → gamma flush / dealer unwind risk
🧭 𝗘𝗫𝗧𝗘𝗡𝗗𝗘𝗗 𝗭𝗢𝗡𝗘 𝗠𝗔𝗣/b]
✅ Gamma Flip Level
5700 → This is the confirmed Gamma Flip level = High Volatility Zone = HVL. We are comfortably above it, confirming positive gamma environment.
🧱 Major Call Walls / Resistance to upside from here
5900 → Significant call resistance zone (highlighted across GEX, profile, and /matrix command). 5825–5900 = Current rally zone → expected stall at 5900 (Profit-taking zone)5950 → Next mid-large positive gamma wall to the upside, mid-station between mounts. Dealers short gamma, adding fuel to breakout.6000 → Positive Gamma squeeze continuation target. Gamma squeeze intensifies → likely extends to 6000.🟦 Transition / Chop Zone
5700–5825 → Previous chop range. Retrace could test this before renewed upside.Currently outside and breaking up from this zone, indicating trend initiation.
Balance zone from prior structure.
Expect fade setups if price dips back in.
Needs catalyst or strong sell flow to re-enter meaningfully.
🛡️ Major Put Supports to the downside
5700 → = HVL, also aligned with pTrans and Put support.Dealer unwind risk, downside opens.5500 → Key level if the 5700 zone fails — “total denial zone” of current FOMO.
-----------------------------
This week’s SPX setup remains decisively bullish from a gamma perspective. The GEX profile shows strong positive gamma, with institutional and dealer hedging flows firmly positioned to support continued upside—especially into Friday’s OPEX. The environment is ideal for a controlled melt-up: volatility is softening, implied volatility is trending lower, and there’s no sign of panic in the options market.
Put pricing skew is also declining, which suggests reduced fear and a shift toward more aggressive call buying—another sign of bullish sentiment. Dealer positioning implies that any upward momentum is likely to be chased and hedged into, reinforcing the trend.
However, traders should stay alert: if SPX slips back below 5825, we may see a pause or retracement back into the 5700–5825 transition zone. Only a decisive break below 5700 would flip the gamma regime back to negative and open the door to real downside volatility.

S&P500 - The bottom we have been waiting for!The S&P500 - TVC:SPX - officially created the bottom:
(click chart above to see the in depth analysis👆🏻)
This month we officially saw one of the craziest stock market fakeouts of the past decade. With a drop and reversal rally of about +15%, the S&P500 is about to even close with a green monthly candle, which then indicates that the stock market bottom was created.
Levels to watch: $120, $250
Keep your long term vision!
Philip (BasicTrading)

SP500 possible top, Gold looking Bullish again. All in the video. I know calling tops is dangerous, but I state my reasons why a turn from here is more likely than not. Gold now back into balance is bullish.

S&P500 INDEX (US500): More Growth is Coming
This week, S&P500 managed to violated a significant
daily demand zone.
It opens a potential for much more growth and trend-continuation.
Next resistance - 5973
❤️Please, support my work with like, thank you!❤️

$SPX Analysis, Key Levels & Targets for Day Traders // May 15 25SP:SPX Analysis, Key Levels & Targets for Day Traders // May 15 25
Let's go, we had PPI in premarket w// Powell... Today's range looks fun.

pre market update on SP500 and GoldWe broke out of balance but the RSI is quite low. A rally at the open is possible, we will have to see. Gold found support at 3135 area. It's in a downward channel, and we will have to see if it can break above it to go long.

S&P500 Uptrend pause supported at 5925India Trade Deal: Trump claims India offered a zero-tariff trade deal with the U.S., but no official confirmation yet. He also said he told Apple CEO Tim Cook to stop building plants in India, despite Apple shifting production there to reduce reliance on China.
Iran Nuclear Talks: Iran may be open to giving up nuclear weapons in exchange for immediate sanctions relief, per NBC. Oil prices fell on speculation this could boost supply.
Russia-Ukraine Talks: Peace progress looks unlikely as Putin sent only low-level officials to talks in Turkey. Trump said he might attend “if appropriate,” but downplayed chances.
Overall: Trump is emphasizing trade and foreign policy strength, while global tensions continue to shape markets and diplomacy.
Key Support and Resistance Levels
Resistance Level 1: 5925
Resistance Level 2: 5970
Resistance Level 3: 6000
Support Level 1: 5790
Support Level 2: 5730
Support Level 3: 5685
This communication is for informational purposes only and should not be viewed as any form of recommendation as to a particular course of action or as investment advice. It is not intended as an offer or solicitation for the purchase or sale of any financial instrument or as an official confirmation of any transaction. Opinions, estimates and assumptions expressed herein are made as of the date of this communication and are subject to change without notice. This communication has been prepared based upon information, including market prices, data and other information, believed to be reliable; however, Trade Nation does not warrant its completeness or accuracy. All market prices and market data contained in or attached to this communication are indicative and subject to change without notice.

Deadcat bounce?We have pierced through the 0.786 fib retracement which is a sign of strength but it’s too early to call this the start of a bull run. We could quite easily fall back down if we fail to break the RSI resistance which is not too far away. I favour a break of the RSI as it will be the fourth attempt, but if we fail I intend to close out some of my positions to stay on the right side of risk. There’s a lot of greed and fomo entering the market again so I’m certainly not looking to fomo into more stocks here.
Not financial advice, do what’s best for you.

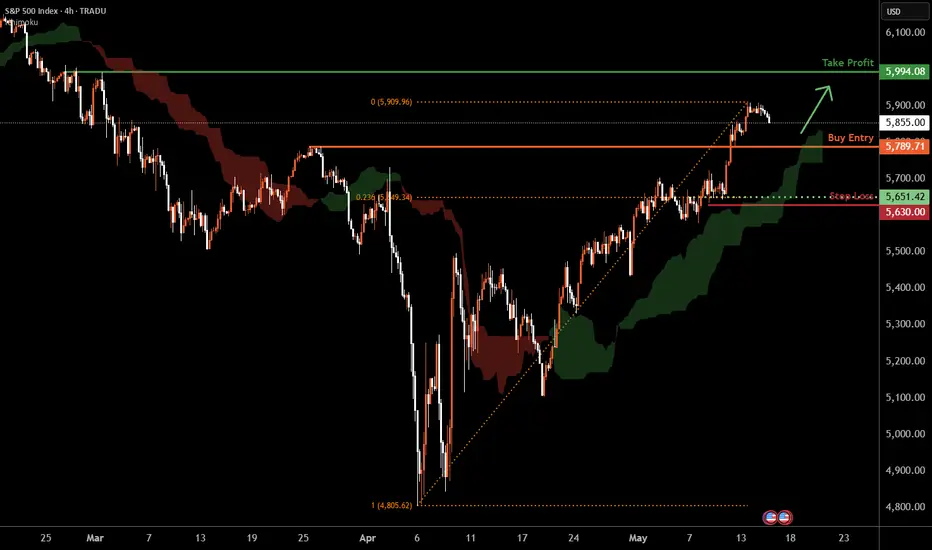
SPX500 H4 | Potential bullish bounceSPX500 is falling towards a pullback support and could potentially bounce off this level to climb higher.
Buy entry is at 5,789.71 which is a pullback support.
Stop loss is at 5,630.00 which is a level that lies underneath an overlap support and the 23.6% Fibonacci retracement.
Take profit is at 5,994.08 which is a multi-swing-high resistance.
High Risk Investment Warning
Trading Forex/CFDs on margin carries a high level of risk and may not be suitable for all investors. Leverage can work against you.
Stratos Markets Limited (tradu.com):
CFDs are complex instruments and come with a high risk of losing money rapidly due to leverage. 63% of retail investor accounts lose money when trading CFDs with this provider. You should consider whether you understand how CFDs work and whether you can afford to take the high risk of losing your money.
Stratos Europe Ltd (tradu.com):
CFDs are complex instruments and come with a high risk of losing money rapidly due to leverage. 63% of retail investor accounts lose money when trading CFDs with this provider. You should consider whether you understand how CFDs work and whether you can afford to take the high risk of losing your money.
Stratos Global LLC (tradu.com):
Losses can exceed deposits.
Please be advised that the information presented on TradingView is provided to Tradu (‘Company’, ‘we’) by a third-party provider (‘TFA Global Pte Ltd’). Please be reminded that you are solely responsible for the trading decisions on your account. There is a very high degree of risk involved in trading. Any information and/or content is intended entirely for research, educational and informational purposes only and does not constitute investment or consultation advice or investment strategy. The information is not tailored to the investment needs of any specific person and therefore does not involve a consideration of any of the investment objectives, financial situation or needs of any viewer that may receive it. Kindly also note that past performance is not a reliable indicator of future results. Actual results may differ materially from those anticipated in forward-looking or past performance statements. We assume no liability as to the accuracy or completeness of any of the information and/or content provided herein and the Company cannot be held responsible for any omission, mistake nor for any loss or damage including without limitation to any loss of profit which may arise from reliance on any information supplied by TFA Global Pte Ltd.
The speaker(s) is neither an employee, agent nor representative of Tradu and is therefore acting independently. The opinions given are their own, constitute general market commentary, and do not constitute the opinion or advice of Tradu or any form of personal or investment advice. Tradu neither endorses nor guarantees offerings of third-party speakers, nor is Tradu responsible for the content, veracity or opinions of third-party speakers, presenters or participants.
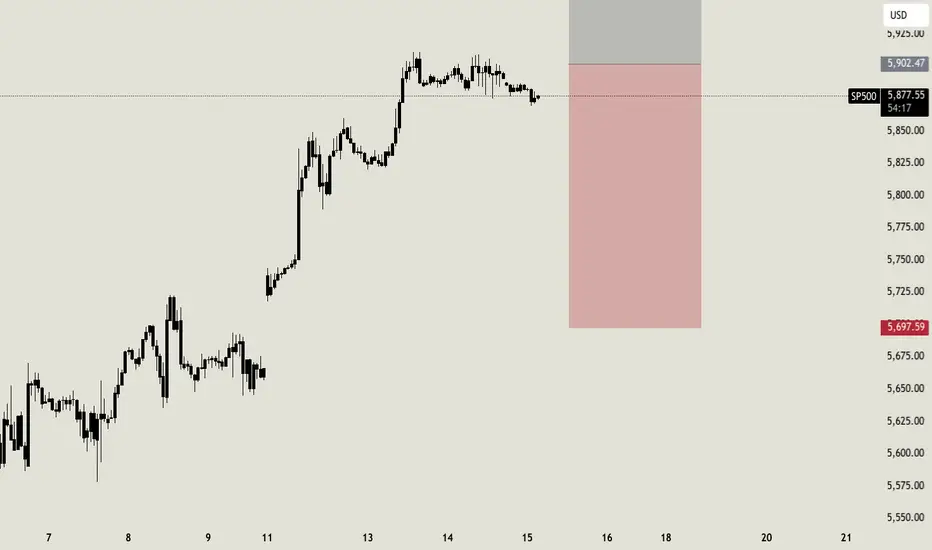
SP500 Waiting the right time to sellSP500 has reached a possible reversal area on a daily timeframe. On lower timeframe, we can expect a sideline moves for the next hours with a possible short entry around 12 (NY Time). The target is half of the current open market gap.
This is a mid term trade based on graphic and statistical analysis. I usually operate on smaller timeframe with scalp trades, that can't be posted here.
SPX : A Classic Blow-Off Top FormationWhat we are seeing now is NOT healthy. The rise is not due to a great economy. This rise is due to great stress in the system - no fundamentals, just positioning, leverage, and illusion. All the clues are there for all to see.
And when this time it collapses, it would be UGLY.
This is another GOOD time to SELL.
Good luck.

Tariffs Shocked the World, But Look What Happened NextTrump's “Liberation Day” reciprocal tariff announcement triggered a sharp selloff in the S&P 500 on the 2nd April. A classic policy shock! But the market has since clawed back every point.
So what now? Let’s break it down by strategy.
🔎 Long-Term Investors: Stay the Course
1) This recovery reinforces one truth: When you own quality businesses, Volatility ≠ Risk. Policy creates opportunity, not exit signals.
2) Stick with great companies, buy on fear, and ignore the noise. The next 10 years won’t be won by panic.
⚡ Momentum Traders: Technical Reversal Delivered
1) S&P 500 bounced above its 30-day MA. With the May 12th’s bullish gap (post temporary tariff pause) confirming the trend shift.
2) This was a textbook momentum setup. But if you didn’t plan for the whipsaw, you missed the edge.
📈 What This Means Now
Short-term volatility is likely to continue as tariffs, rates, and elections are all on the table.
Watch for pullbacks into structure and keep risk tight as news-driven moves will be fast and brutal.
Choose your timeframe. Respect the trend. Don’t confuse noise with signal.
The edge now isn’t in prediction — it’s in preparation.

S&P 500 INDEX ,,, Possible pullback Uptrend
Needless to say, every rising will be risky without a correction (either price or time).
After about three months of upward moving with just a small time correction, personally I am waiting for a correction to get new buying positions. In addition, some of the companies have prices rising dramatically and this proves that having a small corrective wave is vital for the market. Around 5800 can be a good place for a correction and a pullback. totally wait for another sure trigger for entry or adding new buying positions.
Good luck.
TIME TO TAKE DOWN THE "Trump Low" !When the president of USA says buy buy buy, and everyone buy, you think everyone gonna be happy and in profit?
Markets doesnt work like that, they don't. time to take down the Trump low, then run everything up to new highs

Time to take down the "Trump low"When the president of USA says buy buy buy, and everyone buy, you think everyone gonna be happy and in profit?
Markets doesnt work like that, they don't. time to take down the Trump low then run everything up to new highs

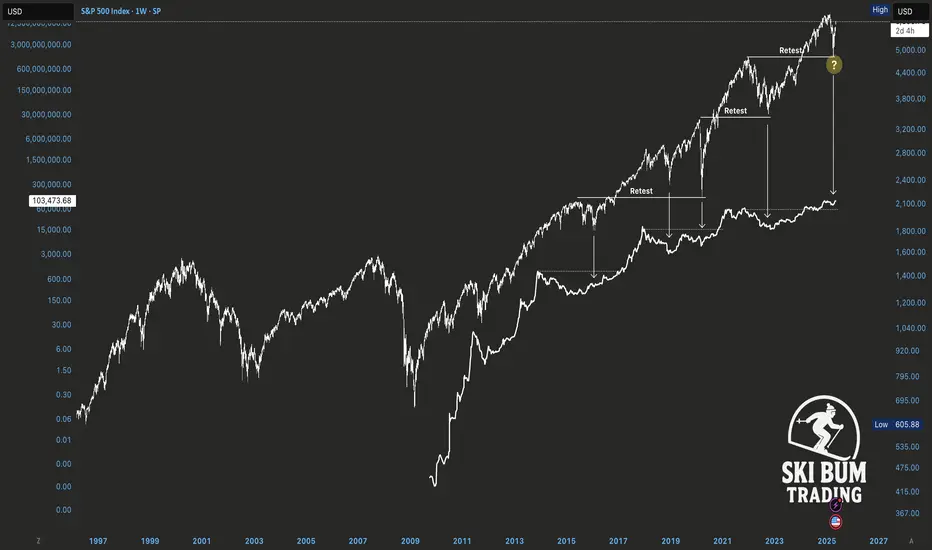
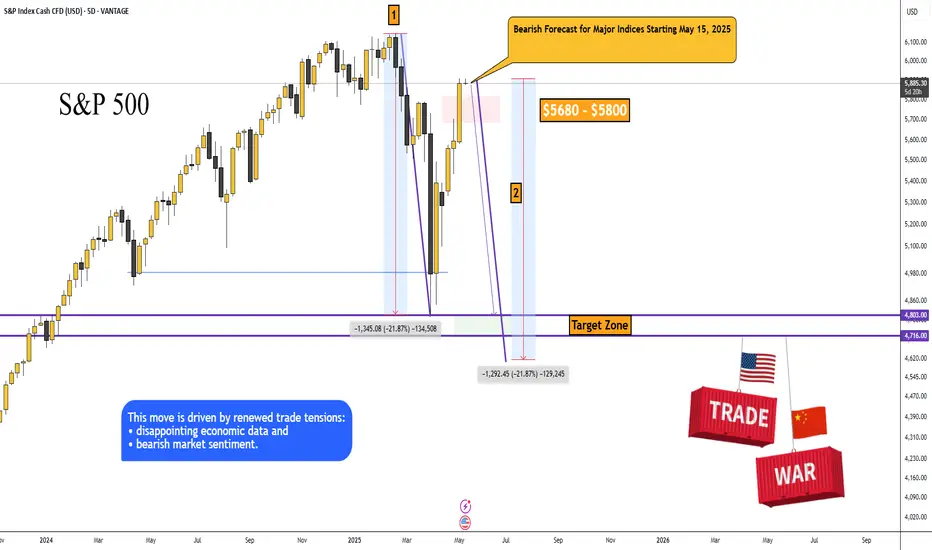
SP500: Bearish Forecast for Major Indices Starting May 15, 2025Bearish Forecast for Major Indices Starting May 15, 2025
The S&P 500, Dow Jones, Nikkei 225, and other major indices are poised to begin a significant decline, potentially as early as today, May 15, 2025, targeting a retest of the price lows from April 7, 2025, and possibly lower (S&P 500: ~4,802.20, Dow Jones: ~36,611.78, Nikkei: ~30,340.50).
This movement is driven by renewed trade tensions, disappointing economic data, and pervasive bearish market sentiment.
1. Fundamental Factors Driving Potential Decline
1.1. Renewed Uncertainty in Trade Policy
· The rally in indices on May 12–13, 2025, was fueled by optimism surrounding a temporary U.S.-China tariff reduction agreement (a 90-day truce) announced after talks in Switzerland on May 11, 2025. However, as of May 15, 2025, investor confidence may be waning due to a lack of tangible progress in ongoing U.S.-China trade negotiations.
Trigger for May 15: Recent reports highlight conflicting statements from the Trump administration, with earlier promises of new trade deals (e.g., a U.K. deal on May 8) followed by uncertainty. A Reuters report from May 14, 2025, notes that U.S. Trade Representative Jamieson Greer and Treasury Secretary Scott Bessent are meeting with Chinese officials, but no new agreements have been confirmed. If today’s talks yield no positive outcomes or if President Trump escalates rhetoric (e.g., reinstating higher tariffs), markets could plummet, as seen in early April when tariffs triggered a 15% drop in the S&P 500.
· Trade war fears disproportionately impact export-heavy indices like the Nikkei, which is sensitive to yen appreciation and U.S.-China tensions, and the Dow Jones, with its significant exposure to multinational corporations. A breakdown in negotiations could drive indices toward the April 7 lows as investors price in higher costs and slower global growth.
1.2. Disappointments in Economic Data
· CPI Reaction: The April 2025 Consumer Price Index (CPI), released on May 14, 2025, reported inflation at 2.3% annually, below the expected 2.4%. While initially viewed as positive, markets may have anticipated an even lower figure to justify Federal Reserve rate cuts. The modest S&P 500 gain (+0.7%) and Dow’s decline (-0.6%) on May 14 suggest investor skepticism about further inflation cooling.
· Producer Price Index (PPI) Release on May 15: The PPI for April 2025, scheduled for release at 8:30 AM ET (2:30 PM CEST) on May 15, 2025, is a pivotal event. If the PPI indicates persistent wholesale inflation—potentially driven by tariff-related cost pressures—it could signal rising consumer prices ahead, diminishing hopes for Fed policy easing and triggering a sell-off. A higher-than-expected PPI could echo the market’s reaction to mixed economic data in early April, when GDP contraction fears pushed indices lower.
· Consumer Sentiment: The University of Michigan Consumer Sentiment Index for May 2025, released on May 14, 2025, likely showed continued weakness (April’s reading was 52.2, a multi-year low). If the May figure, reported yesterday, declined further, it could amplify concerns about reduced consumer spending, negatively impacting corporate earnings and pushing indices downward.
1.3. Concerns Over Federal Reserve Policy
· On May 7, 2025, Fed Chair Jerome Powell highlighted heightened economic risks, citing “elevated uncertainty” due to trade policies. Markets are pricing in 75 basis points of rate cuts for 2025, with the first cut expected in July.
· Trigger for May 15: If today’s PPI data or other economic indicators (e.g., Initial Jobless Claims, also due at 8:30 AM ET) point to persistent inflation or economic weakness, expectations for rate cuts could fade, increasing borrowing costs for companies and pressuring equity valuations. This scenario would mirror April 7, when recession fears and tariff impacts drove the S&P 500 below 5,000.
2. Technical Analysis
· The initial impulse move saw a decline of approximately -21.87%, with a second impulse of similar magnitude (marked on the chart). Currently, markets are aligned for a simultaneous decline across asset classes: oil, cryptocurrencies, and major indices like the S&P 500, Dow Jones, Nikkei, and others.
· Previous analysis concluded that this is a correction preceding a broader decline in indices, driven by trade wars, geopolitical conflicts, and U.S. economic indicators. I believe a recession is already underway.
Price Targets for S&P 500 Decline:
➖ Retest of the April 7, 2025, low: $4,803.00
➖ Secondary target: $4,716.00
3. Market Sentiment and Behavioral Factors
3.1. Fragile Optimism Post-Rally
· The S&P 500’s 22% rally from April lows and the Dow’s 15% recovery were driven by trade truce optimism and strength in technology stocks (e.g., Nvidia, Palantir). However, Bloomberg reported on May 14, 2025, that Wall Street’s rebound is “showing signs of exhaustion” due to trade war risks and fears of an economic slowdown. This fragility could lead to profit-taking today if negative news emerges.
· The Dow’s weakness on May 14 (down 0.6% compared to the S&P 500’s 0.7% gain) highlights vulnerabilities in specific sectors (e.g., healthcare following UnitedHealth’s 18% drop), which could spread to broader markets.
3.2. Global Market Correlation
· Asian markets, including the Nikkei, exhibited mixed performance on May 14, with China’s CSI 300 up slightly (+0.15%) and India’s Nifty 50 down 1.27%. If Asian markets open lower on May 15 due to overnight U.S. declines or trade-related news, it could create a feedback loop, intensifying global selling pressure.
4. Mini Evidence-Based Framework for the Forecast
4.1. Catalysts for Today’s Decline (May 15, 2025)
PPI Data (8:30 AM ET): A higher-than-expected PPI could signal persistent inflation, reducing the likelihood of Fed rate cuts and triggering a sell-off. Consensus anticipates a 0.2% monthly increase; a reading above 0.3% could be bearish.
Trade Talk Updates: Negative commentary from U.S. or Chinese officials (e.g., no deal reached in Geneva) could reignite trade war fears, mirroring the April 7 sell-off.
Initial Jobless Claims (8:30 AM ET): An unexpected rise in claims (e.g., above 220,000 compared to the prior fmadd211,000) could signal labor market weakness, amplifying recession fears.
4.2. Global Scenario for S&P 500
· I anticipate a wave-like decline with intermittent corrections. I wouldn’t be surprised if the S&P 500 falls below 4,700, potentially reaching 4,200. Extreme caution is warranted this year.
· There’s even a theory that, starting in 2025, the U.S. dollar could lose 50% of its purchasing power.
Idea:
4.3. Oil and Geopolitical Outlook
I expect oil (Brent) to decline to the $50+/- range, from which an upward trend may begin, potentially tied to future military conflicts:
· Europe vs. Russia
· India vs. Pakistan
· Iran vs. Israel
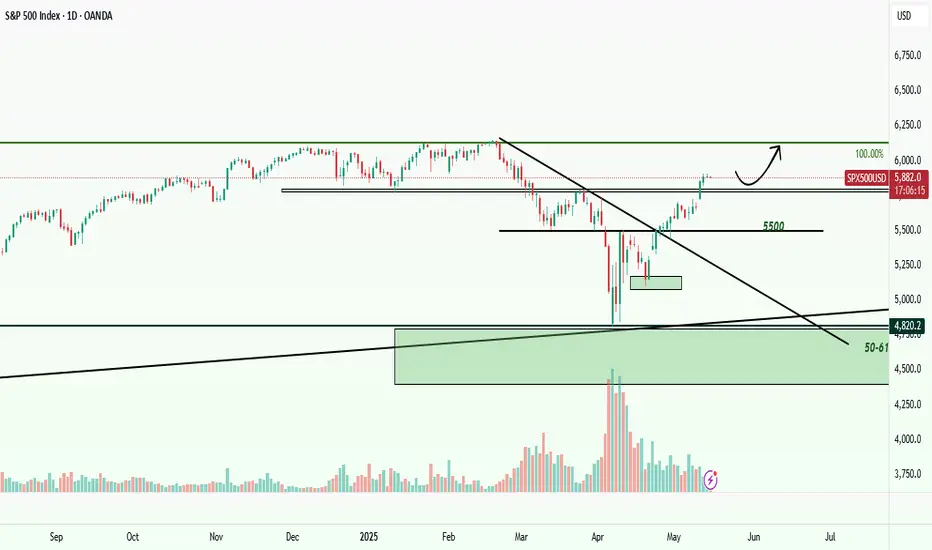
Weekly SPX Has A Bottom W Pattern Prompting More Upside!Hey Traders and Followers! SPX is going up!
Sounds crazy despite the tariff news floating around but charts never lie.
Here's what we got on the weekly SPX/USD; We have a bottoming W pattern. What's that mean? We going higher people.
5690.7 is the beakline area, price above invites bulls to a party.
Target for this long is at 6198.9 area. Support sits at 5579.4 for this one.
I'm letting you know about this party so up to you if you want to have a good time. See you all there with bells on and cash for all $ for those who show up.
Best of luck in all your trades $
Cheers!


3pm update SPX and GoldSPX has been in balance all day, I expect a breakout and failure around 5925-5930(where stops are). Pullback should start overnight and tomorrow if this happens. Gold has broken balance and has not recovered, but be wary of an attempt at bulls to try and regain it.

S&P500: VIX confirmed new Bull Cycle, eyes 9,800.S&P500 is on excellent bullish levels on its 1D technical outlook (RSI = 66.480, MACD = 76.110, ADX = 38.627) and has technically fulfilled all conditions to extend this recovery and transition into a new Bull Cycle. VIX shows with its massive spike and then aggressive retreat that the correction's bottom is in and is in fact similar to March 2020 (COVID) and March 2009 (subprime crisis). The Bull Cycles after those were similar, the smallest was +105.62%. In accordance to that, we have a long term TP = 9,800.
## If you like our free content follow our profile to get more daily ideas. ##
## Comments and likes are greatly appreciated. ##

SPX Short Trade idea. Short SPX target 2 days. buy a debit put spread 5880/5890. SPX is losing momentum and need to come down.

S&P500 vs BitcoinNormally, when the S&P500 goes into a bear market, Bitcoin follows.
This cycle, however, for the first time, the S&P500 went into a bear market, while BTC remained above its prior all time highs.
This cycle, Bitcoin either proves a new level of resilience among broader economic uncertainty, or a similar pattern is still yet to play out.