A pullback is expectedA pullback is expected but a rally into the open first looks probable. If the pullback looks strong, it could be a C wave down with another move to 5700+ after.
SPIUSD trade ideas

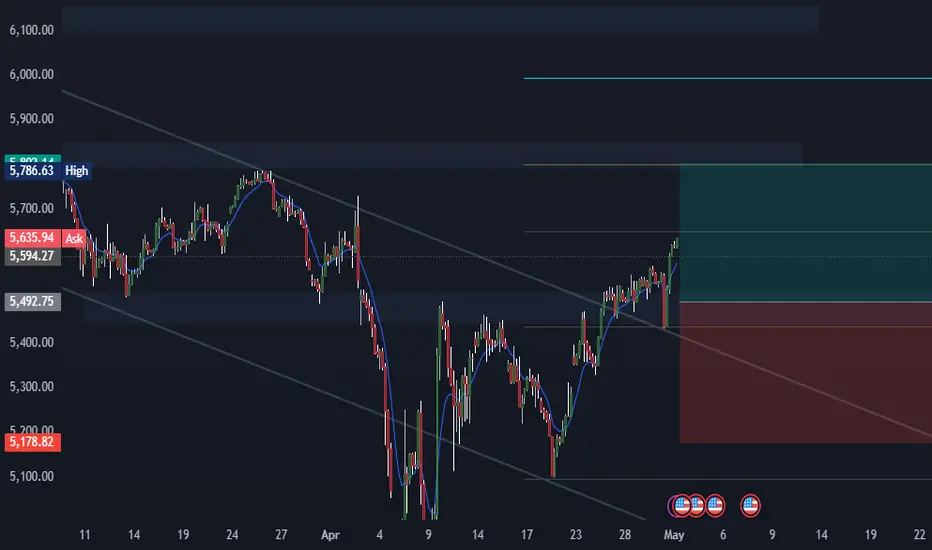
S&P500 INTRADAY resistance at 5670Tech Surge Lifts Markets:
Strong earnings from Microsoft (+7.8%) and Meta (+6.2%) are driving early market optimism. Both beat revenue expectations, easing concerns about trade war impacts.
→ S&P 500 futures up over 1%.
Trade Deal Hopes:
Sentiment is boosted by signs that President Trump may soon announce initial trade agreements, reducing geopolitical risk.
Bank of Japan Dovish Shift:
The BoJ cut its growth forecast and delayed its inflation target, signaling caution.
Yen fell as much as 1.2%.
US-Ukraine Investment Deal:
The US secured privileged access to Ukraine’s natural resources, potentially helping ease tensions as part of broader efforts to end the war.
Earnings Watch:
Before Open: Mastercard, Estee Lauder, Eli Lilly, Moderna, McDonald’s
After Close: Apple, Amazon, Amgen, Airbnb, Reddit
Key Support and Resistance Levels
Resistance Level 1: 5670
Resistance Level 2: 5740
Resistance Level 3: 5820
Support Level 1: 5440
Support Level 2: 5385
Support Level 3: 5316
This communication is for informational purposes only and should not be viewed as any form of recommendation as to a particular course of action or as investment advice. It is not intended as an offer or solicitation for the purchase or sale of any financial instrument or as an official confirmation of any transaction. Opinions, estimates and assumptions expressed herein are made as of the date of this communication and are subject to change without notice. This communication has been prepared based upon information, including market prices, data and other information, believed to be reliable; however, Trade Nation does not warrant its completeness or accuracy. All market prices and market data contained in or attached to this communication are indicative and subject to change without notice.

SPX Play-by-Play: From Trap to Trend and Back AgainJust price, structure, and volume — tracked in real time.
🧠 Chart Breakdown:
✅ Early Short Trap / Failed Breakdown — Sellers tried to press lower early, but price held key levels and reversed. That shift became the foundation for the entire move that followed.
✅ Breakout Long Trigger — After reclaiming structure, price drove into new highs with strong follow-through. Volume confirmed the breakout.
⛔ Top Rejection — Price pushed into resistance but couldn’t hold. Momentum faded, candles hesitated, and sellers stepped in.
✅ Fib-Based Bounce — After the pullback, price responded cleanly off fib-based support. The bounce was sharp, and volume backed it.
✅ Steady Uptrend Structure — Price moved in an orderly fashion. Small pullbacks held structure, and volume stayed supportive — a textbook controlled climb.
⛔ Range Resistance — Price returned to a previously rejected zone. Wicks and hesitation reappeared.
👀 Current Breakout Watch — Price is testing that resistance again. A reclaim with strength signals continuation. Another fade? Let it go.
Always happy to be helpful.

SPX ready for the correctionhi traders,
This is probably not what most traders want to see but we must be realistic.
The monthly close is upon us and it's not gonna be a bullish close.
A lot of selling pressure and it may be just the beginning.
A 13 % correction on SPX is more than likely in my opinion.
If the price loses the upsloping support, we will see the mark-down pretty soon.
Stoch RSI suggests that the bears are taking control.
My target for SPX is between 5200 and 5000.
Get ready to buy cheap stocks and cheap crypto!

SPX long ideaBreakout of descending channel price retested and rejected most previous structure and aligns with 38. fib level on daily.
Targeting 27.2 level first.
Opinions?

SPX Peaks at 6,100; Correction Toward 4,600 LikelyThe SP:SPX ’s rally, which kicked off at 3,500 in late 2022, climaxed around 6,100 in February 2025.
Since then, the trend has clearly reversed, and I expect the correction to persist. As long as the index remains below 5,800 (supply), downward momentum should continue.
A pullback toward 4,600 by 2026 appears plausible, with that level likely acting as resistance or support—warranting a fresh assessment upon arrival.
In the near term, the SPX is likely to trade within a 5,100–5,700 range.

Arshitecture / 30 Min Short Position SP500After the price reaches TP1, hold the current short position and consider adding to it on valid signals to ride the move toward TP2. Apply the same strategy for TP3, scaling in cautiously at key resistance zones.
I’ll share the key confirmations on the chart as they appear.
Goodluck BLUEBERRY:SP500

Hellena | SPX500 (4H): LONG to resistance area of 5682.Colleagues, I think that the deep downward movement is over and at the moment I expect an upward movement in a five-wave impulse. At the moment I expect a correction in wave “2” to the area of 5100, after which I expect the development of wave “3” at least to the resistance area of 5682.
There are two possible ways to enter the position:
1) Market entry
2) Pending Limit Orders.
Manage your capital correctly and competently! Only enter trades based on reliable patterns!

US500 - Long-Term Long!Hello TradingView Family / Fellow Traders. This is Richard, also known as theSignalyst.
📈US500 has been overall bullish trading within the rising channel marked in blue.
Moreover, it is retesting its previous all-time high at $4,800 and round number $5,000.
🏹 Thus, the highlighted blue circle is a strong area to look for buy setups as it is the intersection of previous ATH and lower blue trendline acting as a non-horizontal support.
📚 As per my trading style:
As #US500 approaches the blue circle zone, I will be looking for bullish reversal setups (like a double bottom pattern, trendline break , and so on...)
📚 Always follow your trading plan regarding entry, risk management, and trade management.
Good luck!
All Strategies Are Good; If Managed Properly!
~Rich
Disclosure: I am part of Trade Nation's Influencer program and receive a monthly fee for using their TradingView charts in my analysis.

Please criticise on this strategy using SPXI have not backtested this strategy and to use the "REPLAY" button would costs me some money so you can say, it is biased since the candles were already formed ahead.
Strategy -
Time frame - 1H
Risk/Reward - Keep to 1:2 strictly
Example : Trade Setup 1
11 Apr 25 candles closed above 10 Apr 25 - LONG
SL at closing of 10 Apr
Profit target - 1 : 2
You can see that you are stopped out AFTER you set up Trade set up 2 (21 Apr red candle), ie 10 days later , you are in a LOSS position.
Trade setup 2 -
Long on 17 Apr
got stopped out on 21 Apr when it gapped down. See the power of having a SL else your losses will magnified overnight!!!!
So in this chart, there were 5 trades, 3 in profits and 2 in losses. Overall, you gained because your rewards are 2x so in this case you won 3 multiply by 2x = 6x but your losses are 1x or 3 multiply by 1x= 3x so nett off you gained 3x
I would avoid using leverage to trade and keep to the strict rules of 1- 2 trades per week and strictly 1:2 risk/reward ratio. Of course , if you manually watch the chart live (meaning you need to stay awake to glue on the computer)
you might gained more than 1:2 risk/reward but that is not the essence of this strategy.
Keeping the frequency low tame your emotions (greed) of increasing your position size and risk/reward. What you want is CONSISTENCY not huge spike up and down. Don't think you can make 5x in a day and go on holidays for the next few days. You gotta put in the work (sufficient charting skills allow you to be more nimble and confident but not to inflate your ego by excessive trading).
I suggest paper trade for a good 1-2 months and see the results yourself BEFORE you say it work or doesn't. Paper trade is good especially for beginners but once you surpassed this stage, I think using your own money to trade is the real game. Staring at 10% loss is very real and some can take it well while others can't handle it and will manually adjust the SL or PT to modify the strategy. Keep it simple until you gained consistent profits.
As usual, please DYODD

SPX bullishI am now bullish in near term. For those following me, I have updated HILO EMA squeeze band with an option to plot more lines as seen this chart. I see a swing high of 5770, although a bit cautious about the month end. Market is tired of Trump tantrums and more focused on earnings which have been great so far. For near term month or two I would be looking for bye the dip

Into the Close, some thoughts about the price actionA difficult and choppy day again. We did rally from the low to 5525 as I thought, but it's possible this was a squeeze to take shorts out before the bigger move down into the rest of the week. it's difficult to say with big earnings about to hit. The daily candle is forming a hanging man, and it could be a clue. We'll see how it looks tomorrow.

SPX as an exampleCorrect me if I'm wrong, but this has got to be one of the craziest monthly candlesticks the stock markets have ever printed, and perfectly completes a potential wave 4 in a 5 wave count.

S&P500 is set to rebound to new highsDual EBP on the weekly and daily indicative of bullish price action and time frame allignment. S&P500 is set for new highs.

Another reversal 5600 now likelyWe came down to the top of the previous range and with the RSI as low as it got, the chances for reversal was high. I took profits and reversed long. I am now expecting 5600 and the 50 ma to finally get reached.
