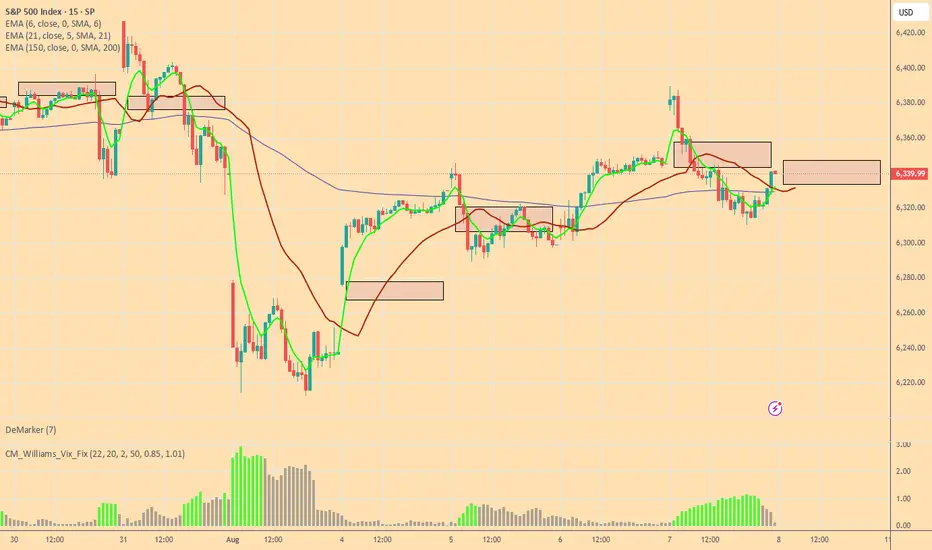
Bulls and Bears zone for 08-08-2025ETH session has rallied to 61.8 Fibonacci level of yesterday's RTH session. Any test of ETH session High could provide direction for the day.
Level to watch: 6384 --- 6386
SPIUSD trade ideas
This V-Pattern on SPX500 Is Stupid CleanHey, it’s Skeptic.
In this video, I’m breaking down a clean V-pattern setup on SPX500 — right in line with what I taught in yesterday’s educational post.
We’re starting from the Daily time frame and walking through the logic behind my long trigger, why the previous fakeout was actually useful, and how to set your stop-loss depending on your trading style (H4 vs 15min).
This isn’t just chart talk — it’s about reading the story behind the candles.
If it helped you see things clearer, give it a boost and drop your thoughts below.
Let’s keep learning — one trap at a time.
Until next time, peace out.
📌 Disclaimer: This video is for educational purposes only and does not constitute financial advice. Always do your own research and manage your risk.

S&P bullish continuation supported at 6340Tariff Turmoil and Geopolitical Shifts – Implications for S&P 500 Trading
Donald Trump's sweeping new tariffs officially took effect, hitting nearly all U.S. trading partners. Switzerland, facing the steepest rates among developed nations, may retaliate by cancelling a major fighter jet purchase, signaling potential defense-sector implications.
Key developments:
Semiconductor imports to face 100% tariffs, unless production is moved onshore – a bullish signal for domestic chipmakers (e.g., Intel, GlobalFoundries) but negative for firms reliant on overseas fabs.
Additional tariffs floated on China over purchases of Russian oil, echoing similar penalties on India – suggesting growing fragmentation in global trade.
Market impact:
S&P 500 sectors likely affected:
Tech (Semis): Tariff pressure may weigh on multinationals like Nvidia or AMD short term, but benefit domestic fabs and U.S.-based supply chains.
Industrials/Defense: Swiss retaliation could ripple through defense contractors if deals are halted.
Energy/Commodities: Any China-Russia oil tensions could lead to energy volatility, affecting names like ExxonMobil or ConocoPhillips.
Meanwhile, China’s exports unexpectedly rose, softening the blow from the U.S. tariff crackdown. Chinese equity gains could calm broader EM sentiment, helping mitigate global risk-off contagion.
Finally, Trump signaled potential peace talks with Putin and Zelenskiy, with the Kremlin confirming a Putin meeting soon. A diplomatic breakthrough could ease geopolitical risk, supporting investor sentiment and equities globally.
Bottom Line for S&P 500:
Expect sector rotation as traders digest tariff fallout. Watch for:
Strength in domestically focused tech and defense stocks
Caution around globally exposed industrials and semis
Short-term volatility tied to trade rhetoric and geopolitical headlines
Key Support and Resistance Levels
Resistance Level 1: 6437
Resistance Level 2: 6480
Resistance Level 3: 6520
Support Level 1: 6340
Support Level 2: 6295
Support Level 3: 6256
This communication is for informational purposes only and should not be viewed as any form of recommendation as to a particular course of action or as investment advice. It is not intended as an offer or solicitation for the purchase or sale of any financial instrument or as an official confirmation of any transaction. Opinions, estimates and assumptions expressed herein are made as of the date of this communication and are subject to change without notice. This communication has been prepared based upon information, including market prices, data and other information, believed to be reliable; however, Trade Nation does not warrant its completeness or accuracy. All market prices and market data contained in or attached to this communication are indicative and subject to change without notice.

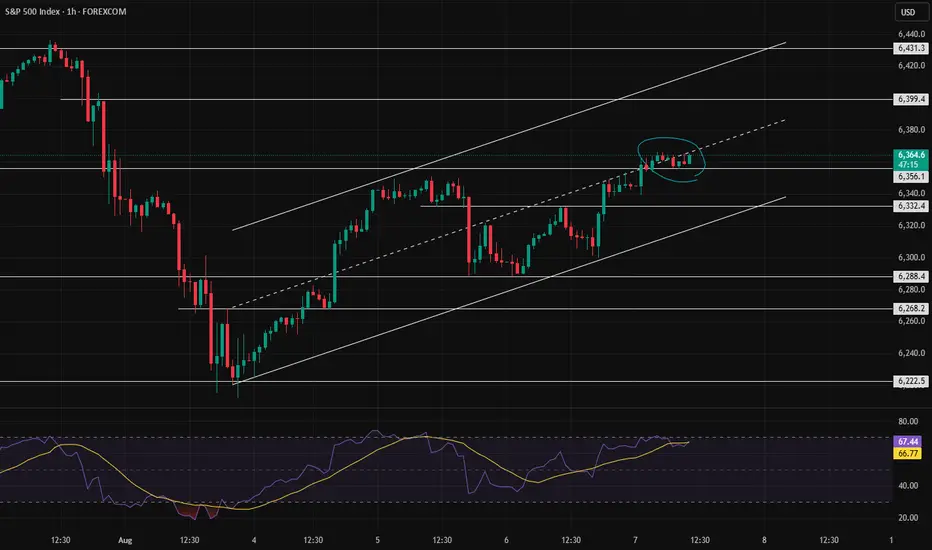
Decision pointThe weakness of the trend is clearly visible, but we need to see how it reacts to the channel’s midline. If buying pressure increases, the price could reach 6400. Otherwise, a correction down to around 6330 is likely.
US500 Market Insight US500 Market Insight
The US500 continues to demonstrate resilience amid a complex macroeconomic backdrop, trading around 6,388 at mid-session today. This represents a modest 0.40% recovery from the previous close of 6,299, signaling improving investor sentiment despite ongoing market headwinds.
Fundamental Outlook: Market Resilience Amid Volatility
After a stretch of choppy trading sessions driven by mixed U.S. economic data and escalating tariff concerns, the index has regained its footing above the psychologically important 6,300 support level. This bounce reflects investor confidence in the broader market’s fundamentals, particularly in the face of global policy uncertainties.
Strong Corporate Earnings as a Key Driver
Earnings season has delivered notable upside surprises, particularly in the technology, consumer discretionary, and financial sectors. Positive forward guidance and robust profit margins have underpinned the index’s strength, helping offset negative sentiment from trade related headlines and slowing global demand in select sectors.
Dovish Federal Reserve Expectations
Markets are increasingly pricing in a more accommodative stance from the Federal Reserve, even as policymakers continue to stress a data dependent approach. With inflation surprising on the upside and NFP data coming out softer, this is reinforcing expectations for possible rate cuts later in 2025. This has eased pressure on equities and boosted appetite for risk assets.
Technical Outlook: Bullish Continuation
From a technical perspective, the US500 remains in a well defined long-term uptrend. Maintaining price action above 6,300 strengthens the case for further gains, with 6,400–6,500 seen as the next potential resistance zone. Keep watching for consolidation above 6,300 to confirm breakout momentum.
Key Risks and Market Sensitivities
Despite the positive bias, risks remain. The index remains highly sensitive to global trade developments, particularly US-China and US-EU tariff disputes. In addition, any shift in Fed tone or unexpected inflation data could trigger renewed volatility.
Conclusion
The US500’s current recovery reflects a careful balance of strong earnings, improving rate outlook, and technical support. While bullish sentiment persists, the path forward will likely remain data driven and headline sensitive, requiring traders to remain nimble. A sustained break above 6,400 could open the door to new highs later this quarter, but near-term volatility should not be discounted.
Analysis by Terence Hove, Senior Financial Markets Strategist at Exness
SPX BUY SPOT 8/61h had a unicorn setup I seen forming yesterday. Today I got on just after 7:30 am and saw price inside POI/IPA. All it did was WICK that gap, not fill it. I went against the 4h and 1h candles both being bearish because price reacted to the OPEN of the FVG. This makes it risky because we could still fill and sweep below that wick. Just had a little FOMO this morning once the reaction happened. No major news until tomorrow. I love the sweet spot where price is. Perfect HL area on 1 hour even tho we can sweep lower again, we shall see!

SPX Breakdown or Another Push Higher?Hi y'all thanks for tuning in! Here are a few written notes to sum up the video.
Indecision at New Highs
After breaking out to new all-time highs, SPX printed a doji on the weekly chart, signaling indecision. This hesitation could mark the start of digestion.
Still Structurally Bullish, but Extended
The weekly chart shows SPX is still holding trend structure, but price is notably extended from the 10EMA. Historically, when price moves too far from key short-term EMAs, it tends to reset either via time (sideways chop) or price (pullback).
Daily Chart Shows a Shelf Forming
On the daily chart, price has been consolidating just under the prior high with small-bodied candles. This is forming a “shelf” around the 6,260–6,280 zone. It’s acting like a pause, not a breakdown. Holding above this zone keeps the trend intact.
Pullback Risk Increases Below 6,232
If price loses 6,232 (last week's breakout area and short-term shelf), it increases the likelihood of a pullback toward the 6160 or even deeper toward the 5970. That lower zone also marks the bottom of the prior consolidation box from earlier this year.
Seasonality Reminder
Historically, July is strong in the first half, with weakness (if it shows up) arriving mid-to-late month. So far, price has tracked that seasonal strength. Any weakness from here would align with that typical timing.

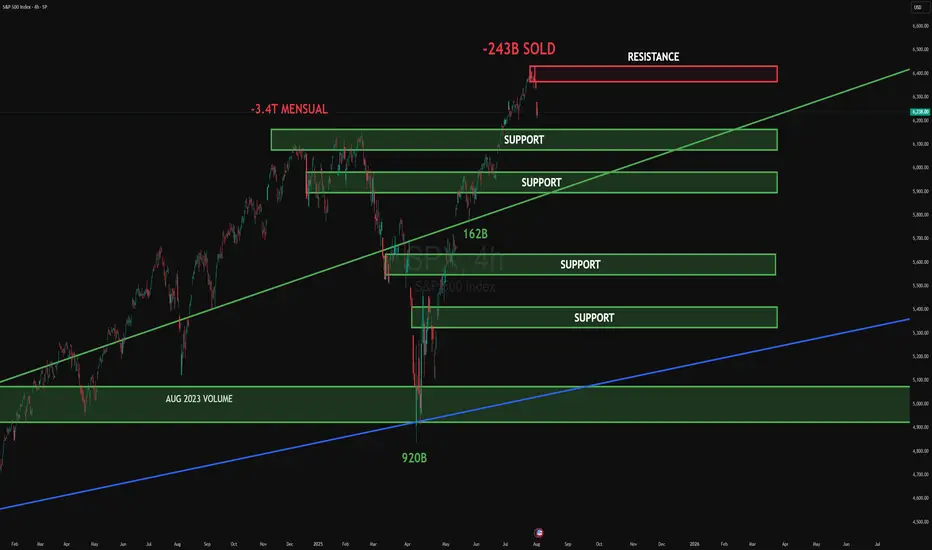
SPX CORRECTIONThe S&P 500 Index (SPX) faced strong rejection at the upper resistance zone near 6,400, where -243B was sold, signaling aggressive institutional distribution. This area aligns with the broader -3.4T monthly level, confirming it as a significant ceiling.
Multiple support levels lie below. The first key zone near 6,200 is being tested. If broken, deeper liquidity pockets are visible around 6,000 and 5,700, where 162B was previously absorbed. Further down, the high-volume August 2023 level near 5,000 remains a macro support with 920B of institutional activity.
Upside target (if reclaimed): 6,400
Downside target (if breakdown continues): 5,700 → 5,000
#SPX #globaltrade #investment #investing #stockmarket #wealth #realestate #markets #economy #finance #money #forex #trading #price #business #currency #blockchain #crypto #cryptocurrency #airdrop #btc #ethereum #ico #altcoin #cryptonews #Bitcoin #ipo
Correction will be to 6050-6190, probably the upper limit Now I notice something very important and things and the analyses of many actually coincide. Monthly support from the accumulated volume lies between 6050 and 6170. 4h indicators show a clear reversal. Separately, at these levels are the previous ATH. In my opinion, it is possible to stop even at 6180-6190. We will probably start with a gap on Monday. Now here comes the moment and over the weekend what will take place as conversations and statements in the media, but it is very likely that the minimum could happen as early as Monday night (USA time) or by Tuesday. I agree that this correction was necessary and should have happened as soon as possible because things became difficult even for bulls like me.
SPX500 NEARING AN IMPORTANT FIB. EXTENSION RESISTANCEIn this weekend's analysis I find the SPX500 to remain BULLISH for next few days as we have strong closings outside the upper KC band and also touching the upper Bollinger band on the higher time frames from Daily to Monthly charts. It's also important to note that declining volume bars is NOT supporting the monthly rally, while MACD, RSI divergences are also sounding warning sirens that it's near a major correction territory which I have measure as the fib extension 0.618 from the October, 2022 base or support on the monthly chart. As signaled last week that we could be getting a capitulation candle soon to the fib target. Once we get a reversal candle on the 4 Hours it will confirm that the intermediate tops is achieved on the SPX500 and a correction is highly probable. So our trade thesis is Bullish until we get a confirmed bearish signal on either the 4H or 1D timeframe with Stop loss at 6377 level. Thanks for visiting my publication and trade idea on the SPX500. Cheers and happy trading to everyone.

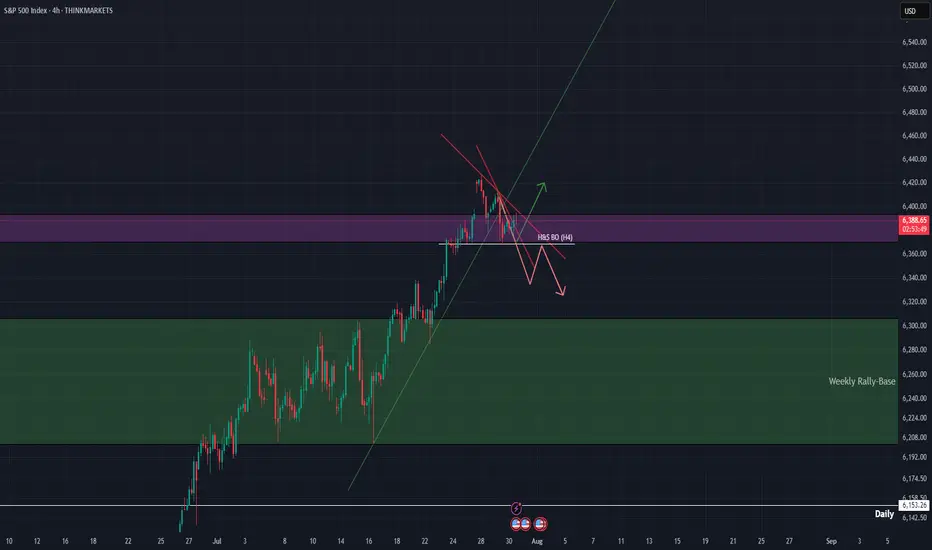
SPX500 AnalysisThis analysis is based on the 4-Hour timeframe, reversal trading, and trend formation.
If the price breaks below the white line (H&S breakout point) and closes, then my H&S pattern is complete, and I will short on its retest. I will post updates about this trade soon!

SPX500 Buy analysis/ideaThis trade is based on the 4-hour chart and executed using reversal trading, trend formation and an update on the analysis I posted on this instrument yesterday.
Complete explanation in the video!

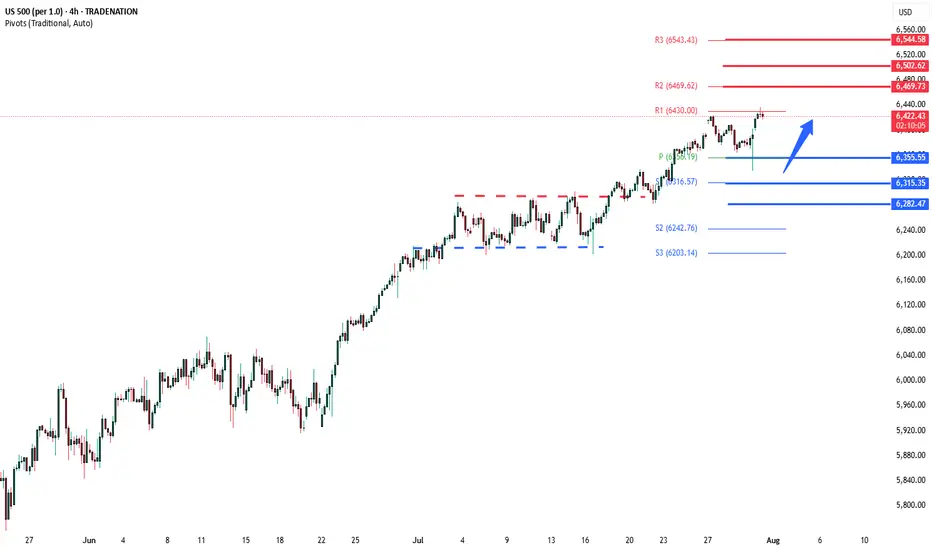
S&P500 uptrend pause supported at 6355The S&P 500 slipped -0.12% after initially rising +0.3%, as Fed Chair Powell’s cautious “wait-and-see” stance on rate cuts dampened sentiment. The metals and mining sector dragged the index lower, falling nearly -4% after the U.S. announced surprise copper tariff details—excluding refined metal until 2027—leading to a sharp -20% drop in COMEX copper futures.
However, market sentiment rebounded overnight, driven by strong tech earnings. Meta surged +11.5% post-market on upbeat Q3 guidance and rising AI-driven ad revenues, while Microsoft rose over +8% thanks to better-than-expected Azure cloud growth and a $30 billion AI infrastructure investment.
Conclusion:
Despite short-term pressure from the Fed’s tone and commodity weakness, strong AI-driven earnings from major tech firms are likely to support a positive bias for the S&P 500 in the near term, especially in the tech-heavy growth segments. Broader gains may depend on upcoming inflation data and Fed clarity.
Key Support and Resistance Levels
Resistance Level 1: 6470
Resistance Level 2: 6500
Resistance Level 3: 6545
Support Level 1: 6355
Support Level 2: 6315
Support Level 3: 6282
This communication is for informational purposes only and should not be viewed as any form of recommendation as to a particular course of action or as investment advice. It is not intended as an offer or solicitation for the purchase or sale of any financial instrument or as an official confirmation of any transaction. Opinions, estimates and assumptions expressed herein are made as of the date of this communication and are subject to change without notice. This communication has been prepared based upon information, including market prices, data and other information, believed to be reliable; however, Trade Nation does not warrant its completeness or accuracy. All market prices and market data contained in or attached to this communication are indicative and subject to change without notice.
SPX ShortElite Analysis
Trade took previous high.
Market gave me a 30m BOS
Identified internal LP
Received confirmation on the 10m and 1m.
Executed off the 1m.
Targets lower LP's
S&P500 (CASH500) SHORT - Double top H6Risk/reward = 3.7
Entry price = 6432.6
Stop loss price = 6 454.1
Take profit level 1 (50%) = 6367.7
Take profit level 2 (50%) = 6332.6
Still need confirmation from some variables before entering the trade
SPX500USD | Retesting All-Time HighsThe index has extended its bullish rally, printing a new local high at 6,286.5 before showing signs of slight hesitation with consecutive small-bodied candles.
Support at: 6,134.5 / 6,026.0 / 5,926.2 🔽
Resistance at: 6,286.5 🔼
🔎 Bias:
🔼 Bullish: Sustains above 6,134.5 and breaks 6,286.5 for new highs.
🔽 Bearish: Break below 6,134.5 could trigger a retracement toward 6,026.0.
📛 Disclaimer: This is not financial advice. Trade at your own risk.

SPY back in the trendlineFrom a technical stand point, the expectation was that the trend line will be respected and sellers will force price to close back inside.
Today's daily close can ignite further downward movement which can align with August seasonality that typically sees Indices pull back within this period.
Target still remains 6108 at previous ATH

SPX500 AnalysisThis analysis is based on the 4-hour timeframe, reversal trading, and trend formation. I've posted a video explaining what I think is probable to happen and why.
Nasdaq and S&P 500 higher than ever. Crash incoming??The stock market is now more expensive than ever.
Some people are calling the top, saying that the market is overbought and too high.
There are indicators that show that the market is overheated, but NO ONE KNOWS whether it's going to crash next week or continue running up for months.
Since April, Nasdaq has gained 40%, which is a lot. Congrats if you bought some QLD and TQQQ back in April when I posted about it.
SP:SPX : All-time high. NASDAQ:NDX : All-time high. BITSTAMP:BTCUSD : All-time high. TVC:GOLD : All-time high HOME PRICES ( ECONOMICS:USSFHP ): All-time high. Sounds a bit like a bubble.
The S&P 500’s market cap now equals 28x real disposable personal income — a record.
The stock market Shiller PE ratio is at its highest in 20 years.
Nasdaq companies, especially the MAG7, are strongly outperforming small-cap companies. The last time this happened at this speed, we had the dot-com crash.
The top 10 stocks in the S&P 500 account for 40% of the index.
So, saying this, is the market going to crash?
I don't know, but I know that it's more likely to crash now than it was 3 months ago. It might continue running higher, too, as the FED is expected to cut rates. Really, no one knows. 😊
Here's what I'm doing:
I trimmed down some overpriced stocks from my portfolio: Lemonade, Coupang, Shopify, and Crowdstrike
I trimmed down some of my crypto, especially Bitcoin and Ethereum
I stopped DCA'ing into leveraged ETFs
I'm accumulating cash
I'm still investing (added more healthcare stocks to the portfolio)
Quick note: I'm just sharing my journey - not financial advice! 😊
