WTICOUSD - BULLISH
Typical Wycoff
Break Re-Test
Slight Tap of FV Gap
Bullish Engulfing Candle
Usually signifies "In a Hurry".
Best Analysis i think was Perplexity Ai
Bullish Case for Oil
US Jobs Data: Stronger-than-expected US jobs numbers have pushed prices higher, with algos covering short bets
Geopolitical Risks: Ongoing tensions in Ukraine and Iran, plus Canadian wildfires, are supporting prices due to potential supply disruptions
OPEC+ Supply Increase Smaller Than Feared: OPEC+ is raising output, but by less than the market expected, which has helped limit downside pressure and even sparked price gains
Recent Price Action: Oil has rebounded to around $64–$65 (Brent) after several weeks of losses, suggesting some stabilization and potential for a technical bounce
Deep Ai
Probability of bullish continuation: 75/100
Technical s indicate a relatively high likelihood that the current bullish trend will continue toward the identified resistance zone above, provided no major fundamental shifts occur. However, caution remains due to potential pullbacks or consolidation near resistance levels.
This is the safest place to enter usually
Cost average in not stops they suck !
imho
Lets See : )
.
SPOTCRUDE trade ideas

USOILThe correlation between USOIL (WTI crude oil prices) and DXY (US Dollar Index) has historically been inverse, but structural shifts in global energy markets and economic dynamics are altering this relationship.
Oil is globally traded in USD. A stronger dollar makes oil more expensive for buyers using other currencies, potentially dampening demand and lowering oil prices. Conversely, a weaker dollar makes oil cheaper, boosting demand and prices.
Trade Balance Impact:
Historically, the U.S. was a net oil importer. Rising oil prices worsened its trade deficit, weakening the dollar. This reinforced the inverse correlation.
Recent Structural Shifts
U.S. as a Net Oil Exporter:
Since becoming the world’s largest crude oil producer (surpassing Saudi Arabia and Russia), higher oil prices now improve the U.S. trade balance by boosting export revenue. This has weakened the traditional inverse relationship
Geopolitical risks: Oil supply fears and safe-haven dollar demand can push both higher.
Federal Reserve Policy:
Hawkish monetary policies that strengthen the dollar can suppress oil prices, but if paired with strong U.S. growth (supporting oil demand), the correlation may turn neutral or positive.
Positive correlations may persist during risk-off events or U.S.-centric demand surges.
Inverse correlations likely resurface if global growth slows or the Fed pivots dovish.
The U.S. dollar may increasingly behave like a "petrocurrency," strengthening with oil prices as exports grow.
#usoil

USOIL: Strong Bullish Sentiment! Long!
My dear friends,
Today we will analyse USOIL together☺️
The recent price action suggests a shift in mid-term momentum. A break above the current local range around 64.706 will confirm the new direction upwards with the target being the next key level of 65.295. and a reconvened placement of a stop-loss beyond the range.
❤️Sending you lots of Love and Hugs❤️

OIL PRICE MAY RISE!!I anticipate oil price to rise after the resistance level of $64 got broken. technically i expect a rise in price further to $64
Therefore, a buy opportunity is envisaged
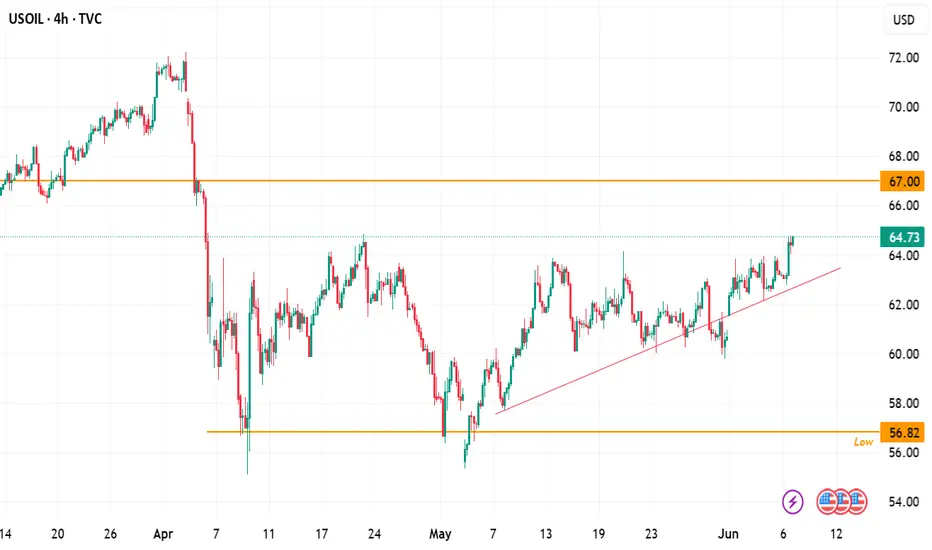
USOIL: Short Signal Explained
USOIL
- Classic bearish pattern
- Our team expects retracement
SUGGESTED TRADE:
Swing Trade
Sell USOIL
Entry - 64.73
Stop - 66.13
Take - 62.38
Our Risk - 1%
Start protection of your profits from lower levels
Disclosure: I am part of Trade Nation's Influencer program and receive a monthly fee for using their TradingView charts in my analysis.
❤️ Please, support our work with like & comment! ❤️

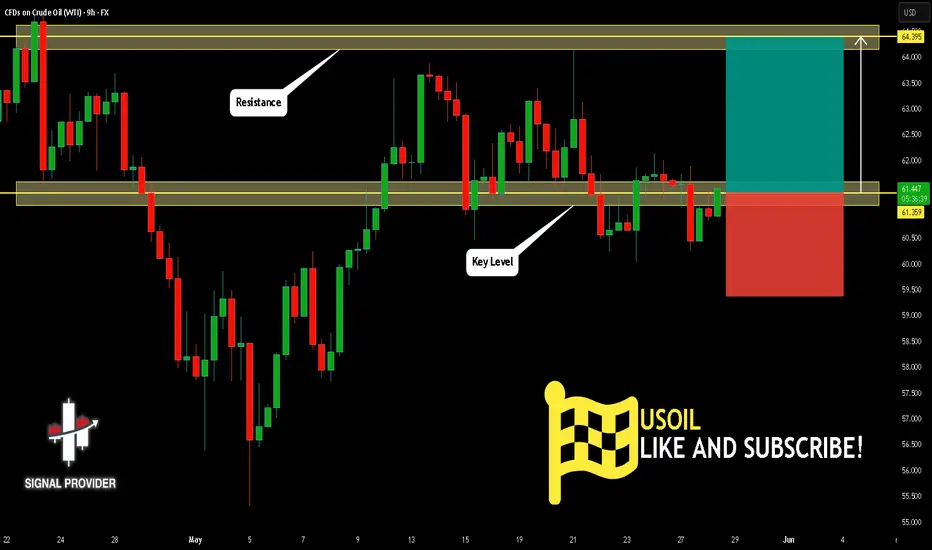
USOIL Will Go Up! Long!
Here is our detailed technical review for USOIL.
Time Frame: 9h
Current Trend: Bullish
Sentiment: Oversold (based on 7-period RSI)
Forecast: Bullish
The market is approaching a significant support area 61.359.
The underlined horizontal cluster clearly indicates a highly probable bullish movement with target 64.395 level.
P.S
We determine oversold/overbought condition with RSI indicator.
When it drops below 30 - the market is considered to be oversold.
When it bounces above 70 - the market is considered to be overbought.
Disclosure: I am part of Trade Nation's Influencer program and receive a monthly fee for using their TradingView charts in my analysis.
Like and subscribe and comment my ideas if you enjoy them!
USOIL Will Go Higher From Support! Buy!
Take a look at our analysis for USOIL.
Time Frame: 9h
Current Trend: Bullish
Sentiment: Oversold (based on 7-period RSI)
Forecast: Bullish
The market is testing a major horizontal structure 60.773.
Taking into consideration the structure & trend analysis, I believe that the market will reach 64.119 level soon.
P.S
Overbought describes a period of time where there has been a significant and consistent upward move in price over a period of time without much pullback.
Disclosure: I am part of Trade Nation's Influencer program and receive a monthly fee for using their TradingView charts in my analysis.
Like and subscribe and comment my ideas if you enjoy them!

USOIL SHORT FROM RESISTANCE
USOIL SIGNAL
Trade Direction: short
Entry Level: 64.71
Target Level: 56.98
Stop Loss: 69.85
RISK PROFILE
Risk level: medium
Suggested risk: 1%
Timeframe: 1D
Disclosure: I am part of Trade Nation's Influencer program and receive a monthly fee for using their TradingView charts in my analysis.
✅LIKE AND COMMENT MY IDEAS✅

Crude oil pullback bullish trend
💡Message Strategy
Saudi price cuts and OPEC+ supply adjustments affect market sentiment
Crude oil came under pressure in the middle of the week after Saudi Arabia cut its July sales price to Asia to the lowest level in nearly two months. This follows OPEC+'s decision to increase production by 411,000 barrels per day in July, indicating that major oil producers are still prioritizing market share even amid volatile demand signals. This coordinated move by Saudi Arabia and Russia is seen as an attempt to constrain overproducers and strengthen control over global supply dynamics.
Refineries drive crude stock draw, but fuel demand lacks
Weekly data from the U.S. Energy Information Administration (EIA) delivered mixed messages. U.S. crude stockpiles fell by 4.3 million barrels to 436.1 million barrels, driven by a sharp increase in refinery runs, exceeding expectations. Utilization rose to 93.4%, indicating that refineries are preparing for a seasonal peak in demand. Adding to the bullish signal from the crude stock draw.
📊Technical aspects
On the technical side, the daily chart of WTI crude oil shows that oil prices have been under pressure for three consecutive trading days and are currently trading above the 20-day and 50-day moving averages, reflecting the dominance of short-term bullish sentiment. The MACD indicator shows a dead cross and the momentum column is enlarged, indicating that the upward trend is still continuing.
In the previous post, we have pointed out that the upward target and trend of crude oil have been reached. The main theme of crude oil in the future will still be a bullish correction.
💰 Strategy Package
Long Position: 62.50-63.00

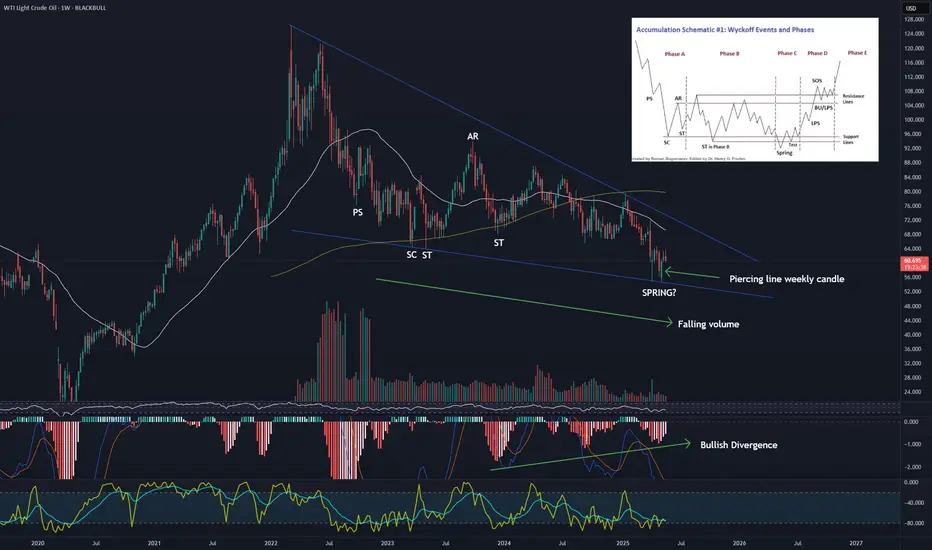
Textbook Falling Wedge & Wyckoff Accumulation Brewing?Analysis:
Looking at the daily chart for Crude Oil, we appear to be seeing a very compelling confluence of bullish technical signals that suggest a potential significant reversal to the upside.
Textbook Falling Wedge Formation:
Price action is clearly consolidating within a well-defined falling wedge pattern.
We have observed multiple clear touches (3+ on the upper, 4+ on the lower trendline), indicating these boundaries are highly respected by the market.
Crucially, volume has been declining as price consolidates within the wedge, a classic characteristic signifying diminishing selling pressure.
The angles of convergence also appear ideal, with the upper trendline being steeper than the lower.
Wyckoff Accumulation Schematic #1 in Play?
Diving deeper, the internal structure of this falling wedge strongly resembles Wyckoff's Accumulation Schematic #1.
We can identify potential phases:
PS (Preliminary Support): Early signs of buying.
SC (Selling Climax): A sharp sell-off often with high volume, marking potential capitulation.
AR (Automatic Rally): The first significant bounce after the SC.
ST (Secondary Test): Retesting the lows of the SC.
Spring: A key event where price dips below the established trading range support (or the wedge's lower trendline) only to quickly reverse back above it, effectively trapping sellers and confirming a shakeout of weak hands.
This internal Wyckoff structure within the falling wedge significantly strengthens the case for institutional accumulation taking place.
Bullish Candlestick & Oscillator Confluence:
At the recent lows, we observed a potential Piercing Line bullish reversal candlestick pattern forming right at the lower trendline of the wedge. This indicates aggressive buying stepping in.
The MACD indicator has confirmed this bullish shift, showing a recent bullish crossover (MACD line above Signal line) and a flip of the histogram from red to green.
Furthermore, there appears to be a bullish divergence on the MACD – as price made lower lows within the wedge, the MACD indicator made higher lows (or showed increasing bullish momentum), suggesting underlying bearish momentum is weakening significantly.
Market Sentiment & Potential Implications:
It's noteworthy that this bullish technical setup is occurring amidst increased bearish media and Twitter sentiment surrounding oil. From a contrarian perspective, extreme bearish sentiment often coincides with market bottoms, as "smart money" accumulates positions while the crowd is most pessimistic. This situation could set the stage for a strong reversal, potentially fueled by short covering.
Conclusion:
All signs from price action, volume, candlestick patterns, and oscillators point towards a high probability of a bullish reversal and an upside breakout from this well-formed falling wedge. The potential Wyckoff accumulation pattern adds significant weight to the idea that sophisticated players are positioning for a significant move higher.
What to Watch For:
The next critical step is a decisive breakout above the upper trendline of the falling wedge, ideally accompanied by a significant surge in buying volume. This would confirm the pattern's completion and signal the potential start of a new uptrend. A more aggressive approach is entering now and capturing more upside if it is to occur.
This is for educational purposes only and not financial advice. Always conduct your own research and manage your risk.
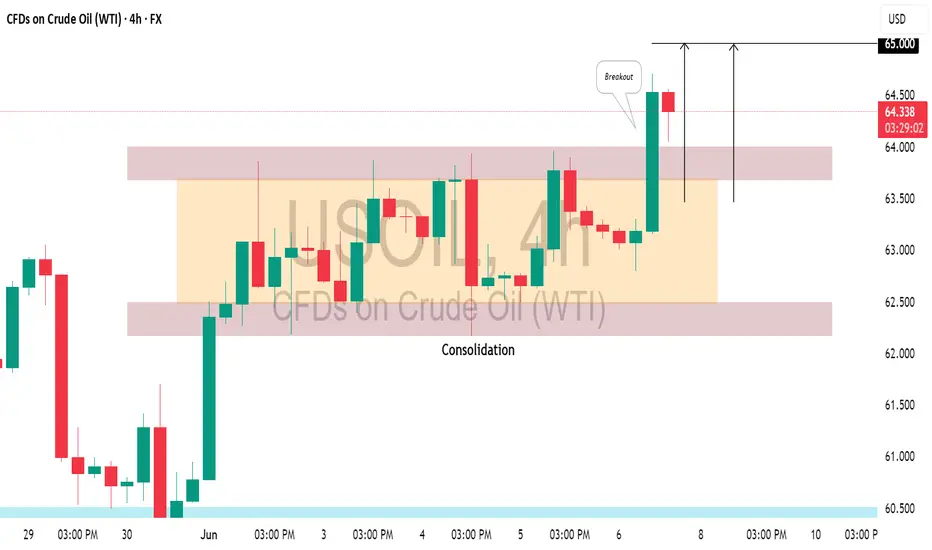
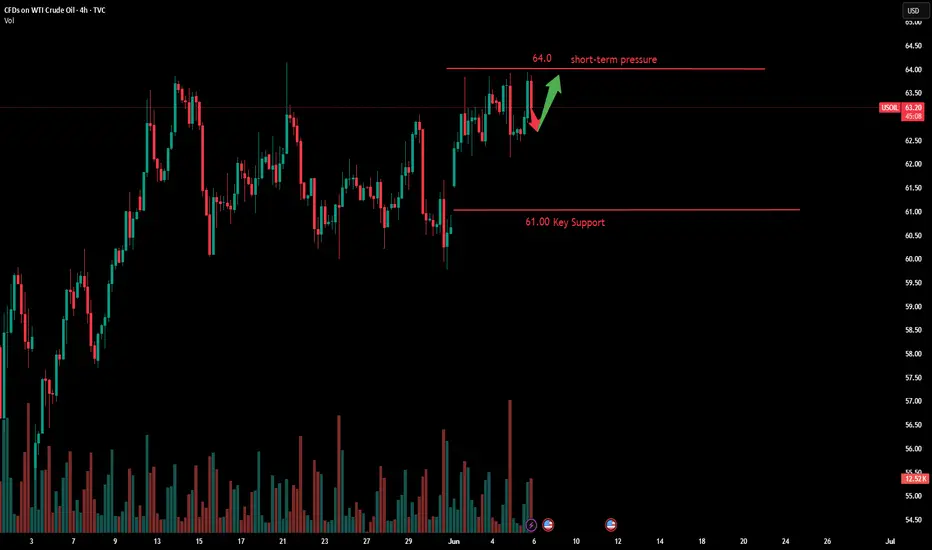
US CRUDE OIL(#WTI) : Bullish Trend Continues📈USOIL is trading in a bullish trend on a 4H time frame.
After a prolonged upward movement, it started to consolidated within a horizontal range for a while.
Recently, the resistance of this range was breached, indicating strong buyer momentum.
I believe the upward movement may persist, potentially leading the market to reach the 65.00 level soon.
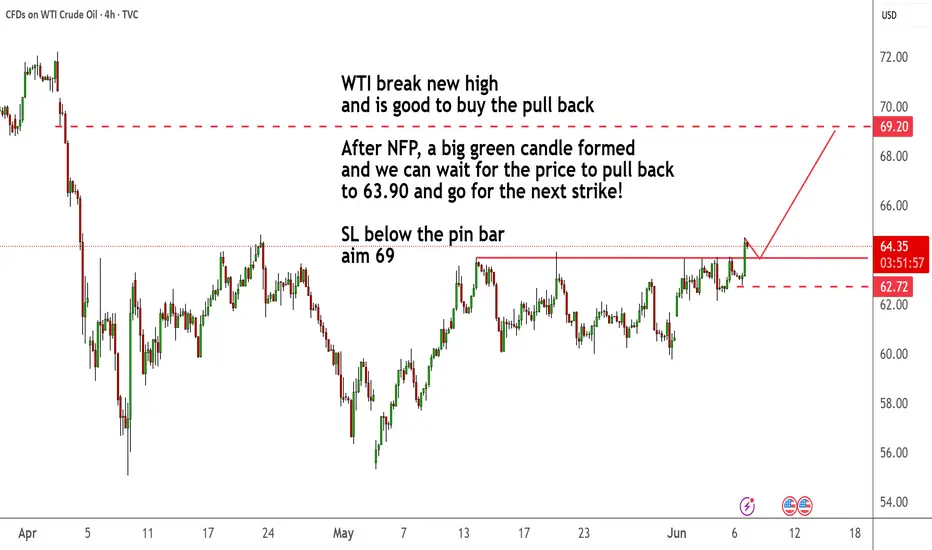
WTI break new high and is good to buy the pull backWTI break new high
and is good to buy the pull back
After NFP, a big green candle formed
and we can wait for the price to pull back
to 63.90 and go for the next strike!
SL below the pin bar
aim 69
USOIL:The strategy of going short
USOIL: Same thinking, still maintain the short strategy. Friends with short orders at 63.3-63.5 continue to wait, can increase short orders near 63.8, the target is 62.5-62.3 unchanged
↓↓↓ More detailed strategies and trading will be notified here ↗↗↗
↓↓↓ Keep updated, come to "get" ↗↗↗

Crude Oil (WTI) Daily Chart AnalysisCrude Oil (WTI) Daily Chart Analysis
Pattern Formed:
A Symmetrical Triangle formation is clearly visible.
Context:
The prior trend leading into the triangle was bearish.
Typically, in technical analysis, a triangle after a downtrend is considered a continuation pattern — meaning there is a higher probability that the price will break downward.
The triangle appears to have completed its 5-wave internal structure (ABCDE), a classical behavior of contracting triangles.
Breakout Expectation:
After a completed 5-wave triangle, a breakout is imminent.
Directional Bias: Since this triangle is forming after a strong downtrend, the higher probability is for a bearish breakout.
However, triangles can break either way, and when they do, the move is often impulsive.
Potential Scenarios:
Bearish Breakdown (High Probability):
A downside break would likely trigger a sharp fall.
Immediate support levels to watch post-breakout:
$60.00
$56.50
$46.75 (measured move — target derived from the height of the triangle projected downward)
Bullish Breakout (Low Probability but Possible):
In case of an upside breakout, resistance zones are:
$72.00 (supply zone + previous highs)
$78.00
Upside could see sharp momentum but is less likely unless there is strong fundamental support (e.g., geopolitical tensions, production cuts).
Volume Confirmation:
Volume typically contracts during triangle formation. Post-breakout, volume expansion is essential to confirm the breakout direction.
Indicators (Suggested Additional Confirmations):
Watch for RSI — if divergence forms, could signal weakness.
Monitor MACD for crossovers at breakout zones.
Summary
Triangle Completed: 5-wave structure inside the triangle — ready for breakout.
Bias: Bearish continuation pattern — higher probability of a downward move.
Trigger: Breakout of the triangle boundary with volume expansion will confirm the next move.
Targets (Post-Breakout):
Downside: $60 ➔ $56.5 ➔ $46.75
Upside (less probable): $72 ➔ $78
⚠️ Disclaimer:
This analysis is based purely on technical chart patterns and historical price action. Trading and investing involve substantial risk. Always perform your own due diligence or consult a financial advisor.

OIL short termAfter yesterday rally today price must back down to first target 61.8-62 then to 61 and maybe we go lower to close GAP.

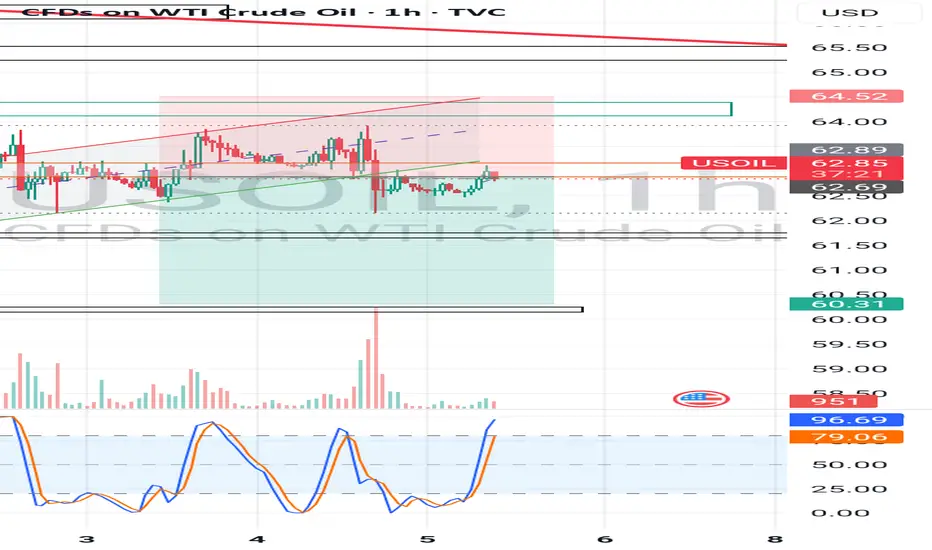
Could the price bounce from here?WTI Oil (WTI/USD) is falling towards the pivot, which has been identified as an overlap support and could bounce to the 1st resistance, which is a pullback resistance.
Pivot: 62.36
1st Support: 61.81
1st Resistance: 63.24
Risk Warning:
Trading Forex and CFDs carries a high level of risk to your capital and you should only trade with money you can afford to lose. Trading Forex and CFDs may not be suitable for all investors, so please ensure that you fully understand the risks involved and seek independent advice if necessary.
Disclaimer:
The above opinions given constitute general market commentary, and do not constitute the opinion or advice of IC Markets or any form of personal or investment advice.
Any opinions, news, research, analyses, prices, other information, or links to third-party sites contained on this website are provided on an "as-is" basis, are intended only to be informative, is not an advice nor a recommendation, nor research, or a record of our trading prices, or an offer of, or solicitation for a transaction in any financial instrument and thus should not be treated as such. The information provided does not involve any specific investment objectives, financial situation and needs of any specific person who may receive it. Please be aware, that past performance is not a reliable indicator of future performance and/or results. Past Performance or Forward-looking scenarios based upon the reasonable beliefs of the third-party provider are not a guarantee of future performance. Actual results may differ materially from those anticipated in forward-looking or past performance statements. IC Markets makes no representation or warranty and assumes no liability as to the accuracy or completeness of the information provided, nor any loss arising from any investment based on a recommendation, forecast or any information supplied by any third-party.

WTI CRUDE OIL: Going for a LH rejection. Sell signal.WTI Crude Oil is practically neutral on its 1D technical outlook (RSI = 55.991, MACD = 0.160, ADX = 24.748) as it's on the 3rd straight day of flat consolidation on the 1D MA50. The last time it did this was on April 2nd, which resulted in a LH rejection to the S1 level. As the presence of the R1 level (64.90) is just above, we expect the market to get rejected and aim for the S1 again (TP = 56.00).
## If you like our free content follow our profile to get more daily ideas. ##
## Comments and likes are greatly appreciated. ##

Crude Oil is Building Momentum for a BreakoutDuring the U.S. trading session on Thursday, international oil prices fluctuated higher, with U.S. crude oil currently trading near $63.55 per barrel. Despite the intraday volatility, international oil prices remain under downward pressure, primarily influenced by two key factors.
First, data from the U.S. Energy Information Administration (EIA) showed that as of last week, U.S. gasoline and distillate inventories increased more than expected, signaling weakening refined product demand in the world’s largest economy. This development has sparked investor concerns about whether the U.S. summer driving season can sustain demand growth, leading to a ~1% decline in oil prices on Wednesday.
The current crude oil market is caught between supply and demand headwinds:
Supply-side pressures: OPEC+’s production increase plan and Saudi Arabia’s strategic price cuts have created short-term bearish sentiment.
Demand-side uncertainties: The unexpected rise in U.S. refined product inventories has amplified market doubts about the vigor of global consumption recovery.
Additionally, the escalation of international trade frictions has further dampened risk appetite, exacerbating downward pressure on prices.
In the short term, oil prices are likely to continue oscillating within the $60–$65 per barrel range. Market participants should closely monitor U.S. macroeconomic data and OPEC+’s compliance with its production policies for directional cues.
Humans need to breathe, and perfect trading is like breathing—maintaining flexibility without needing to trade every market swing. The secret to profitable trading lies in implementing simple rules: repeating simple tasks consistently and enforcing them strictly over the long term.
Trading Strategy:
buy@61.5-62.0
TP:63.0-63.5
USOIL SELL SIGNAL Entry Point: 62.60USOIL SELL SIGNAL
Entry Point: 62.60
🎯 Target 1: 62.00
🎯 Target 2: 61.00
🎯 Final Target: 60.00
⚠️ Risk Management Matters!
– Always set a stop-loss
– Never risk more than 1–2% per trade
– Stick to your strategy, not emotions
📊 Technical Outlook:
– Resistance zone near 62.60
– Bearish pressure increasing
– Potential trend reversal forming
✅ Lock profits step by step
✅ Use trailing stops when in profit
✅ Avoid overtrading or revenge trading
📌 Stay consistent and patient
📌 The goal is longevity, not luck
📌 Trust your analysis – not the noise
📢 For educational purposes only – trade responsibly!

USOIL:Go short first today
USOIL: Crude oil downward momentum gradually stronger, the day's trend is weak, trading ideas first short.
Trading Strategy:
SELL@63.3-63.5
TP: 62.5-62.3
↓↓↓ More detailed strategies and trading will be notified here ↗↗↗
↓↓↓ Keep updated, come to "get" ↗↗↗

US OIL SHORT POSITION Oil price is currently in a Bearish trend, especially after it got rejected thrice from the supply zone, Also left a Gap over the weekend close and open which is another confluence for me taking the short is.
So let's see how it Goes.💪
US OIL LONG POSITION RESULT Oil had now formed a triple bottom pattern, and also holding the minor Support Trendline indicating signs for bullisd potential.
Price action did move in our direction, just couldn't break above the orange resistance zone, and then reversed and went straight down to our Sl (my bad though, Should've moved sl to entry price to make it safe).
Better Luck and TA next time.

USOIL Will Grow! Buy!
Take a look at our analysis for USOIL.
Time Frame: 1D
Current Trend: Bullish
Sentiment: Oversold (based on 7-period RSI)
Forecast: Bullish
The market is testing a major horizontal structure 62.890.
Taking into consideration the structure & trend analysis, I believe that the market will reach 68.865 level soon.
P.S
The term oversold refers to a condition where an asset has traded lower in price and has the potential for a price bounce.
Overbought refers to market scenarios where the instrument is traded considerably higher than its fair value. Overvaluation is caused by market sentiments when there is positive news.
Disclosure: I am part of Trade Nation's Influencer program and receive a monthly fee for using their TradingView charts in my analysis.
Like and subscribe and comment my ideas if you enjoy them!
