USOIL: Local Bearish Bias! Short!
My dear friends,
Today we will analyse USOIL together☺️
The recent price action suggests a shift in mid-term momentum. A break below the current local range around 66.47 will confirm the new direction downwards with the target being the next key level of 66.19.and a reconvened placement of a stop-loss beyond the range.
❤️Sending you lots of Love and Hugs❤️
SPOTCRUDE trade ideas

WTI Oil H4 | Potential bearish reversalWTI oil (USOIL) could rise towards a pullback resistance and potentially reverse off this level to drop lower.
Sell entry is at 68.28 which is a pullback resistance.
Stop loss is at 70.90 which is a level that sits above the 50% Fibonacci retracement and a pullback resistance.
Take profit is at 63.86 which is a pullback support that aligns closely with the 161.8% Fibonacci extension.
High Risk Investment Warning
Trading Forex/CFDs on margin carries a high level of risk and may not be suitable for all investors. Leverage can work against you.
Stratos Markets Limited (tradu.com ):
CFDs are complex instruments and come with a high risk of losing money rapidly due to leverage. 63% of retail investor accounts lose money when trading CFDs with this provider. You should consider whether you understand how CFDs work and whether you can afford to take the high risk of losing your money.
Stratos Europe Ltd (tradu.com ):
CFDs are complex instruments and come with a high risk of losing money rapidly due to leverage. 63% of retail investor accounts lose money when trading CFDs with this provider. You should consider whether you understand how CFDs work and whether you can afford to take the high risk of losing your money.
Stratos Global LLC (tradu.com ):
Losses can exceed deposits.
Please be advised that the information presented on TradingView is provided to Tradu (‘Company’, ‘we’) by a third-party provider (‘TFA Global Pte Ltd’). Please be reminded that you are solely responsible for the trading decisions on your account. There is a very high degree of risk involved in trading. Any information and/or content is intended entirely for research, educational and informational purposes only and does not constitute investment or consultation advice or investment strategy. The information is not tailored to the investment needs of any specific person and therefore does not involve a consideration of any of the investment objectives, financial situation or needs of any viewer that may receive it. Kindly also note that past performance is not a reliable indicator of future results. Actual results may differ materially from those anticipated in forward-looking or past performance statements. We assume no liability as to the accuracy or completeness of any of the information and/or content provided herein and the Company cannot be held responsible for any omission, mistake nor for any loss or damage including without limitation to any loss of profit which may arise from reliance on any information supplied by TFA Global Pte Ltd.
The speaker(s) is neither an employee, agent nor representative of Tradu and is therefore acting independently. The opinions given are their own, constitute general market commentary, and do not constitute the opinion or advice of Tradu or any form of personal or investment advice. Tradu neither endorses nor guarantees offerings of third-party speakers, nor is Tradu responsible for the content, veracity or opinions of third-party speakers, presenters or participants.

WTI CRUDE OIL (USOIL): More Growth Ahead
Crude Oil broke and closed above a significant resistance.
The price is now retesting that.
I think that the market is going to rise.
Next resistance - 68.5
❤️Please, support my work with like, thank you!❤️

WTI Crude Oil sideways consolidation support at 6460Crude oil prices remain under pressure as easing geopolitical tensions between Iran and Israel reduce fears of supply disruptions in the Middle East. Adding to the bearish tone, the anticipated output increase by OPEC+—expected to raise August production by 411,000 bpd—acts as a supply-side headwind. Meanwhile, a modest rebound in the US Dollar from multi-year lows also weighs on oil demand, given its inverse relationship with USD-denominated commodities.
However, expectations that the Federal Reserve may soon resume rate cuts could limit USD upside, offering some support to oil prices. Traders are likely to stay cautious ahead of key US economic data, including Wednesday’s ADP report and Thursday’s Nonfarm Payrolls, which will shape Fed policy expectations. Additionally, the latest EIA stockpile data will be closely watched for immediate supply signals.
Conclusion:
WTI Crude Oil is likely to trade with a neutral-to-bearish bias in the near term, pressured by rising supply and a firmer dollar. However, Fed rate cut expectations and upcoming US labor and inventory data may help cushion the downside. Traders may remain on the sidelines until clearer direction emerges post-NFP and OPEC+ decisions.
Key Support and Resistance Levels
Resistance Level 1: 6925
Resistance Level 2: 7080
Resistance Level 3: 7230
Support Level 1: 6460
Support Level 2: 6300
Support Level 3: 6100
This communication is for informational purposes only and should not be viewed as any form of recommendation as to a particular course of action or as investment advice. It is not intended as an offer or solicitation for the purchase or sale of any financial instrument or as an official confirmation of any transaction. Opinions, estimates and assumptions expressed herein are made as of the date of this communication and are subject to change without notice. This communication has been prepared based upon information, including market prices, data and other information, believed to be reliable; however, Trade Nation does not warrant its completeness or accuracy. All market prices and market data contained in or attached to this communication are indicative and subject to change without notice.

# USOIL - $40 Move? Something Major is coming?Date: 25-06-2025
#USOIL Current Price: $65.45
Pivot Point: 70.57 Support: 63.71 Resistance: 77.49
#USOIL Upside Targets:
Target 1: 87.10
Target 2: 96.71
Target 3: 106.51
Target 4: 116.31
#USOIL Downside Targets:
Target 1: 54.07
Target 2: 44.43
Target 3: 34.62
Target 4: 24.82

USOILThe first higher high after a downtrend indicates a potential trend reversal to the upside. It shows that buyers are starting to regain control, signaling the possibility of a new bullish trend.
Trendline Break: A break above a significant trendline further confirms the shift in sentiment from bearish to bullish. The trendline break signifies that selling pressure has weakened, and the market is poised for further upward movement.
Retest of Trendline: After breaking the trendline, the price often retests the broken trendline, which now acts as support. This retest offers a low-risk buying opportunity as it confirms the strength of the new uptrend.

WTI will most likely fall to 55.There will be a lot of oil on the market in next few weeks. Im expecting a sharp fall on WTI after this consolidation and the most likely level which can hold is 55 weekly level. All lines represents target levels. If you decided to trade this idea, TP partially, use proper sizing. Wish you good luck.

USOIL The Target Is UP! BUY!
My dear friends,
USOIL looks like it will make a good move, and here are the details:
The market is trading on 65.03 pivot level.
Bias - Bullish
Technical Indicators: Supper Trend generates a clear long) signal while Pivot Point HL is currently determining the overall Bullish trend of the market.
Goal - 68.89
Recommended Stop Loss - 63.01
About Used Indicators:
Pivot points are a great way to identify areas of support and resistance, but they work best when combined with other kinds of technical analysis
Disclosure: I am part of Trade Nation's Influencer program and receive a monthly fee for using their TradingView charts in my analysis.
———————————
WISH YOU ALL LUCK

Analysis of Crude Oil's Opening Market Strategy on MondayWTI crude oil futures stabilized for the second consecutive day, maintaining fluctuations within the broad range of Tuesday and oscillating around the key level of $65.12. A sustained break below this level would confirm the resurgence of selling pressure, and a breach of $64.00 could trigger a decline toward $61.90. On the upside, if the price holds above $65.12, it may drive a short-term rebound to $67.44, and if momentum strengthens, it could further test $71.20.
Crude oil prices remain range-bound, but downward pressure is building. Robust U.S. demand provides support, yet macroeconomic caution and uncertainties over OPEC+ intentions are suppressing market sentiment. A decisive break below $65.12 would confirm the bearish trend, with bears targeting $61.90. Conversely, if this level holds, neutral-to-bullish logic remains valid, though upside potential remains constrained unless supply-demand signals converge overall.
you are currently struggling with losses,or are unsure which of the numerous trading strategies to follow,You have the option to join our VIP program. I will assist you and provide you with accurate trading signals, enabling you to navigate the financial markets with greater confidence and potentially achieve optimal trading results.
Trading Strategy:
buy@63.1-63.3
TP:66.3-69.9

Bullish Setup Forms as Institutions Accumulate CrudeCrude Oil is consolidating above support at $65.18, with momentum indicators turning bullish. The Stochastic is rising from 27, and RSI is approaching the 50.0 mark. Institutional buying reported in the latest COT data reinforces the bullish bias.
A move above $67.55 could open the door to $69.45, while the bullish outlook stays intact as long as the price remains above $61.80.

WTI on high time frame
"Hello traders, focusing on WTI crude oil, the price surged to $78 but sharply retreated to the $65 zone. Over the last five days, the price has consolidated. I believe that the signals from the recent 4-hour candle suggest a potential move towards higher prices, with the next target possibly being around $72. I will be monitoring the price action around $72 closely for a potential rejection or continuation towards even higher prices."
If you need further assistance or have additional insights to share, feel free to let me know.

Crude oil continues to correct, short-term ideas
💡Message Strategy
WTI crude oil prices recovered from a two-week low but remained about $12 below the previous Monday's high as upside was limited by Middle East peace and expectations that OPEC+ countries will agree to increase supply again this week.
📊Technical aspects
From the daily chart level, crude oil fluctuates upward in the medium term and tests around 75. The K-line closes with a large real negative line, which has not yet destroyed the moving average system and is still supported. The medium-term objective upward trend remains unchanged.
However, from the perspective of momentum, the MACD indicator crosses downward above the zero axis, indicating that the bullish momentum is weakening. It is expected that the medium-term trend of crude oil will fall into a high-level oscillation pattern.
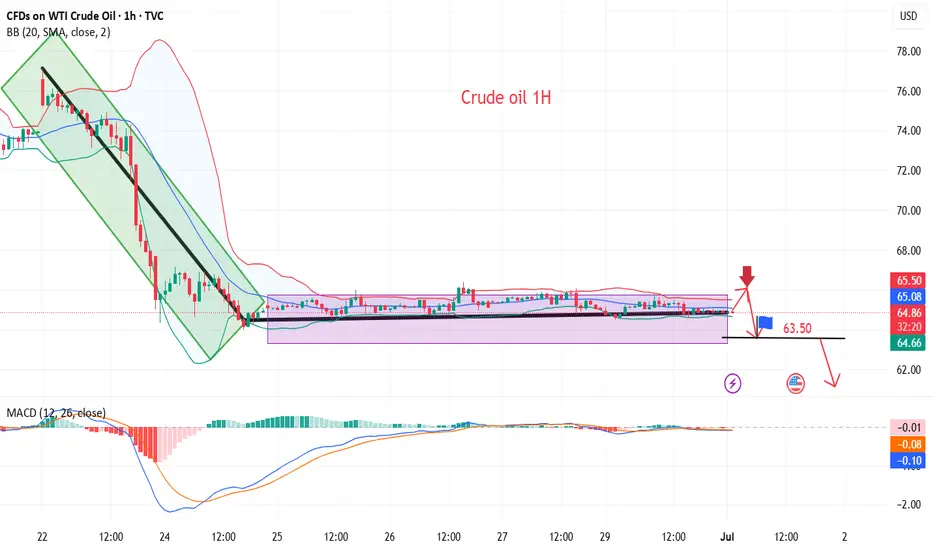
The short-term trend of crude oil (1H) continues to fluctuate in a narrow range, and the oil price falls back to the lower edge of the range. Pay attention to the support strength of 64. In terms of momentum, the MACD indicator is at the zero axis position, and the long and short forces are equal. It is expected that the trend of crude oil will maintain a fluctuating consolidation pattern during the day.
💰Strategy Package
Short Position:65.50-66.50,SL:67.50,Target: 64.00-63.00
OIL IDEA /30 06 25So we are looking for this Short position, but first we need a better Premium position

BUY OPPORTUNITY IN WTI NOW!Price dropped low and currently trade at $65.15 per barrel a buy opportunity is envisaged from the current market price. This is a potential opportunity to capitalize on. Take advantage of it

USOIL: Long Trading Opportunity
USOIL
- Classic bullish pattern
- Our team expects retracement
SUGGESTED TRADE:
Swing Trade
Buy USOIL
Entry - 65.03
Stop - 62.60
Take - 69.73
Our Risk - 1%
Start protection of your profits from lower levels
Disclosure: I am part of Trade Nation's Influencer program and receive a monthly fee for using their TradingView charts in my analysis.
❤️ Please, support our work with like & comment! ❤️

WTI OIL Progressively bearish on the long-term. Eyes $52.50.A week has passed since our sell signal on WTI Oil (USOIL) and the emerging geopolitical stability has already helped the price move much faster towards our $58.20 Target (see chart in related ideas below).
If we look at it from an even longer term perspective, the 1W time-frame in particular, we can see draw some very useful conclusions about the bearish case. First of all that this week's High got rejected exactly on the 1W MA200 (orange trend-line), which is the trend-line that made the last 3 major rejections on the market (January 13 2025, October 07 2024).
As you can see, that was a textbook Double Top formation. The last Double Top rejection took place on June 06 2022, the previous multi-year Top for the market. The result was a continued sell-off that didn't stop before testing the 1W MA200, which is now the Resistance.
As a result, even though our $58.20 Target stands, on the longer term we can even see a -37.36% decline towards the end of the year. Contact with the bottom of the Channel Down can be made at $52.50.
Alternatively, you can look at the 1W RSI, which has a clear Sell and clear Buy Zone. This week it was rejected on the Sell Zone, so you may look to book your profit as soon as it enters the Buy Zone.
-------------------------------------------------------------------------------
** Please LIKE 👍, FOLLOW ✅, SHARE 🙌 and COMMENT ✍ if you enjoy this idea! Also share your ideas and charts in the comments section below! This is best way to keep it relevant, support us, keep the content here free and allow the idea to reach as many people as possible. **
-------------------------------------------------------------------------------
Disclosure: I am part of Trade Nation's Influencer program and receive a monthly fee for using their TradingView charts in my analysis.
💸💸💸💸💸💸
👇 👇 👇 👇 👇 👇

USOIL LONG FROM SUPPORT
USOIL SIGNAL
Trade Direction: long
Entry Level: 64.84
Target Level: 70.03
Stop Loss: 61.37
RISK PROFILE
Risk level: medium
Suggested risk: 1%
Timeframe: 9h
Disclosure: I am part of Trade Nation's Influencer program and receive a monthly fee for using their TradingView charts in my analysis.
✅LIKE AND COMMENT MY IDEAS✅

Market Analysis: Oil Slides — Traders Eye Macro TriggersMarket Analysis: Oil Slides — Traders Eye Macro Triggers
WTI Crude oil is down over 15% and remains at risk of more losses.
Important Takeaways for WTI Crude Oil Price Analysis Today
- WTI Crude oil extended losses below the $68.00 support zone.
- A major bearish trend line is forming with resistance near $65.60 on the hourly chart of XTI/USD at FXOpen.
Technical Analysis of WTI Crude Oil Price
On the hourly chart of WTI Crude Oil at FXOpen, the price struggled to continue higher above $77.00 against the US Dollar. The price formed a short-term top and started a fresh decline below $72.00.
There was a steady decline below the $70.00 pivot level. The bears even pushed the price below $68.00 and the 50-hour simple moving average. Finally, the price tested the $63.70 zone. The recent swing low was formed near $63.69, and the price is now consolidating losses.
On the upside, immediate resistance is near the $65.60 zone. There is also a major bearish trend line forming with resistance near $65.60. The next resistance is near the $66.80 level or the 23.6% Fib retracement level of the downward move from the $76.93 swing high to the $63.69 low.
The main resistance is $70.30 and the 50% Fib retracement level. A clear move above the $70.30 zone could send the price toward $71.90.
The next key resistance is near $76.90. If the price climbs further higher, it could face resistance near $78.00. Any more gains might send the price toward the $80.00 level.
Immediate support is near the $63.70 level. The next major support on the WTI Crude Oil chart is near $62.00. If there is a downside break, the price might decline toward $60.00. Any more losses may perhaps open the doors for a move toward the $55.00 support zone.
This article represents the opinion of the Companies operating under the FXOpen brand only. It is not to be construed as an offer, solicitation, or recommendation with respect to products and services provided by the Companies operating under the FXOpen brand, nor is it to be considered financial advice.

WTI OIL TRADING IDEA 1 JULY 2025WTI Crude Oil is currently trading around $64.77, following a recent rejection from the $76–78 resistance zone. This area represents a strong supply zone and coincides with the upper boundary of a long-term descending channel, indicating institutional selling pressure. From a Smart Money Concepts (SMC) perspective, this move appears to be a liquidity grab above previous highs, where price tapped into a bearish order block before aggressively reversing. Price action confirms this bearish sentiment, with a visible rejection and bearish engulfing candle suggesting that sellers are defending the region aggressively.
On the supply and demand side, the $76.77–78.30 zone is the immediate supply zone, while the next key resistance above lies between $79.37 and $93.94. On the downside, demand lies at $58.69–64.00, with major demand and liquidity resting around $55.00 and $51.79. Fundamentally, the recent spike in oil prices was largely driven by heightened tensions in the Middle East, particularly renewed conflict concerns between Iran and Israel. However, as no direct disruption to oil supply has occurred, the geopolitical risk premium is now being priced out. Additionally, concerns over global demand, especially from China and Europe, along with a gradual and controlled U.S. Strategic Petroleum Reserve (SPR) refill, are putting downward pressure on prices despite OPEC+ maintaining output cuts.
Based on this analysis, the trade idea favors a bearish swing setup. A short position around $64.00–66.00 could be considered, targeting $58.69 as the first take-profit level, followed by $55.00 and $51.79 for extended targets. The stop loss should be placed just above $78.50 to allow room beyond the supply zone and trendline. This setup offers a risk-reward ratio of approximately 1:3. However, if price breaks and holds above $78.50, it may signal a structural shift toward bullish momentum, likely driven by unexpected geopolitical escalation or a change in OPEC strategy. In such a case, the bias should flip to bullish, with potential targets around $89.00–93.00.

Market next move 🔄 Disruption Analysis: Contrarian View
⚠️ Original Viewpoint Summary:
The original analysis suggests a bearish breakdown from the rising channel, with a short-term target of 64.36, pointing to a move towards the support zone.
---
📉 Disrupted (Contrarian) Perspective:
🔁 Fakeout Scenario Possibility:
The sharp drop below the trendline may be a bear trap.
Price quickly bounced back into the channel region, showing buyer interest near the support.
🔎 Key Observations:
Wick rejection near the lower support suggests that demand is active around 64.50–64.36 zone.
The structure of higher lows is still valid unless there's a confirmed close below the support box.
Momentum indicators (not shown) may help validate whether this is a temporary pullback or a deeper correction.
📈 Alternative Projection:
If price holds above the support zone, it could rebound back to test 65.50–65.80 resistance.
A false breakdown followed by consolidation may lead to retest of the upper channel (near 66.00).
---
🧭 Revised Strategy Suggestion:
Avoid early shorts unless there is a confirmed candle close below 64.36.
Watch for bullish price action near support (hammer, engulfing) for a potential long re-entry.
Reevaluate if WTI forms a base around 64.40 — possible reversal setup.

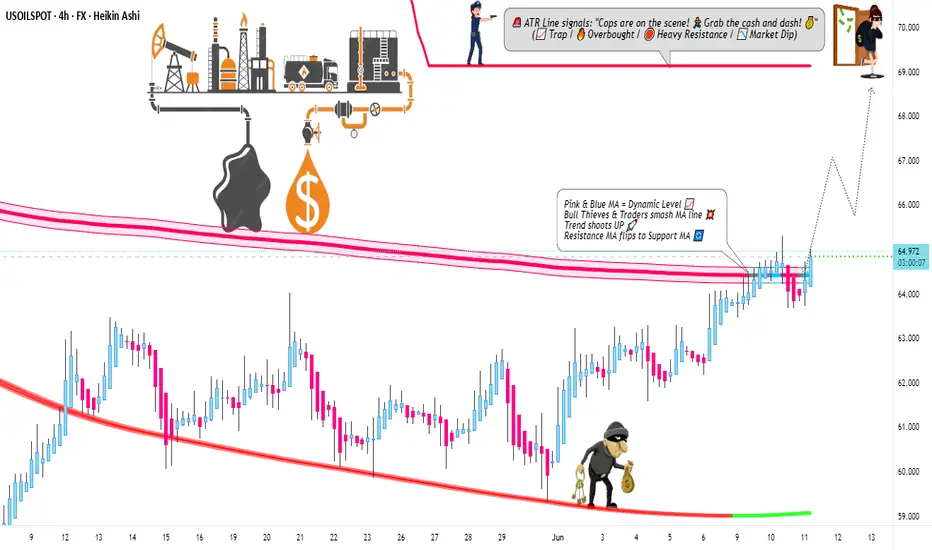
Bulls on the Loose: US Oil Spot/WTI Heist Strategy! 🚨💰 THE OIL VAULT HEIST: US OIL SPOT/WTI TRADING STRATEGY 💸🔫
🌟Hi! Hola! Ola! Bonjour! Hallo! Marhaba!🌟
Dear Money Makers & Robbers 🤑💰💸✈️
Based on our 🔥Thief Trading style analysis🔥 (both technical and fundamental), here’s the master plan to heist the US Oil Spot/WTI Energy Market. Follow the blueprint carefully—this strategy focuses on long entries, with a daring escape planned near the high-risk Red ATR line Zone where bearish robbers and consolidation traps await. 🏆💸 Take your profit and treat yourself, fellow traders—you earned it! 💪🏆🎉
🕵️♂️ Entry 📈
💥 The vault is wide open! Time to swipe that bullish loot—heist is on!
Place buy limit orders within the 15 or 30-minute timeframe, near swing lows/highs for pullback entries.
🛑 Stop Loss 🛑
📍 Thief’s SL—recent swing low and below the moving average (4H timeframe) for day/swing trades.
📍 Adjust SL based on risk, lot size, and number of orders.
🎯 Target
🏴☠️💥 69.000 (Aim for the big loot!) OR escape before the target
🔥 Market Heist Overview
The UK Oil Spot/Brent market is currently showing bullishness 🐂, driven by key factors—perfect for a day/scalping trade robbery! ☝☝☝
📰 Additional Tools & Analysis
📊 Get the Fundamental, Macro, COT Report, Quantitative Analysis, Sentiment Outlook, Intermarket Analysis, Future Targets—check our bi0 liinks 👉👉👉🔗🔗
⚠️ Trading Alert: News Releases & Position Management
📰 News can rattle the vault! 💥
✅ Avoid new trades during news releases.
✅ Use trailing stop-loss orders to protect profits.
💖 Supporting our heist plan?
💥 Smash the Boost Button 💥 to empower the robbery team.
Let’s make money every day in this market with the Thief Trading Style! 🏆💪🤝❤️🎉🚀
👀 Stay tuned for the next robbery plan, thieves! 🤑🐱👤🤗🤩
XTIUSD Breakdown from ascending channel now buy from supportXTIUSD Technical Update – 1H Timeframe 🚨
Crude Oil (XTIUSD) has broken down from the ascending channel, but is now showing a strong bullish reaction from the key demand zone at 65.10.
📈 Upside Targets:
🔹 1st Target: 70.00 – Local supply zone
🔹 2nd Target: 74.00 – Key supply zone
🔹 3rd Target: 77.00 – Bearish order block
The momentum is shifting – bulls are stepping in! Watch for confirmations on lower timeframes and manage risk accordingly. 🔍
✅ Like
✅ Follow
✅ Comment
💬 Join us for more real-time updates and analysis!
— With 💖,
Livia 😜

Bulish oil WTI)
✅ Overall Market Structure:
After a steady bullish trend, price has experienced a sharp drop and is now reacting to a demand zone around 64.955. The recent price action suggests signs of potential stabilization and a possible bullish reversal.
---
🟩 Key Levels:
Major Support Zone:
The area between 64.00 – 65.00 acts as a strong demand zone, which has shown prior reactions.
Resistance / Target Levels:
67.398 (first resistance and short-term target)
69.231 (mid-level resistance)
72.879 (main target if bullish momentum continues)
---
📈 Bullish Scenario (Most Probable Based on Current Chart):
After touching the demand zone, price seems to be forming a potential bottom. If a strong bullish candlestick appears (such as a bullish engulfing or hammer), we can expect a corrective or impulsive move to the upside.
🔸 Suggested Stop-Loss: Below 63.80
🔸 Target 1: 67.40
🔸 Target 2: 69.20
🔸 Target 3: 72.80
---
⚠️ Important Notes:
1. Wait for bullish confirmation before entering a trade.
2. If the support at 64 breaks, price may drop further toward the next demand zone around 61.00–60.00 (next major support lies at 59.415).
3. Keep an eye on oil-related news and U.S. economic reports (noted with calendar icons on the chart), as they can strongly impact volatility.
---
