falling wedge formation on 1 Hr chartCrude oil is forming a falling wedge pattern on 1 hr time frame after retesting daily head and shoulder pattern and demand zone.
Breakout level 65.6
stoploss 64.4
target 68.3
SPOTCRUDE trade ideas

WTI OIL Might be close to the end of correction or finished it.there are definetly more than 1 posibilities in this one, 1 more down wave can occur and that is why i have a invalidation level. long term definetly buy but short and mid term is just not very clear, i am thinking it s time to buy. what i am going to do is keep track of it a bit more in short term and if it gives me good buying opportunity near the below i will enter the trade with a stop loss. and if it upbrakes possible impulse wave will occur and i will buy again to mid term target. so for now keep an eye on it and buy if the opportunity arise.

WTI Crude oversold rally support at 6400WTI crude oil is trading just above a two-week low of 6400, as demand concerns continue to weigh on prices.
The pressure comes from uncertainty around President Trump’s tariff policy, which could worsen when the current 90-day pause ends on July 9. So far, only a minor trade deal with the UK has been reached, adding to fears of a global slowdown and weaker oil demand.
Earlier this week, oil prices also dropped after Trump announced a ceasefire between Israel and Iran, easing fears about disruptions through the Strait of Hormuz, a major oil shipping route.
On the positive side, expectations for Federal Reserve rate cuts are rising. If Trump replaces Fed Chair Jerome Powell with someone more supportive of rate cuts, it could help lift oil prices slightly by boosting the economic outlook.
Overall, oil remains under pressure with limited upside unless demand outlook improves or further supportive policy measures emerge.
Key Support and Resistance Levels
Resistance Level 1: 6925
Resistance Level 2: 7080
Resistance Level 3: 7230
Support Level 1: 6460
Support Level 2: 6300
Support Level 3: 6100
This communication is for informational purposes only and should not be viewed as any form of recommendation as to a particular course of action or as investment advice. It is not intended as an offer or solicitation for the purchase or sale of any financial instrument or as an official confirmation of any transaction. Opinions, estimates and assumptions expressed herein are made as of the date of this communication and are subject to change without notice. This communication has been prepared based upon information, including market prices, data and other information, believed to be reliable; however, Trade Nation does not warrant its completeness or accuracy. All market prices and market data contained in or attached to this communication are indicative and subject to change without notice.

USOIL:Go long
usoil: Let's start with a short-term rebound.
Trading idea:
BUY@64.8-65.2
TP: 66-66.4
More detailed strategies and trading will be notified here ↗↗↗
Keep updated, come to "get" ↗↗↗

OIL Bouncing at SupportLooking for a short bounce on US Oil here after a massive sell off earlier this week when the ceasefire was announced in the middle east. Again this is a short, countertrend bounce trade . Once you get a few percent, take your profits and get out.

Oil volatility expected to remain on Middle East tensions.Fundamental
Oil prices remain under pressure. Volatility is expected to remain elevated as traders digest inventory data, watch for geopolitical shifts, and anticipate the upcoming OPEC+ meeting on July 6, where supply policy could change.
Technical
Technical indicators remain strongly bearish with RSI favouring further downside below pivot level 65.53 toward support levels at 63.76 and 60.00. A break above 65.53 sees a move towards resistance levels at 66.50 and 69.00 subsequently

LONG ON OILUSOIL is consolidating at a major demand area.
We have a small choc (change of character) from down to up on the lower timeframe.
I will be buying oil to the next supply level looking to catch 500-1000 pips.

USOIL: Bullish Correction Ahead! Buy!
USOIL
- Classic bullish correction formation
- Our team expects growth
SUGGESTED TRADE:
Swing Trade
Buy USOIL
Entry Level - 65.16
Sl - 62.68
Tp - 68.86
Our Risk - 1%
Start protection of your profits from lower levels
Disclosure: I am part of Trade Nation's Influencer program and receive a monthly fee for using their TradingView charts in my analysis.
❤️ Please, support our work with like & comment! ❤️

Is WW3 Coming? Crude Waves Flash Warning which I DO NOT LIKE ITI’m getting a knot in my stomach looking at this chart, it feels like a warning about what’s coming.
Chart Context
• WTI jumped from the pandemic low of 6.62 up to 131.02 on March 6, 2022.
• It then retraced to 59.86 (38 % Fib) by June 4, 2025.
• That pullback seems complete, and now price is pressing against a descending wedge.
Wave Map
• Wave 3 could extend toward 207
• A full five-wave run points up near 330
• The pattern is squeezed in a tightening channel that looks ready to break any day
Why It Feels Risky
Breaking above 200 normally requires a major supply shock—think trouble at the Strait of Hormuz, surprise OPEC cuts, or a hit to U.S. shale. The Iran–Israel cease-fire is shaky, drones are still buzzing storage sites, and even a brief chokepoint shutdown would send tanker traffic into chaos. To me, the chart is flashing that tail risk.
Trading Plan
• I’ll watch the wedge’s upper trendline around 83 for my first signal
• A weekly close above 93 would clear the path to 117, then 145
• If price closes below 51 on the week, this thesis is off
Your Thoughts?
Does this wave count make sense, or am I reading too much into it? Drop your views—especially if you’ve got the geopolitical angle covered. I hope this wave doesn’t play out, but pretending it’s not there feels reckless.
(Not financial advice)

WW3 Scenario - Bull flag potentialWe bottomed at the gap fill at $57, a long term target I had been expecting. A bullish retest at the golden pocket followed, now all we need is a clean break above $80 to end the lower high downtrend. I don't want to comment on politics, but suffice to say the price of oil will tell us what's really going on. A supply shock has the potential to send oil to the $200 level. I don't know what the world will look like in that scenario, but I can assure you it will be a global catastrophe. Inflation will reignite, the interest rates will likely go up.
This is the single most important chart to be watching now. Forget Apple, forget Nvidia. Oil and the DXY is where the chart will reveal the news. Pay attention!

USOIL - REVERSAL Market is in bearish trend, however there is a bullish divergence on 1H time- which means market may take a deep correction. Futher harmonic pattern Bullish crab is also in formation.
Take the entry above the break of LH and stoploss below the D point / LL. and TPs with R:R ratio of 1:1 and 1:2
Thanks.

WTI USOILKey Factors Affecting US Oil Prices Today:
Geopolitical Developments:
Oil prices had surged earlier in June due to US airstrikes on Iranian nuclear sites and fears of supply disruptions through the Strait of Hormuz. However, prices fell sharply after a ceasefire was announced between Israel and Iran, easing immediate supply concerns.
Inventory Data:
Market participants are awaiting US crude and fuel inventory reports. Recent data showed a significant drawdown in US crude stocks, supporting prices despite geopolitical easing.
Demand Signals:
US refinery utilization has increased, and gasoline demand is near multi-year highs, indicating strong domestic consumption that underpins oil prices.
Market Sentiment:
After a recent two-day plunge (Brent fell over 6%), oil prices are recovering as investors reassess the durability of the ceasefire and ongoing demand fundamentals.

Tariff Panic = Opportunity | WTI Long SetupWTI Oil has finally dipped into my long-watched buy zone, driven by macro fear and an aggressive tariff agenda. The current drop aligned perfectly with my long-term execution plan. I’ve placed this trade based on key historical demand levels with my stop-loss and take-profit clearly defined. I’m prepared for deeper drawdown, but this area remains high-conviction for me. Execution > Prediction.
Technicals:
• Key Level: Price tapped into a major demand zone dating back to 2021 lows, which had been protected ever since.
• Liquidity Sweep: This drop mitigated every low formed post-2021 — clearing out late longs and stop hunts.
• Trendline Break Anticipation: I expect a potential trendline breakout from the long-term descending structure.
• SL/TP Defined: This trade has structure. It’s not a hope-based setup, it’s pre-planned and managed.
• Consolidation + Accumulation: This is where strong hands prepare, and I’m joining in.
Fundamentals:
• Tight supply, rising global demand, and structural underinvestment in oil exploration.
• Chinese reopening + Russian ban tighten market availability.
• Central banks expected to support demand via easing cycles.
• Oil Bearish Catalyst (Short-Term):
• US tariff wave: Trump announced a total 54% tariff on China and baseline tariffs on all trading partners.
• Escalating fears of global economic slowdown pushed prices to $58.80, a 4-year low.
The bearish panic gave bulls like us a gift. This is how real trades are born - not in euphoria, but in blood.
Note: Please remember to adjust this trade idea according to your individual trading conditions, including position size, broker-specific price variations, and any relevant external factors. Every trader’s situation is unique, so it’s crucial to tailor your approach to your own risk tolerance and market environment.

CRUDE OIL (WTI): Bullish Move From Support
WTI Crude Oil may continue rising from an underlined blue support cluster.
As a confirmation, I see a quick liquidity grab below that and a consequent
bullish imbalance candle on an hourly time frame.
I expect a rise to 66.24
❤️Please, support my work with like, thank you!❤️

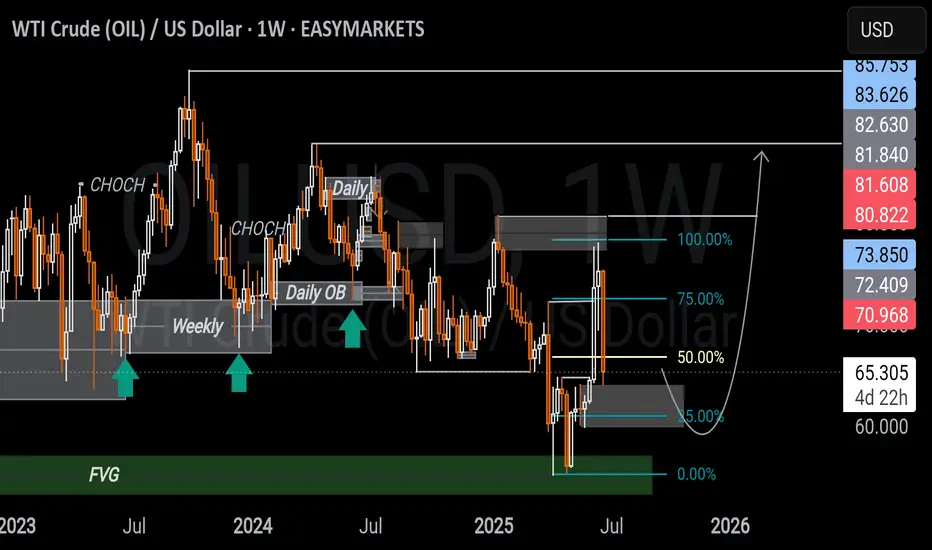
WTI CRUDE OIL USD WEEKLY ANALYSIS Price is reacting from a weekly FVG just below the 50% of a larger range, with some bullish momentum possibly fueled by recent geopolitical tensions.
But price is still within a bearish range acting as resistance, so upside may remain limited unless structure shifts.
A daily bullish OB below the 50% of that range could offer a solid pullback entry if price retraces which is aligning with the broader narrative and upside liquidity. Im having a neutral view of this and leveraging on both sides.
What are your thoughts?
CRUDE set to fire 82 $ 90 $ 104 $ ????Crude Daily Elliot waves count suggest big UP setup in progress right now
55 $ key level to watch for buyer Extension point
Due to amid middle-east war situation may trigger Up move impulse wave towards 82 $ to 104 $ range
EW count are keeping changing during different price action in different time frame & multiple forecast .
this educational based chart as per EW theory method

WTI USOIL WTI oil Prices are supported by supply cuts and production adjustments but tempered by inventory levels and economic concerns.
The market remains sensitive to geopolitical developments, OPEC+ policies, and US economic data.
#oil

Crude oil price analysis Crude oil trades near $65 with a key order block and trendline support. Watch for a daily breakout before entering a sell position. Full analysis inside. www.qexchange340.com

WTI OIL Best scalping opportunity at the moment!WTI Oil (USOIL) has been consolidating inside a ranged trading set-up, with the 4H MA100 (green trend-line) as its Resistance and the 4H MA200 (orange trend-line) as its Support.
We saw this previously from May 13 to June 01 and it presents the best scaling opportunity in the market at the moment. That previous Ranged Trading pattern eventually broke upwards as the Higher Lows trend-line held.
As a result, after you get your scalping profits within this range, look for a clear break-out above the 4H MA100 (candle closing) in order to go long (Resistance 1) or a break-out below the Higher Lows (candle closing) in order to go short (Support 1).
-------------------------------------------------------------------------------
** Please LIKE 👍, FOLLOW ✅, SHARE 🙌 and COMMENT ✍ if you enjoy this idea! Also share your ideas and charts in the comments section below! This is best way to keep it relevant, support us, keep the content here free and allow the idea to reach as many people as possible. **
-------------------------------------------------------------------------------
Disclosure: I am part of Trade Nation's Influencer program and receive a monthly fee for using their TradingView charts in my analysis.
💸💸💸💸💸💸
👇 👇 👇 👇 👇 👇

OIL: Sideways - Waiting for R2/S2 BreakoutsOil has been in a clear sideways consolidation for several days, reflecting a period of indecision in the market. While this tight range holds, a patient approach to trading is warranted. A long position will be considered if a confirmed breakout and sustained price action above R2 occur, indicating strong bullish momentum. Conversely, if oil breaks down and holds below S2, a short position will be initiated, anticipating further bearish movement. This current consolidation phase suggests a significant directional move is likely imminent, and observation of these key resistance and support levels will be crucial for entry signals.


SCALPING POSSITION US IOLus now on way to finish wave z
stp loss: 66.836
tp :67582
Like and folow our profile for more free analyse forex crypto stocks future anything
note :for help or ask for the best place fore entre just inbox me

Short-Term Overpricing Signals Oil ConsolidationFenzoFx—Crude Oil is retesting broken resistance at $67.5 while the Stochastic remains overbought, suggesting short-term pricing pressure.
A pullback into the Bullish Fair Value Gap may offer a low-risk entry before the uptrend resumes.
