WTI Crude Oil (USOIL) Technical Analysis: Bullish Reversal FacesOf course. Here is a detailed analysis of the provided financial chart for USOIL (WTI Crude Oil).
### Executive Summary
This is a **weekly (1W) Heikin Ashi chart** for CFDs on WTI Crude Oil (USOIL). The chart displays a long-term view, with a prominent downtrend from a peak in 2022. However, there has been a very strong bullish reversal in the most recent weeks. The analysis points to a critical juncture where the price is testing a key long-term resistance level. The bullish momentum is strong, but it faces significant hurdles ahead.
### Detailed Breakdown
#### 1. Asset and Chart Type
* **Asset:** USOIL (WTI Crude Oil), traded as a Contract for Difference (CFD).
* **Timeframe:** 1W (Weekly). Each candle represents one week of price action. This chart is used for analyzing long-term trends.
* **Chart Type:** Heikin Ashi. Unlike standard candlesticks, Heikin Ashi candles are calculated using averages, which smooths out price action and makes trends easier to identify. Long green candles with no lower wicks indicate strong buying pressure, while long red candles with no upper wicks indicate strong selling pressure.
#### 2. Current Price Action
* The last visible candle is a **strong green Heikin Ashi candle**, indicating significant bullish momentum during that week.
* The data for this candle shows: **Open 69.22, High 77.10, Low 69.22, Close 75.41**. This represents a gain of **+4.19%** for the week.
* The price has bounced sharply from a recent low and is now in its third consecutive week of gains.
#### 3. Key Technical Indicators
**a) Fibonacci Retracement:**
* This tool is drawn from a significant low (marked as 1 at **$68.01**) to a major high (marked as 0 at **$123.24**). It's used to identify potential support and resistance levels.
* The price has been trading between the 0.618 and 1 levels for a prolonged period.
* The recent low was found just below the `1` level ($68.01), indicating a potential double-bottom or failure to break lower.
* The price has since reclaimed the `0.786` level ($79.83) and is currently trading around the **$75.41** mark. The next major resistance levels based on this tool are:
* **0.786:** $79.83
* **0.618:** $89.11
* **0.5:** $95.63
**b) Moving Average (MA):**
* A **50-period Moving Average (MA 50)** is present on the chart (the blue line), with a current value of **69.89**.
* On a weekly chart, the 50-week MA is a critical long-term trend indicator.
* The price has been consistently below the 50-week MA since late 2022, confirming the long-term bearish trend.
* **Crucially, the current price is attempting to break above this moving average.** A sustained close above the 50-week MA would be a strong bullish signal. Conversely, if this level acts as resistance and the price is rejected, it could signal a continuation of the downtrend.
**c) Relative Strength Index (RSI):**
* The RSI (14) is shown at the bottom. The purple line (RSI) is currently at **63.33** and its moving average (yellow line) is at **41.95**.
* The RSI is pointing upwards and has decisively crossed above its moving average, indicating **building bullish momentum**.
* It is not yet in the "overbought" territory (typically above 70), which suggests there could be more room for the price to move higher before becoming extended.
**d) Fibonacci Time Zones:**
* The vertical blue lines numbered 0, 1, 2, 3, 5, 8 are Fibonacci Time Zones. They are used to forecast potential turning points in the market based on time intervals.
* The recent major low occurred very close to the "8" time zone marker, which may have contributed to the timing of this reversal.
### Synthesis and Potential Scenarios
* **Bullish Scenario:** The combination of strong green Heikin Ashi candles, a rising RSI, and a bounce from a key long-term low points to strong short-term bullish momentum. If the price can decisively break and hold above the **50-week MA (around $70)** and the **Fibonacci 0.786 level ($79.83)**, the next major target would be the **0.618 level at $89.11**.
* **Bearish Scenario:** The long-term trend remains bearish as long as the price is below the 50-week MA. This level, combined with the psychological resistance at $80, could prove to be a formidable barrier. If the price fails to break through, it could be rejected back down to test recent lows around the **$68.00** area.
In conclusion, the chart shows a classic battle between short-term bullish momentum and a long-term bearish trend. The price's interaction with the **50-week moving average** in the coming weeks will be critical in determining the next major directional move for WTI Crude Oil.
SPOTCRUDE trade ideas

#USOIL - CUT n REVERSE region, still holds??#USOIL.. well guys in first go market perfectly holds our region then again n again..
Now again. Market is in our resistance region and if market hold again then again drop expected.
But
Keep in mind that above that region new will go for cut n reverse on confirmation .
Good luck
Trade wisely

Oil buy setup H1Hello! Friends,
Greetings. Please leave a Like if you like the idea.
Before start talking about technical Let's share your LOVE by giving me LIKES to support this work. Thanks in advance.

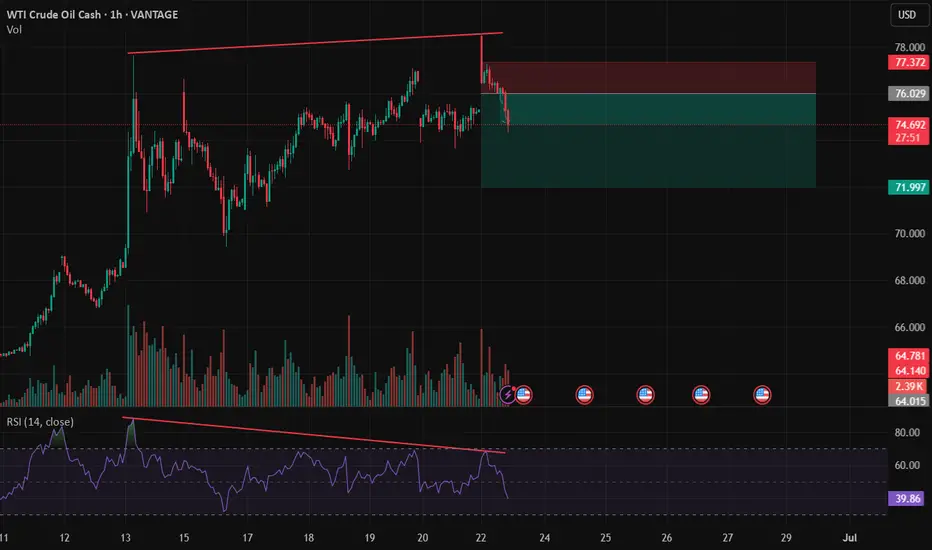
Double topDouble top with RSI divergency. If you have the strength to ride all the way down to neck line you going to be well rewarded.
USOIL Bullish breakout from symmetrical triangle pattern🚨 USOIL Breakout Alert! 🚨
1H Time Frame | Symmetrical Triangle Breakout
Crude oil (USOIL) has broken out bullishly from a symmetrical triangle pattern — confirming strong upward momentum. 📈
🎯 Entry Level: 74.20
📍 Technical Targets:
1st Resistance: 75.70
2nd Resistance: 76.80
This setup signals a potential continuation of bullish momentum. Keep an eye on volume confirmation and price action near resistance levels.
💬 Drop your thoughts in the comments!
📲 Like, follow, and join us for more real-time market insights.
Trade smart
,
– Livia 😜

WTI Oil H4 | Multi-swing-low support at 61.8% Fibo retracementWTI oil (USOIL) is falling towards a multi-swing-low support and could potentially bounce off this level to climb higher.
Buy entry is at 72.92 which is a multi-swing-low support that aligns with the 61.8% Fibonacci retracement.
Stop loss is at 69.10 which is a level that lies underneath a swing-low support.
Take profit is at 77.60 which is a multi-swing-high resistance.
High Risk Investment Warning
Trading Forex/CFDs on margin carries a high level of risk and may not be suitable for all investors. Leverage can work against you.
Stratos Markets Limited (tradu.com ):
CFDs are complex instruments and come with a high risk of losing money rapidly due to leverage. 63% of retail investor accounts lose money when trading CFDs with this provider. You should consider whether you understand how CFDs work and whether you can afford to take the high risk of losing your money.
Stratos Europe Ltd (tradu.com ):
CFDs are complex instruments and come with a high risk of losing money rapidly due to leverage. 63% of retail investor accounts lose money when trading CFDs with this provider. You should consider whether you understand how CFDs work and whether you can afford to take the high risk of losing your money.
Stratos Global LLC (tradu.com ):
Losses can exceed deposits.
Please be advised that the information presented on TradingView is provided to Tradu (‘Company’, ‘we’) by a third-party provider (‘TFA Global Pte Ltd’). Please be reminded that you are solely responsible for the trading decisions on your account. There is a very high degree of risk involved in trading. Any information and/or content is intended entirely for research, educational and informational purposes only and does not constitute investment or consultation advice or investment strategy. The information is not tailored to the investment needs of any specific person and therefore does not involve a consideration of any of the investment objectives, financial situation or needs of any viewer that may receive it. Kindly also note that past performance is not a reliable indicator of future results. Actual results may differ materially from those anticipated in forward-looking or past performance statements. We assume no liability as to the accuracy or completeness of any of the information and/or content provided herein and the Company cannot be held responsible for any omission, mistake nor for any loss or damage including without limitation to any loss of profit which may arise from reliance on any information supplied by TFA Global Pte Ltd.
The speaker(s) is neither an employee, agent nor representative of Tradu and is therefore acting independently. The opinions given are their own, constitute general market commentary, and do not constitute the opinion or advice of Tradu or any form of personal or investment advice. Tradu neither endorses nor guarantees offerings of third-party speakers, nor is Tradu responsible for the content, veracity or opinions of third-party speakers, presenters or participants.

OIL: THE CHART THAT COULD TIP THE WORLDWTI Crude just bounced hard off the $65 channel support, tagging resistance at $76 — and what happens next isn’t just about price. It’s about power.
Zoom into this chart:
We're sitting at a directional pivot with two possible outcomes:
1️⃣ If this was a truncated 5th wave, the structure is complete. Any further war escalation could be the catalyst for oil to break resistance — dragging down risk assets, including CRYPTOCAP:BTC and equities.
2️⃣ If wave 5 isn’t done, we’ll likely see one more sharp leg down before oil launches. Either way, this is a high-stakes Elliott Wave setup with global macro consequences.
Chart with FIB Levels:
You'll see the wave I’ve marked (3) is messy, and on lower timeframes, that may hint at a truncated move worth watching.
Why this matters:
Over 20% of global oil flows through the Strait of Hormuz, a critical chokepoint controlled by Iran. If conflict escalates, that line gets squeezed… and oil price explodes.
Price to watch:
$76 resistance.
If oil breaks, the markets will react fast.
If it fails, we might get one more correction and maybe some relief from the sideways pain we’ve seen across risk assets.
Remember the COVID Crash?
Oil literally went below zero in April 2020. That wasn't just a chart anomaly, it was a global demand collapse. Traders were paying to get rid of oil because there was nowhere to store it. That moment marked a generational low, and what followed was a powerful multi-year 5 wave up.
Now look where we are:
That same COVID low helped form the base of the current Elliott Wave structure. The fact we’re back testing levels that once sparked global panic is no coincidence.
If you’ve been here before, you’ll see the signs. The charts always leave traces. And if this is the end of wave 5, it could be the start of a whole new macro move.
TLDR:
Stop trading headlines.
Trade the structure.
This chart is telling us everything.

The situation escalates? Crude oil gains remain stable
💡Message Strategy
The daily chart of WTI crude oil shows a 30% increase from late May to mid-June, with prices stagnating below resistance near $76. The Commodity Channel Index (CCI) has been overbought since late May and is now approaching a potential buy signal below 100.
Volatility peaked on June 14 and has since fallen back, suggesting that oil prices could see a correction if tensions in the Middle East do not escalate further. But now that the United States is out of the game and the situation could escalate at any time, crude oil is still in a bullish market.
📊Technical aspects
From the daily chart level, crude oil prices have broken through the upper resistance of the range in the medium term and tested a new high of 75.00. The moving average system is in a bullish arrangement, and the medium-term objective trend is upward. The current trend is in the upward rhythm of the main trend. The MACD indicator fast and slow lines overlap with the bullish column above the zero axis, indicating that the bullish momentum is currently full, and it is expected that the medium-term trend is expected to usher in a wave of rising rhythm.
The short-term (1H) trend of crude oil fluctuated and then broke through upward, and the oil price tested a new high near 78.40. The moving average system gradually opened upward, and the short-term objective trend direction was upward.
In terms of momentum, the MACD indicator fast and slow lines opened upward near the zero axis, and the bullish momentum was dominant. It is expected that the trend of crude oil will maintain a high level of fluctuation upward.
💰Strategy Package
Long Position:74.50-75.50,SL:73.50
Short-term target is around 77.00-78.00

Trump’s “ambiguous” statement, where will oil prices go?
💡Message Strategy
Trump's remarks are repeated, and the geopolitical premium still limits the downward space of oil prices
Trump said that the United States "may or may not" join Israel's actions against Iran. Analysts pointed out that if the United States is officially involved in the conflict, oil prices may rise by $5; if peace talks are launched, they may fall by the same amount.
The geopolitical focus is still on the Strait of Hormuz
Iran produces 3.3 million barrels of oil per day, but more importantly, about 19 million barrels of crude oil are transported through the Strait of Hormuz. The escalation of the conflict may threaten the safety of the waterway.
The Fed's policy turn to dovish failed to effectively support oil prices
Although the Fed hinted that it may cut interest rates twice this year, Chairman Powell emphasized that the decision still depends on inflation data, and Trump's upcoming new round of import tariffs may push up prices and limit the boost in oil demand brought about by loose policies.
📊Technical aspects
From the daily chart level, crude oil prices in the medium term broke through the upper resistance of the range and tested a new high of 75.50. The moving average system is in a bullish arrangement, and the medium-term objective trend is in the direction.
The current trend is in the upward rhythm of the main trend. The MACD indicator fast and slow lines overlap with the bullish column above the zero axis, indicating that the bullish momentum is currently full, and it is expected that the medium-term trend is expected to usher in a wave of rising rhythm.
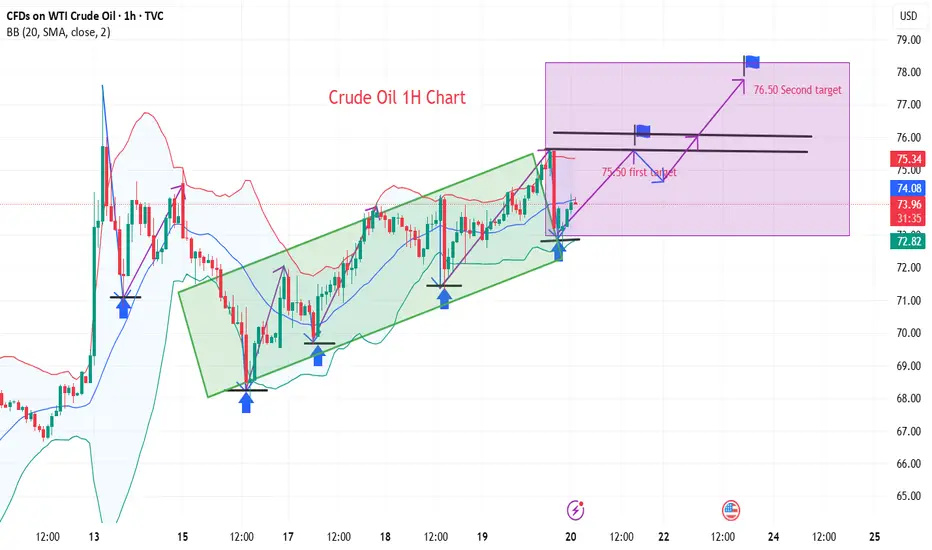
💰Strategy Package
Long Position:73.00-73.50,SL:72.50
The first target is around 75.50
The second target is around 76.50
If the situation in the Middle East escalates, the room for crude oil to rise will be enlarged
Today's crude oil trading strategy, I hope it will be helpful to 1. Technical Support at the $74 Safety Cushion
Current prices sit squarely in the $74-$78 trading range, with $74 acting as a proven safety cushion—history shows prices rebounding each time they test this level. The $75.03 dip is a hair's breadth from this buffer, testing its resilience.
2. Why the Pullback?
- **Geopolitical Fatigue**: Markets are shrugging off Iran's Strait of Hormuz blockade threats, like crying wolf too often.
- **OPEC+ Supply Jitters**: Despite Saudi Arabia potentially limiting exports due to domestic power demand, the group's production hike announcement has fueled oversupply concerns.
3. Underlying Tensions Remain
Iran's rhetoric may be empty so far, but the standoff resembles two foes clutching weapons mid-argument—any escalation could send prices surging. This dip likely reflects market indecision, as traders await the first move.
4. Trading Strategies for Different Styles
- **Aggressive Traders**:
Consider light long positions near $75, like resting your foot on the gas before a stoplight turns green. Set stop-loss below $74 (breaching the safety cushion signals a trend shift) and target $78 initially, eyeing higher levels on a breakout.
- **Conservative Traders**:
Stick to range trading: buy near $74-$75 and sell around $77-$78, like cruising on a flat road for steady gains. Keep position sizes small and take profits promptly.
5. Key Watchout: Strait of Hormuz Realities
Monitor for concrete disruptions—oil tanker attacks or navigation system glitches would confirm the "wolf has arrived." Adjust positions decisively based on pre-set plans: add to longs on threats, or cut losses if diplomacy defuses tensions.
The market resembles a ship in choppy waters—opportunities and risks coexist. Stay vigilant and flexible, like a driver scanning the road ahead while ready to brake or steer. In this game, survival outpaces quick profits.
Today's crude oil trading strategy, I hope it will be helpful to you
USOIL buy@74~74.5
SL:73
TP1:75.5~76.5
TP2:77~78

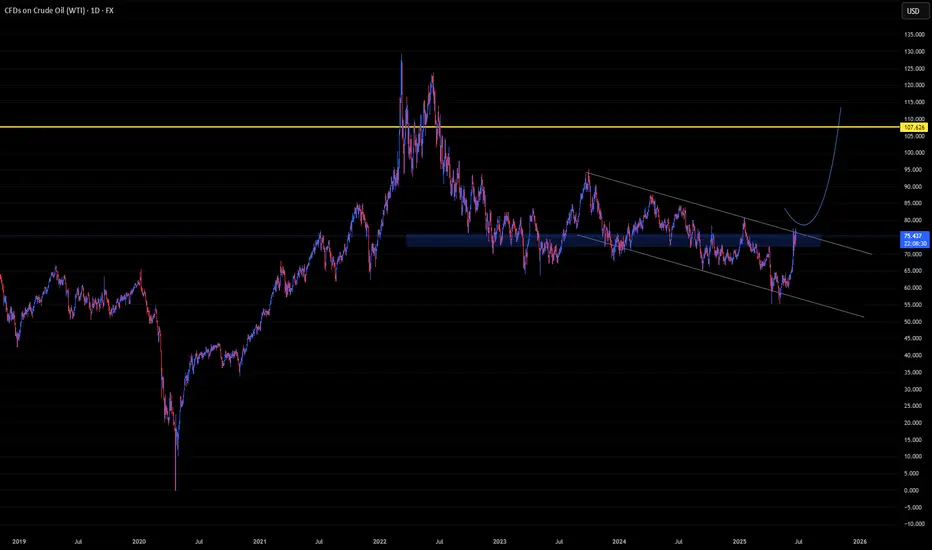
U-oyela Ongahluziwe Nenkunzi.Considering the current countries in conflict - FX:USOIL is in the middle of it. This will lead in a high demand but low supply of the commodity resulting in a soaring bullish move, fundamentally. Technically, the commodity has created a LL in the current year, tapping lows last touched since 2021 and has further recovered from last years close of 71.899.
FX:USOIL reaching highs of $110.00 is therefore likely.
***The best way to take advantage of this commodity or any other is to cherry pick stocks that are sensitive to it e.g. JSE:SOL is sensitive to FX:USOIL .***
US oil Oil prices could rise due to high geopolitical uncertainties Prices Poised to Rise Amid Heightened Geopolitical Tensions
Oil prices have remained steady in recent days, driven by the anticipation of potential diplomatic resolutions between Iran and Israel. However, with diplomacy now off the table and news emerging of a U.S. strike on Iran, the market is reacting swiftly.
Given the current geopolitical climate, it’s normal to expect a surge in oil prices. However, traders should be aware that oil is highly volatile—it tends to spike rapidly but often struggles to maintain upward momentum.
While a price increase is likely, as illustrated in the attached chart, the level of risk remains elevated. Please exercise caution when trading under these conditions.
More details are provided in the chart.
Thank you, and good luck!

WTI Short PositionBelieve stability within the Middle East market will bring the price down so it could rebound back up once liquidity has been cleared

Oil Set to Surge? Aggressive Entry Ahead of Potential BreakoutWTI is showing signs of a breakout following reports suggesting price spikes ahead. I've taken an aggressive position early, with an extreme risk-reward setup. A more conservative 3R idea also sits in play if price confirms. Watch for a trendline break—the clearest sign of lift-off. But be warned: the gap breakout may hit before many can get in. Momentum is building fast.

Oil panic buying after Iran Strikes?President Donald Trump has confirmed that the U.S., in coordination with Israel, has conducted three strikes on Iranian nuclear facilities.
Will there be panic buying of WTI and Brent at the open?
In response, Iran’s parliament has approved a proposal to close the Strait of Hormuz, a key global oil shipping route. The final decision lies with Iran’s Supreme National Security Council and Supreme Leader Ayatollah Ali Khamenei.
If a blockade is enforced, oil prices could rise sharply. ClearView Energy Partners estimates a short-term closure could add between $8 and $31 per barrel. JP Morgan has suggested that a full-scale conflict and complete shutdown could drive prices to $130.

XTIUSD H4 AnalysisXTIUSD Showing a bearish Flag. If it breaks this zone above, Most probably can fly upto 81.00 and higher. If no, Can rally between 72, 68 or even 66. Trading Analysis from 23-06-25 to 27-06-25. Take your risk under control and wait for market to break support or resistance on smaller time frame. Best of luck everyone and happy trading.🤗

Oil prices could rise due to high geopolitical uncertaintiesOil prices could rise due to high geopolitical uncertainties
The price of OIL has been waiting all these days with hopes for negotiations between Iran and Israel.
Currently, diplomacy is dead, so for now, the market has to absorb the news that the US has attacked Iran.
The price of oil is normal to rise and it is also very risky because it reacts quickly and does not keep the bullish momentum.
The price may rise as I showed in the chart, but the risk remains high.
Please be careful.
You may find more details in the chart!
Thank you and Good Luck!
❤️PS: Please support with a like or comment if you find this analysis useful for your trading day❤️

CRUDE OIL (WTI): Technical Analysis & Important pattern to WatchHere’s my latest analysis on ⚠️USOIL price action.
The price has recently finished a correction, followed by a brief consolidation in a horizontal range and an ascending triangle pattern
A bullish breakout above the intraday resistance levels would suggest a likely end to the accumulation phase.
The chances are high that the pair is returning back to a bullish trend, with a target of 77.00.
Strong fundamentals back this bullish outlook.

US-Oil will further push upside After Testing TrendlineHello Traders
In This Chart XTIUSD HOURLY Forex Forecast By FOREX PLANET
today XTIUSD analysis 👆
🟢This Chart includes_ (XTIUSD market update)
🟢What is The Next Opportunity on XTIUSD Market
🟢how to Enter to the Valid Entry With Assurance Profit
This CHART is For Trader's that Want to Improve Their Technical Analysis Skills and Their Trading By Understanding How To Analyze The Market Using Multiple Timeframes and Understanding The Bigger Picture on the Charts

Potential 3000+pips on XXXUSD PairsGBPUSD
We anticipate a potential bullish move towards the 1.3540 region, from there, we'll be watching closely for sign of exhaustion to initiate a short position, targeting up to 300pips to the downside. A confirmed daily close below the 1.2270 level will serve as out trigger to hold the short position with confidence,
EURUSD
For this market, we remain cautiously bearish. A 4H timeframe close below the 1.3950 region will be our signal to begin more sells to the downside targets around 1.3400 and 1.12800 zones. Until that breakdown occurs, we'll remain on the side-lines to avoid premature entries.
XAUUSD
Gold will be traded with a high level of discipline- only high conviction trades will be taken here. We're currently waiting for a clear breAK and close below the 3291.90 level before initiating any shorts positions. Until then, we maintain a neutral stance and monitor price action closely around key levels.
USOIL
We're keeping an eye on possible entry opportunities, anticipating a potential rally towards the 116 region. Updates on the setup and validation criteria will follow as price action unfolds.
Send a direct message if you are interested in more info about Capital Management.
Patience is the Way! Ieios


Crude Oil Market Trend Forecast for Next WeekThe oil price continued its upward trend this week, despite a brief correction on Friday. As of Friday's Asian session, Brent crude oil futures dropped by $1.57, or 2%, to $77.28 per barrel. However, the cumulative weekly gain reached 3.9%, marking three consecutive weekly increases. Geopolitical risks continued to fuel market sentiment. Oil prices surged nearly 3% on Thursday after Israel bombed Iranian nuclear targets, following Iran's missile strikes on Israel after its earlier missile attack on an Israeli hospital. The focus of the current crude oil market has shifted entirely from supply-demand fundamentals to geopolitical risks. Although Iran's crude oil exports have not been substantially disrupted, investors have started to price in the worst-case scenario. If the situation further deteriorates and affects shipping routes through the Strait of Hormuz, global energy prices may face a new round of sharp volatility.
In the short term, oil prices still exhibit upward potential, with the current trend maintaining an overall upward trajectory. The MACD indicator's fast and slow lines overlap with bullish bars above the zero axis, signaling robust bullish momentum. This suggests that the medium-term trend is expected to usher in an upward rally.
you are currently struggling with losses,or are unsure which of the numerous trading strategies to follow,You have the option to join our VIP program. I will assist you and provide you with accurate trading signals, enabling you to navigate the financial markets with greater confidence and potentially achieve optimal trading results.
Trading Strategy:
buy@72.0-72.5
TP:75.0-75.5

USOIL - Another Bullish Move!Hello Traders !
Amid escalating tensions between Iran and Israel and following US strikes on Iranian nuclear sites, the Iranian parliament has approved the closure of the Strait of Hormuz.
So, I expect another bullish move in USOIL price🚀
______________
TARGET: 77.200🎯
