DJI trade ideas
US30 H4 IdeaThe Federal Reserve meets next week and is widely expected to leave rates unchanged at 4.25%–4.50%. Still, market participants will watch for commentary on inflation and rate-cut prospects, especially after recent criticism of Fed Chair Powell by President Trump.
What Should Traders Watch?
With the major indexes on track for weekly gains, next week’s developments could test the market’s resilience.

Long Position on Dow Jones Industrial Average
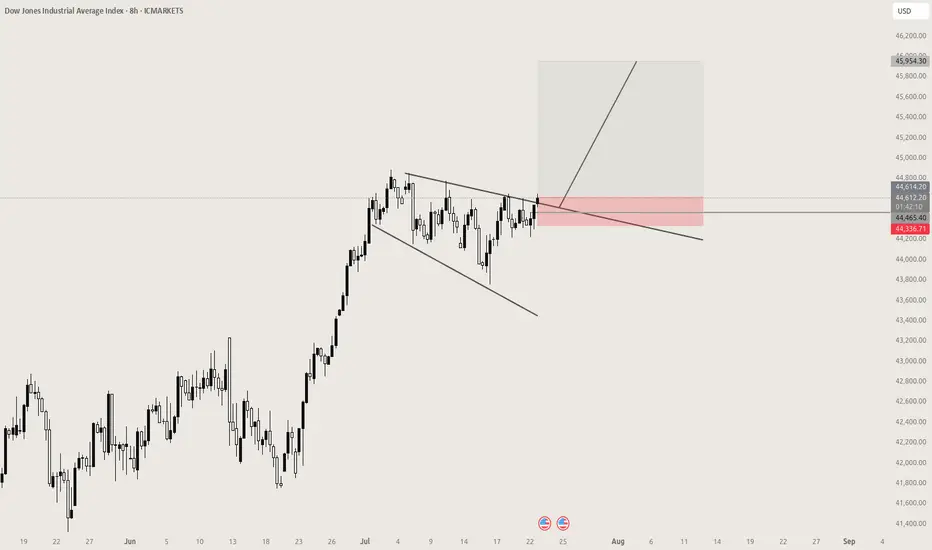
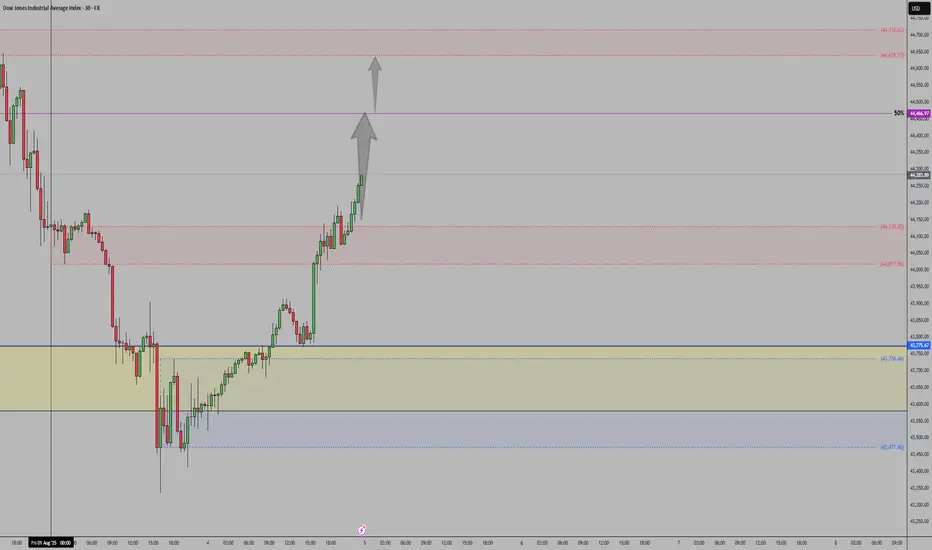
Initiating a long position at 44,456, supported by robust economic data and stronger-than-expected corporate earnings. These indicators point to continued resilience in the U.S. economy, potentially allowing the Federal Reserve to consider rate cuts sooner than previously anticipated — a positive catalyst for equities.
📌 Entry: 44,456
🛑 Stop Loss: 44,207
🎯 Take Profit: 44,900
Monitoring price action closely as market sentiment continues to shift in response to macroeconomic developments.

US30 Hits New All-Time High – What’s Next?US30 | OVERVIEW
The price has printed a new all-time high, exactly reaching our target at 45,090, as previously anticipated.
Today, we may see a correction toward 44,770 and 44,610. If the price stabilizes above these levels, another bullish leg is expected.
On the upside, a break above 44,910 would confirm a bullish continuation toward 45,090 and 45,250.
Key Levels:
Support: 44,770 · 44,610 · 44,370
Resistance: 45,090 · 45,250
previous idea:

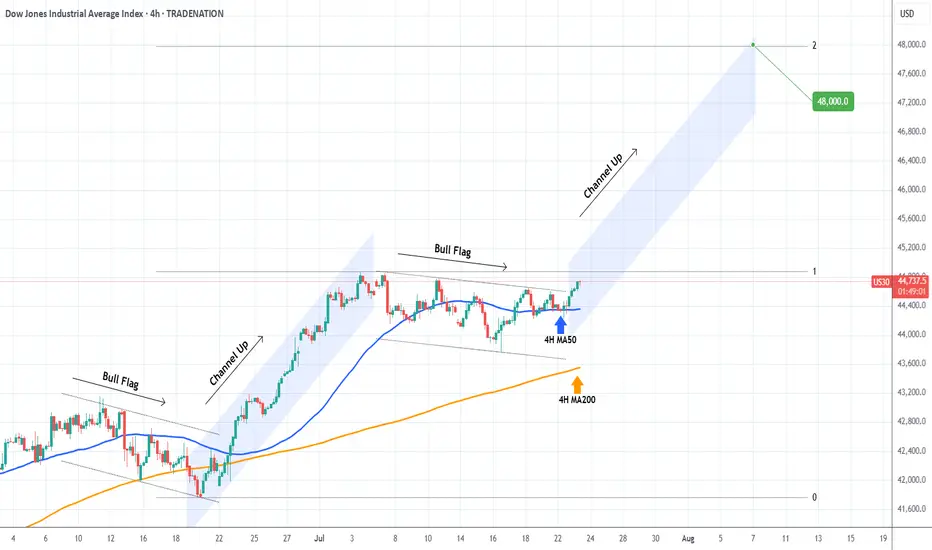
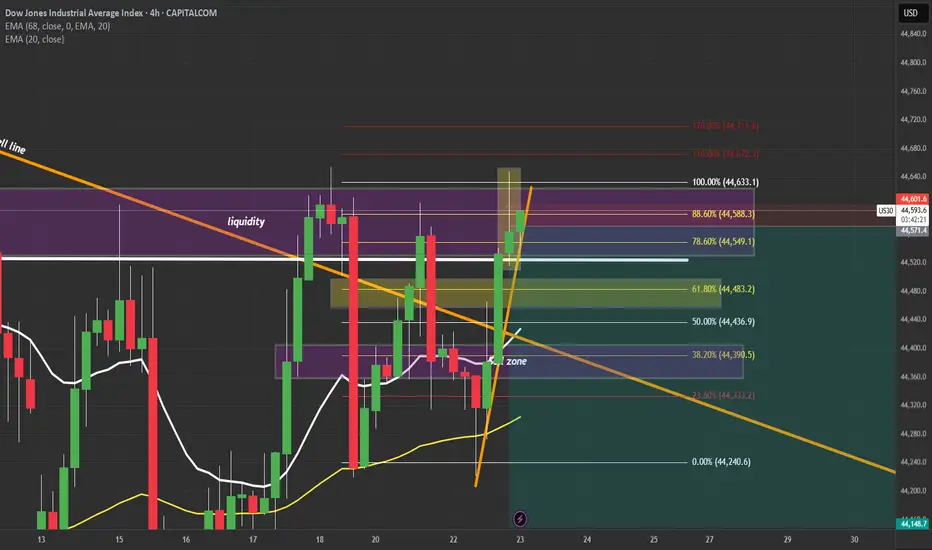
DOW JONES Strong rebound on its 4H MA50.Dow Jones (DJI) is having a strong rebound exactly on its 4H MA50 (blue trend-line). This is taking place just after the price broke above the Bull Flag that served as the accumulation pattern following the previous Channel Up.
This is a repetitive pattern and most likely we will now see the new Channel Up starting. The technical Target on such formations is the 2.0 Fibonacci extension at 48000.
-------------------------------------------------------------------------------
** Please LIKE 👍, FOLLOW ✅, SHARE 🙌 and COMMENT ✍ if you enjoy this idea! Also share your ideas and charts in the comments section below! This is best way to keep it relevant, support us, keep the content here free and allow the idea to reach as many people as possible. **
-------------------------------------------------------------------------------
Disclosure: I am part of Trade Nation's Influencer program and receive a monthly fee for using their TradingView charts in my analysis.
💸💸💸💸💸💸
👇 👇 👇 👇 👇 👇
US30: Local Bearish Bias! Short!
My dear friends,
Today we will analyse US30 together☺️
The in-trend continuation seems likely as the current long-term trend appears to be strong, and price is holding below a key level of 44,774.9 So a bearish continuation seems plausible, targeting the next low. We should enter on confirmation, and place a stop-loss beyond the recent swing level.
❤️Sending you lots of Love and Hugs❤️

Dow Set for Volatile Move as Earnings, Tariff Risks CollideUS30 OVERVIEW
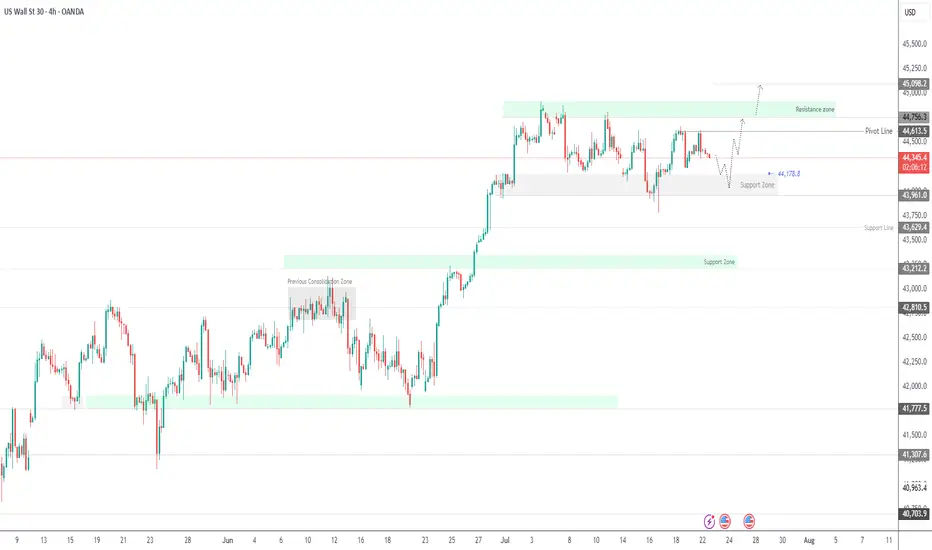
The price is currently consolidating between 44,180 and 44,620, awaiting a catalyst. Today’s earnings reports are expected to heavily influence Dow Jones price action.
If earnings come in strong, the index is likely to push toward 44,620 and 44,760. A confirmed stability above 44,620 would strengthen the bullish case, potentially opening the path toward a new all-time high near 45,100.
However, a break below 44,180 would signal bearish momentum, with potential downside toward 43,960. Additional pressure could come from escalating tariff tensions, further weakening sentiment.
Resistance: 44,620 · 44,760 · 45,100
Support: 44,180 · 43,960 · 43,630
US30 Massive Bullish Breakout!
HI,Traders !
#US30 is trading in a strong
Uptrend and the price just
Made a massive bullish
Breakout of the falling
Resistance line and the
Breakout is confirmed
So after a potential pullback
We will be expecting a
Further bullish continuation !
Comment and subscribe to help us grow !

US30 US30 maintains a bullish outlook, supported by improving economic data, rotation into industrials and value stocks, and resilient corporate earnings. As long as price holds above key support levels, the broader uptrend remains intact.

US30 SHORT FORM RESISTANCE|
✅DOW JONES index keeps
Growing in a strong uptrend
And we are bullish biased long-term
However the price has hit an all-time-high
Resistance level of 45,072(which can be seen
Further left you zoom out on higher TF)
So as we are already seeing a local
Bearish reaction we will be
Expecting a local bearish correction
SHORT🔥
✅Like and subscribe to never miss a new idea!✅
Disclosure: I am part of Trade Nation's Influencer program and receive a monthly fee for using their TradingView charts in my analysis.
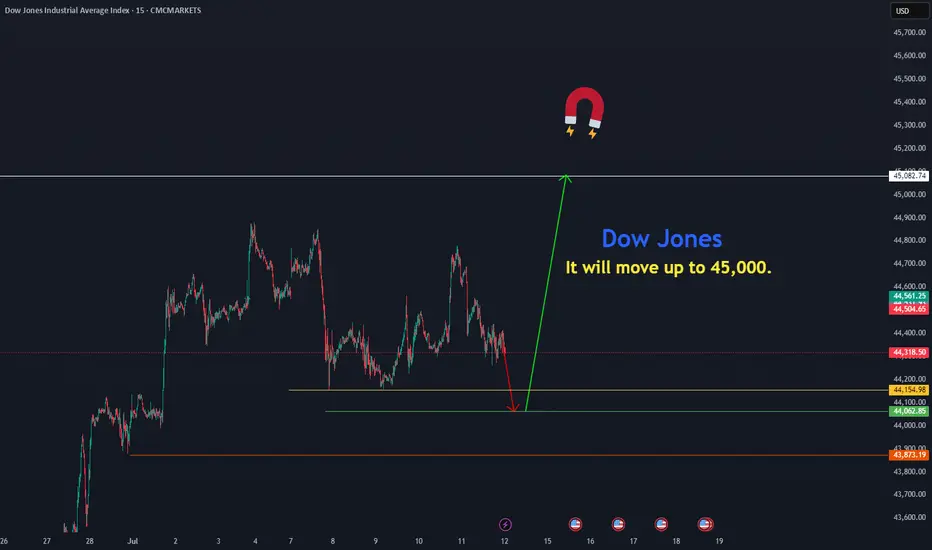
Dow Jones move upThe Dow Jones is resuming its rally toward 45,082 from the price zones of 44,154.97 and 44,000.
CMCMARKETS:US30
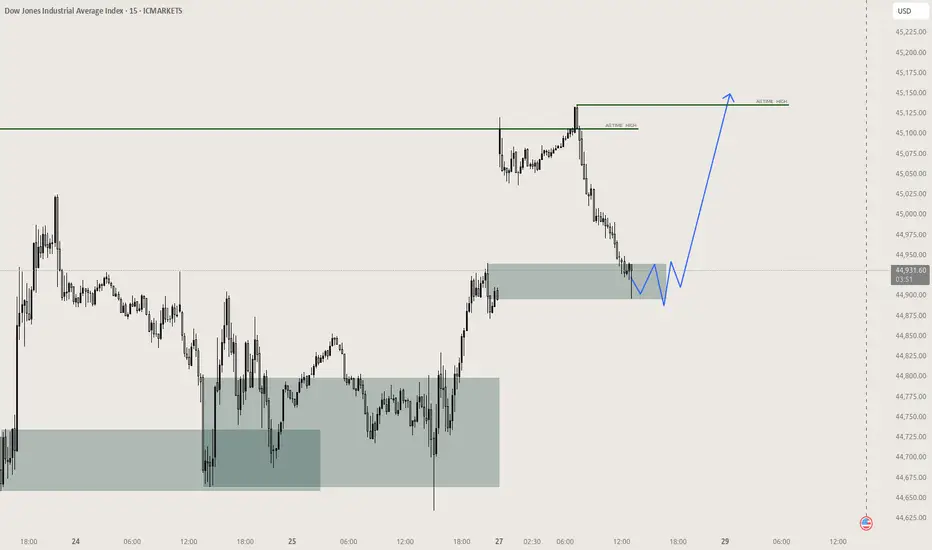
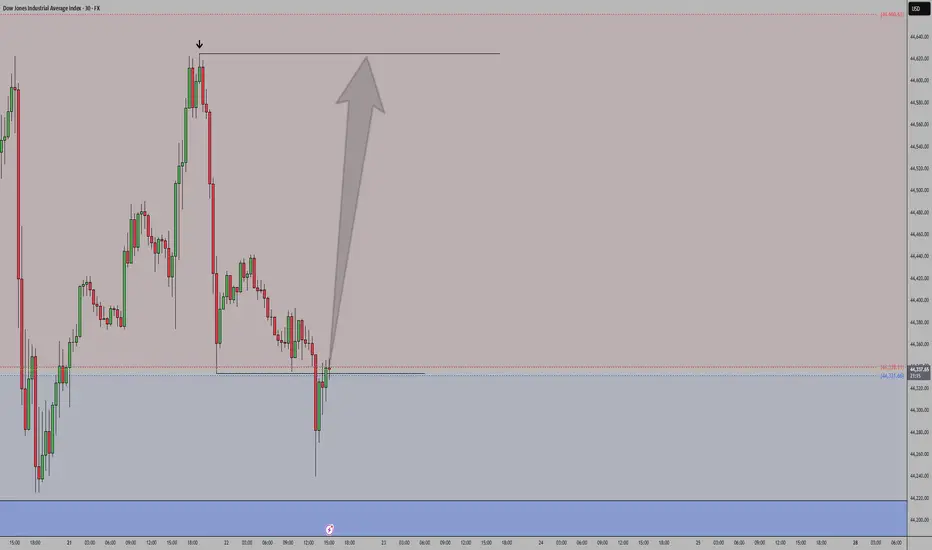
US30 - What I believe will happen todayConsidering today is now Wednesday and Wednesday's have a consistency of being one of those off days. Primarily because usually there are Fed speeches on this day that manipulate the market. With that said, I'm expecting price action to play out how I plotted the arrows on the chart. I believe there is still some further upside for today but then I believe we might get that intraday correction around 11:am - noon EST.
Let's see how today plays out. Trade safe
US30 Dow Jones New All Time HIGHMost people over complicate things, mostly the idea is right in front of you yet most don't believe in what they trade; simple bull flag, simple new ATH, that's it. believe it.
US30 | Inverted Hammer at Key Supply Zone – Reversal or BreakoutUS30 just printed an inverted hammer on the 4H at a major supply zone (44,550–44,600). This is a critical decision point:
✅ Bearish Case:
If price rejects and closes back below 44,530, sellers could take control with targets at 44,380 → 44,180 → 44,020.
✅ Bullish Fakeout:
If price breaks and holds above 44,620, expect a push toward 44,700 and 44,900.
📌 What I’m Watching:
Rejection candle + bearish close → short entries.
Strong breakout candle with retest → long continuation.
Key Levels:
🔴 Resistance: 44,550–44,600
🟢 Support: 44,380 → 44,020
⚠️ Manage risk carefully. Volatility is high and liquidity hunts are common in this zone.
💬 Do you think we reject here or break out higher? Drop your thoughts below!
#US30 #DowJones #PriceAction #SmartMoney #TradingView #TechnicalAnalysis #IndicesTrading
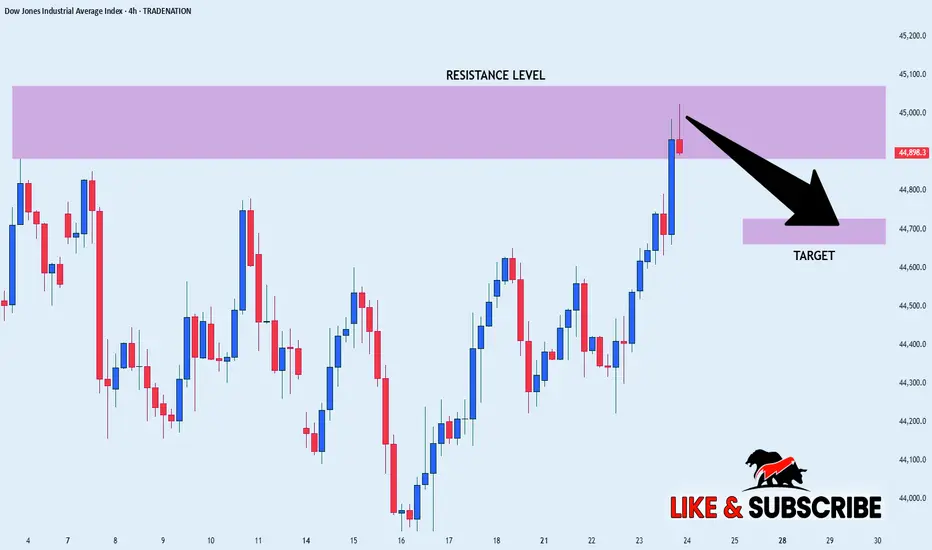
US30: The Market Is Looking Down! Short!
My dear friends,
Today we will analyse US30 together☺️
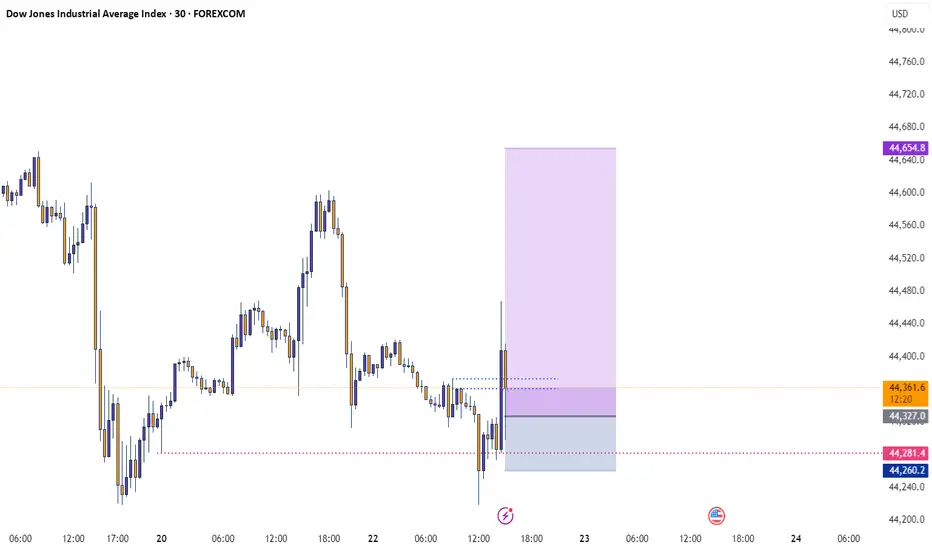
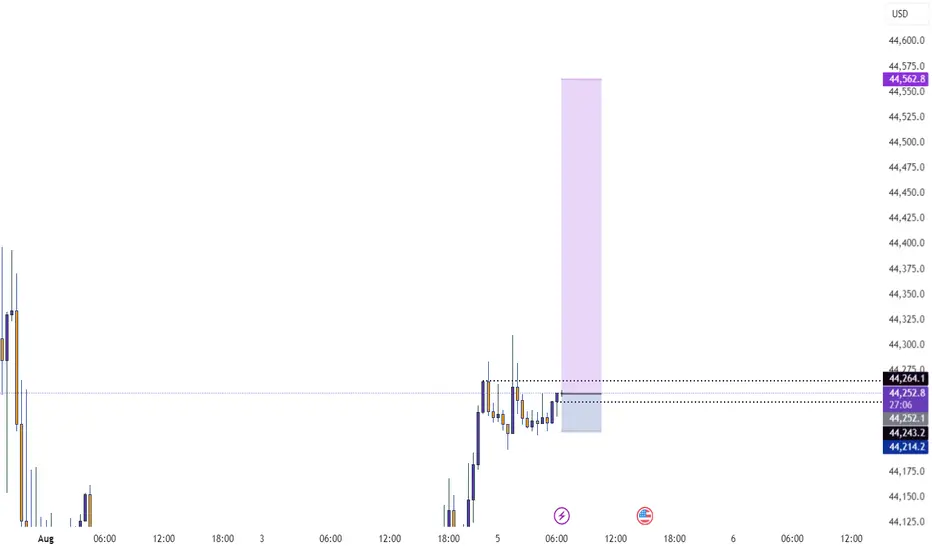
The recent price action suggests a shift in mid-term momentum. A break below the current local range around 44,306.1 will confirm the new direction downwards with the target being the next key level of 44,263.8..and a reconvened placement of a stop-loss beyond the range.
❤️Sending you lots of Love and Hugs❤️

Buy
Rejection Level
Daily Volume
Market Structure Shift
London Session
Trend Line Break
Untapped Order Point
Dow Jones Index (US30) Technical Analysis:The Dow Jones is currently trading near $44,100, after a strong bullish move that failed to break through the $44,300 resistance zone.
🔹 Bearish Scenario:
If the price breaks below $44,000 and holds, it may head toward the $43,350 support level.
🔹 Bullish Scenario:
If bullish momentum returns and the price breaks above $44,300, the next target may be around $45,100.
⚠️ Disclaimer:
This analysis is not financial advice. It is recommended to monitor the markets and carefully analyze the data before making any investment decisions.
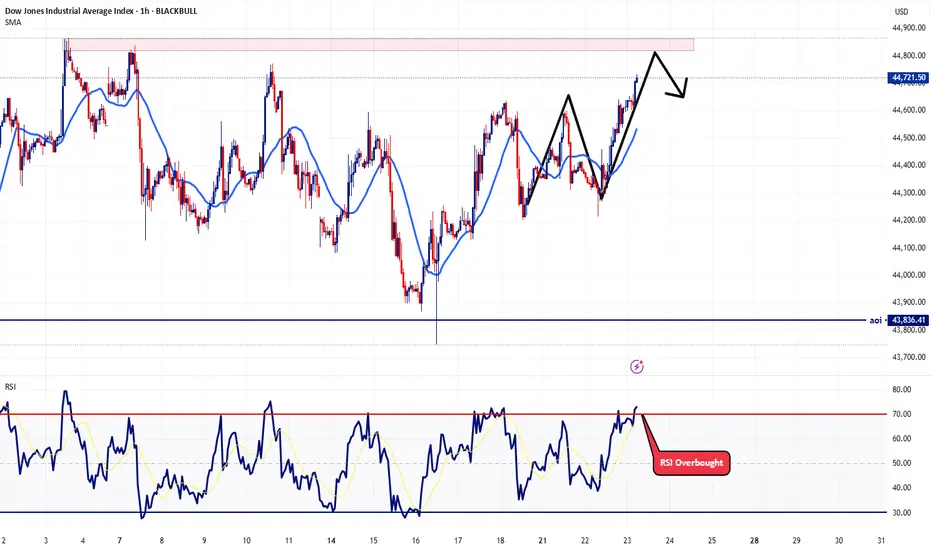
US30 Holding Above Key Pivot – More Upside Ahead?US30 – Overview
The price has stabilized within the bullish zone after holding above the key pivot level at 44170, indicating continued upside momentum. As long as the price remains above this level, we expect a move toward the next resistance at 44360, with potential for an extension toward 44610. A confirmed breakout above 44610 on the 1H timeframe could open the path toward the next resistance at 44730.
However, a 1H close below 44170 may trigger a short-term correction toward 43960.
A break below 43960 would shift the bias to bearish, with further downside likely toward 43785 and potentially 43630.
Resistance: 44360, 44610, 44730
Support: 43960, 43785, 43630

Us30S30 is currently respecting a key support zone, showing strong buyer interest. As long as this level holds, the bias remains bullish, with potential for price to push higher toward the next resistance levels.
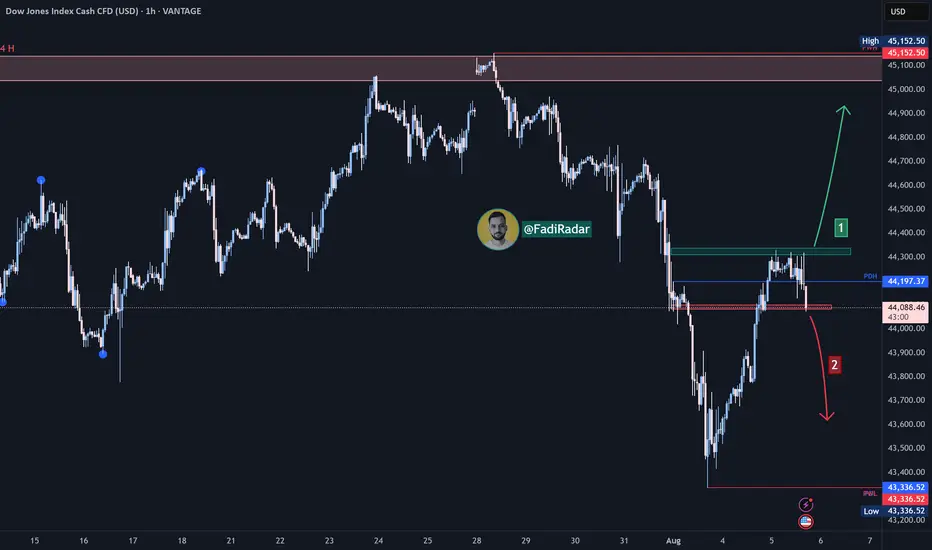
08/05/2025📍 US30 Technical Breakdown – 08/05/2025
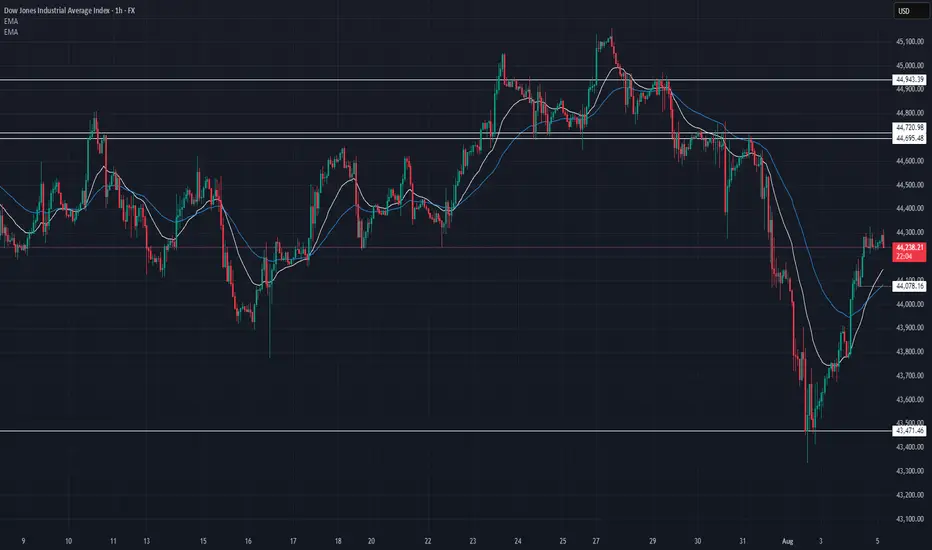
US30 bounced hard from the 43,500 lows and is now trading near 44,250, reclaiming key short-term moving averages. The index is approaching a major resistance zone around 44,600–44,720, where sellers previously stepped in.
Momentum is shifting in favor of bulls, but this move could stall unless we see a clean break above the previous breakdown levels.
📊 Current Market Behavior:
📈 Strong bounce off 43,500
📊 Trading above EMAs — short-term momentum bullish
🧱 Resistance overhead at 44,600+
⚠️ Potential lower high if bulls fail to reclaim 44,720+
📌 Key Levels:
🔹 Resistance Zones:
44,300 → Intraday resistance (current level)
44,600–44,720 → Key breakout test zone
44,943 → Major rejection point
🔹 Support Zones:
44,078 → EMA confluence support
43,600–43,500 → Bounce zone
43,471 → Prior low
🧠 Bias:
📈 Neutral to Bullish Intraday
Buyers in control short term, but critical resistance ahead. A failure at 44,600–44,720 would favor reversion. Breakout = bullish continuation.
Will The Soft NFP Data Resume the Strength of Dow Jones?Macro approach:
- The Dow Jones Industrial Average advanced this week, rebounding strongly as risk appetite improved following last week’s pullback, supported by a soft jobs report and easing global tariff concerns.
- Sentiment was aided by the Fed’s increased hopes of a near-term rate cut after Non-farm Payrolls missed expectations, prompting a 1.3% surge on Monday. Broader market sectors responded favorably to resilient earnings and softer economic prints.
- The index may remain sensitive to upcoming US inflation data, US service sector data and Fed communications, with labor market softness and further trade headlines poised to influence direction this and next week.
Technical approach:
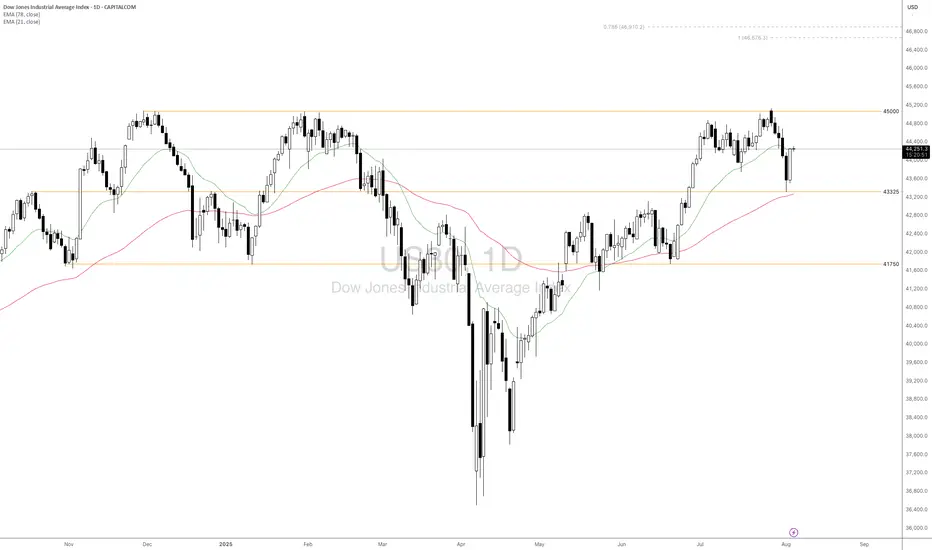
- US30 significantly rebounded yesterday, erasing half of the losses from the last 5-losing streak last week. The price is hovering around EMA21, indicating a short-term sideways momentum and await for an apparent breakout to determine the trend.
- If US30 breaks above key resistance at 45000, the price may surge further to test the Fibo Extension confluencing area around 46800.
- On the contrary, failing to hold above the support at 43325, confluence with EMA78, may prompt a deeper correction to the following support at 41750.
Analysis by: Dat Tong, Senior Financial Markets Strategist at Exness