US30 WILL FALL|SHORT|
✅DOW JONES is set to retest a
Strong resistance level above at 41,000
After trading in a local uptrend for some time
Which makes a bearish pullback a likely scenario
With the target being a local support below at 40,000
SHORT🔥
✅Like and subscribe to never miss a new idea!✅
Disclosure: I am part of Trade Nation's Influencer program and receive a monthly fee for using their TradingView charts in my analysis.
DJI trade ideas

Bear sell off to bull support areaLooking like we may see a sell off to bull support. Price starting to break down in the area of the original sell off of the descending channel that had strong bears present.

Fool Me Once, Fool Me Twice!What a week, our last idea had a neutral stance and correctly so, volatility was extreme. We did know a bottom of sort was in the making or at least temporarily...now the bounce and where to?
If you have not already realised, any ideas other than Trump caused the recent world mayhem, then you are in denial. Any little respect for this Trump quickly evaporated this week as he reversed his lunacy for 90 days pause..make no mistake, the writing is on the wall now, the markets have shown their hands.
He is merely an actor, it's all a theatre and by design...some well informed individuals made a killing on puts and calls the past two weeks at the mass expense of everyone else.
This rally is a rally to sell, expect a push up to 41700-41900 area, no doubt the game has changed, markets topped with a double top back in January, we have only had the first minor wave 1 down and wave 2 up is in progress and to be followed by a severe wave 3 down...rallies are now sold.
Expect a recession declaration in 3-6 months, expect mass fiat printing to come as a wrecking ball takes apart a market that was priced for perfection...what took a few years to build can be taken out completely in a few short weeks, we were there in 2008.
Gold and especially silver were hammered last week, gold quickly shrugged off the fall and a quick minor wave 4 down has been left for dust in a powerful wave 5 up...this wave, very strong, I expect another week or so of rally before topping out, perhaps U.S $3400-500...silver is an economic precious metal and tied to the coming collapse...but it will bottom out and outperform gold in the end.
Summing up: expect a further rally in the Dow to conclude later next week, Gold to soar and top out also...Gold will have a big correction looming, wave 4 down which could last months, thereafter a rally of historic proportions which will align with QE and systemic failures.
Don't be on the wrong side of whats coming, ignore the mainstream media mouth pieces and trust nothing, especially politicians and banks.
Appreciate a thumbs up, God Bless you all and good trading!

US30 pullback the overall bearish trend still in play. However, we are in a pullback to the upside where I will expect a reversal at the rejection block identified in the chart.
The idea is for educational purposes and should not be construed as an investment advice.

us30 bullishI'm back again with nice setup for us30 bullish movement up we go no looking back, break and retest support level.

Hanzo | US30 15 min Breaks – Will Confirm the Next Move🆚 US30
The Path of Precision – Hanzo’s Market Strike
🔥 Key Levels & Breakout Strategy – 15M TF
🔥 Deep market insight – no random moves, only calculated execution.
☄️ Bullish Setup After Break Out – 40800 Zone
Price must break liquidity with high volume to confirm the move.
☄️ Bearish Setup After Break Out – 40400 Zone
Price must break liquidity with high volume to confirm the move.
🩸 15M Time Frame Confluence
————
CHoCH & Liquidity Grab @ 4850
Key Level / Equal lows Formation - 40400
Strong Rejection from 40790 – The Ultimate Pivot
Strong Rejection from 39900 – The Ultimate Pivot
🔥 1H Time Frame Confirmation
Twin Wicks @ 40500 – Liquidity Engineered
Twin Wicks @ 39850 – Liquidity Engineered
Twin Wicks @ 40800 zone – Liquidity Engineered
☄️ 4H Historical Market Memory
——
💯 2024 – Bearish Retest 38000
💯 2024 – Bearish Retest 37600
👌 The Market Has Spoken – Are You Ready to Strike?

Long Term Market PredictionThis is based on 5 different indicators along with a deep analysis using AI. Based on repeating patterns. We see a 50% gain before dropping down to a 25-50% retracement of the total span, then a 100% gain from initial starting point at intervals. Looking at bar length:
From 1,400 up to 11,700 is +10,300
From 1,200 up to 6,400 is +5,200 (about half of 10,300)
From 2,600 up to 5,400 is +2,800 (about half of 5,200)
Seeing that these upward moves appear to be roughly halving each time, the next “up” might be around half of 2,800, i.e. about +1,400. Adding 1,400 to the most recent term (5,400) gives
5,400
+
1,400
=
6,800.
5,400+1,400=6,800.
So a plausible next term (if we follow that decreasing-up-jump idea) is around 6,800 bars. This concludes how we will get to the next increase - though much slower than the previous 2.

Price Action: Dow Jones Index DJI Monday 4/14/2025In this video, we will be looking at the Daily Chart for the Dow Jones Index (DJI) and its potential price action forecast for Monday 4/14/2025.

Update to Dow Jones Industrials Time At Mode Back in 2015 I had published a chart with annual data for the Dow Jones Industrials. I will provide a link at the bottom.
The research for this patterning is something I did myself by hand using pencil and paper back in the 1980's. These patterns show up in all time frames.
There is plenty of room to enhance the research on this technique and a group of us gather in the chat rooms here at TradingView to discuss new trades that set up and point out when trades expire.
Notice how these two grey boxes (which are both 50% drops in price) that expand wider in time from the 1960's to the 1980's and the 2000-2010's had a multi-year trend, followed by a monster crash (1987 was 40% and 2000 was 37%) and then just two+ years later there was a secondary bear market of 20% in 1990 and 22% in 2022. Keep in mind this is just for the DJ:DJI and not the Nasdaq Composite or S&P500 which were greater corrections.
The 11-year time frame of the 1999-2011 pattern allows for an 11-year rally from 2012 (which was year 1 of the 11-year rally) shows that time expired. As you can see from the 1943-1962 trend, a smaller 5-year mode formed at the end of the 20 year trend and then the market peaked in 1972-1973 when time expired for the second, smaller mode.
I had to reconstruct this chart after the data for the previous chart changed symbol. See the link below to see the original.
I look forward to your additional research onto this pattern and its implications to the idea that we are in a similar period to 1993-1994 with rally years of 1996, 1997, 1998, 1999 and 2000 ahead of us.
All the best,
Tim
October 19, 2024 3:31PM EST

US30 BUY NOW!!!!!!US30 formed a double bottom pattern on the sell side with a retest am looking forward to see price come to my target region which will be my buy side liquidity area at 42,800

US30 Trade Update – 14/04/2025🚨 US30 Trade Update – 14/04/2025 🚨
📈 Dow Jones Back in Bull Mode!
US30 has surged back above 40,600 and is now approaching the key resistance at 40,860. Bulls are pressing higher, but price is now near a critical decision point.
🔍 Key Observations:
✅ Strong recovery from 36,743 support
✅ Higher highs + bullish EMA crossover
🔺 Resistance ahead at 40,860 → 41,200
🎯 Trade Plan:
🔹 Long above 40,860 → Target 41,200
🔻 Short only if price rejects 40,860 & drops below 40,450
🔹 Wait for breakout confirmation — no rush!
⚠️ Momentum favors bulls, but 40,860 is the gatekeeper. Let price prove itself.

Beyond the Noise: US30 Analysis and Actionable Trade Ideas.Technical Analysis: US30 (Dow Jones)
📊 The US30 index is currently displaying a bearish trend on the weekly timeframe. We're observing a strong rally followed by a pullback into equilibrium when measured against the previous price swing range.
🔍 At present, the index sits in a premium zone, creating conditions where short positions may be accumulating for potential downside movement. However, market sentiment remains highly susceptible to external factors, particularly political statements and social media activity from key figures like Donald Trump.
⚠️ Given this unpredictability, a more prudent approach involves shifting focus to lower timeframes and following price action signals directly. The 30-minute chart presents a defined range that offers potential trade opportunities.
💡 Trade Idea: Monitor the current range on the 30-minute timeframe. A decisive break above the range could signal a long entry opportunity, while a break below may indicate a short entry position.
📈 This range-breakout strategy allows traders to adapt to market conditions rather than attempting to predict overall market direction, which has proven increasingly challenging in the current economic and political climate.
Not financial advice.

The Federal Reserve continues to tackle inflation🧠 Fundamental Analysis:
The Dow Jones (US30) experienced significant volatility in Q1 2025, with a slight decline due to economic challenges.
Major companies like Coca-Cola and Goldman Sachs are expected to report Q1 earnings this week, and these reports could have a big impact on the index’s movement.
The Federal Reserve continues to tackle inflation, which supports expectations for potential rate cuts later in the year, helping to support the markets.
However, high inflation and ongoing geopolitical tensions may put pressure on economic growth.
💬 Sentiment Analysis:
Market sentiment is currently mixed; there are concerns about a possible recession, but the market is also looking forward to potential monetary easing by the Fed.
Despite the economic pressures, there is limited optimism that the markets may see a recovery as Q2 2025 begins.
The market may experience volatility due to increasing concerns about inflation and corporate earnings, but overall, there is sentimental support in anticipation of clearer economic data.

US30 BUY CorrectionsPotential for a bullish pullback on the US30 1D which could lead to a price movement towards the resistance level at 40600. BUY levels from 37800

US30US30, after giving us push up last week is correcting and is still not done with correction. We need some down side before push up again.
Disclosure: We are part of Trade Nation's Influencer program and receive a monthly fee for using their TradingView charts in our analysis.

Moustafa! My analysis and view for US 30! on 16.03.2025!- I expected a huge bearish wave would hit the index by end of December and also in January and I sat an idea for it and it was right and that is the new idea
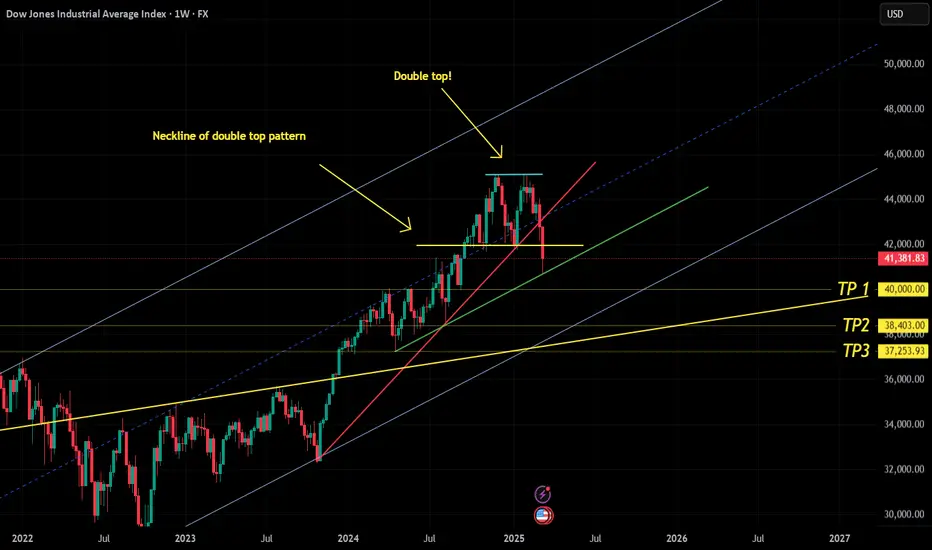
- On the weekly frame, you would notice that the index is in a rising channel
- Formed a double top pattern and even broke the neckline of it and is supposed to go to minimum the Take profit 2 then after the retrace towards the take profit 3
- The index retraced to the upside due to the uptrend line in green and there is a possibility that it could continue the bullish run but I do not expect here that a weekly candle would close above the neckline before reaching to the below TPs
- The lower weekly candles wicks from 15.04.2024 and 05.08.2024 must be filled anyway, which is giving another confirmation to the validation of this idea concept and the continuation of the bearish wave on the weekly chart! we could see on the way some retracements on the daily frame and the lower frames, but that will not have any influence on the bigger bearish image!
- The index had broken already the uptrend line (in red) which was not broken from October 2023! and the last week candle closed under the moving average 50!
- By reaching to the TP3, means that the index would go to the lower line of the rising channel
-- Conclusion is that we are in a bearish market on the weekly chart and the real target is exactly when the index will reach to the line (in yellow)
I sat also another idea for Nasdaq
which I see also there the continuation of the big bearish wave on the weekly chart! so feel free to have a look on too! so all is going in harmony together!