NASDAQ Initiated a standard short-term Bull Cycle.Nasdaq (NDX) has been trading within a Channel Up ever since the November 2008 bottom of the U.S. Housing Crisis. The recent Trade War correction that started early this year, bottomed just before the 1W MA200 (orange trend-line) and rebounded.
As this chart shows, every break below the 1W MA50 (blue trend-line) has technically started a new Cycle. During this 16-year pattern, we have seen two types of Cycles, a short (blue Rectangle) and long (green Rectangle).
Based on the sequence since the start of the Channel Up, the index should have now just initiated its new short Cycle. Both previous ones peaked on the 1.786 Fibonacci extension before a correction below the 1W MA50 again. As a result, we expect to see 28000 at least before the next meaningful technical correction.
-------------------------------------------------------------------------------
** Please LIKE 👍, FOLLOW ✅, SHARE 🙌 and COMMENT ✍ if you enjoy this idea! Also share your ideas and charts in the comments section below! This is best way to keep it relevant, support us, keep the content here free and allow the idea to reach as many people as possible. **
-------------------------------------------------------------------------------
💸💸💸💸💸💸
👇 👇 👇 👇 👇 👇
NDX trade ideas

USNAS100 – Bearish Bias Below 21780 Ahead of CPI and Trade TalksUSNAS100 – Bearish Pressure Below 21780, CPI & Trade Talks in Focus
Overview:
USNAS100 remains under downward pressure ahead of a key macro week, including US-China trade talks and the upcoming US CPI data.
Technically, price remains bearish while below the pivot level at 21780.
A break below 21635 may lead to further downside toward 21470 and potentially 21360.
On the upside, a 1H close above 21780 could invalidate the bearish view and open the path toward 21920 and the ATH at 22200.
Key Levels:
Pivot: 21780
Support: 21635, 21470, 21360
Resistance: 21920, 22200

Workforce participation is declining, government debt is risingWorkforce participation is declining, government debt is rising. Are we seeing the makings of major military conflicts?
This chart shows two key economic indicators for the U.S. from 2001 to 2025:
- U.S. labor force participation rate: the percentage of the working-age population that is either employed or actively looking for work.
- U.S. government debt as a % of GDP: the ratio of total federal debt to the country’s gross domestic product (GDP), but the scale is flipped - meaning higher debt appears lower on the graph, and vice versa.
What does “government debt as a % of GDP” mean?
This ratio shows how much the government owes relative to the size of the entire economy. If the ratio grows, it means debt is rising faster than the economy. The debt-to-GDP ratio surged sharply after the 2008 crisis and again during the COVID-19 pandemic. By 2024, it reached around 124% and is expected to keep rising. Since the chart uses an inverted scale, the red line drops lower as debt increases.
This graph clearly illustrates an inverse relationship between labor force participation and government debt as a share of GDP:
As workforce participation declines → government debt grows. This pattern is especially visible during major economic shocks like the 2008 crisis and the 2020 pandemic.
Why does this happen?
- Economic downturns: when fewer people are working or job-hunting, economic growth slows, tax revenues fall, and the government tends to borrow more to support the economy and social programs.
- Demographic shifts: as the population ages (e.g, baby boomers retiring), fewer people remain in the labor force. This slows down growth and increases the strain on government programs, which also drives up debt.
- Government policy: during times of crisis, the state often increases spending - and thus borrowing- to support the economy, pushing the debt-to-GDP ratio higher.

US100This is simply a breakdown of structure on a lower timeframe, and it makes sense to me that it could potentially shift to the upside.
US100I noticed this structure on US100 earlier this morning, and it was just too intriguing for me not to participate. I executed the idea with a short-term buy, but I won’t be holding for too long as I see uncertainty with the USA in general.
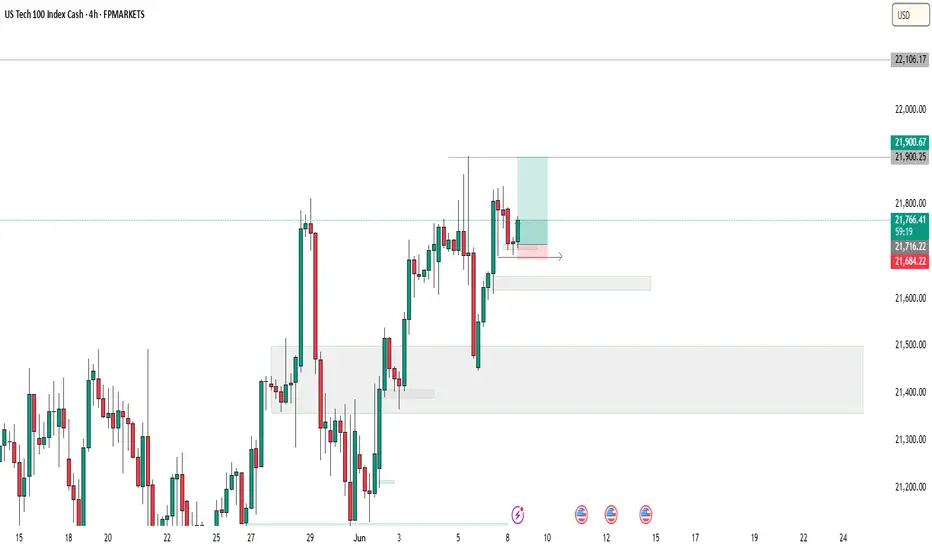

NAS100 - Will the stock market reach its previous ATH!?The index is above the EMA200 and EMA50 on the 4-hour timeframe and is trading in the specified pattern. In case of a valid break of this range, I expect a new trend to form. It is better to wait for confirmation on the break in order to control further risk.
U.S. President Donald Trump announced that an American delegation will meet with Chinese representatives in London on June 9 to discuss a potential trade agreement. In a post on Truth Social, Trump stated, “I’m pleased to announce that Treasury Secretary Scott Bessent, Commerce Secretary Howard Lutnick, and U.S. Trade Representative Jamieson Greer will meet with Chinese officials on Monday, June 9, 2025, in London to discuss a trade deal.” He added that he expects the meeting to go “very well.” U.S. stock markets rose on Friday, and Chinese markets are now following suit. The Hang Seng Index has reached its highest level since March.
Meanwhile, Amazon has completely halted its hiring budget for office workers in its core retail business. This decision applies only to white-collar staff and excludes warehouse employees and those in its cloud computing division. According to Business Insider, which cited internal company emails, the hiring freeze affects Amazon’s online marketplace, logistics operations, and grocery business.
Having doubled its workforce between 2019 and 2021 to 1.6 million, Amazon reduced that number to 1.55 million last year. Since late 2022, the e-commerce giant has laid off at least 27,000 employees.
This move comes as the U.S. jobs report released Friday helped ease some concerns, though signs of broader economic challenges remain. Experts suggest that such a hiring freeze could reflect broader economic trends—where mass layoffs are avoided, but hiring slows down significantly.
In May, the U.S. economy added 139,000 jobs, down from 147,000 in April. The unemployment rate remained steady at 4.2%, staying within the narrow range it has held over the past year. The labor market has remained resilient, dismissing fears that tariffs would cause a significant slowdown. So far, tariff-related disruptions have not been severe enough to destabilize the job market—at least not in May.
Data indicates that employers continue to refrain from layoffs, even as hiring has slowed considerably compared to the post-pandemic surge. Labor market analysts expect signs of weakness to emerge in the coming months, as businesses become more cautious about hiring due to uncertainty surrounding tariffs—according to recent surveys. For now, however, the labor market remains strong.
The absence of red flags in employment may give the Federal Reserve more room to maintain its patient stance on interest rate cuts. This year, Fed officials have kept interest rates higher than average to curb inflation by increasing borrowing costs. The Fed’s dual mandate is to keep inflation low and employment high, and it may opt to cut rates to stimulate the economy if the labor market weakens.Fed Chair Jerome Powell and other FOMC members have said they are waiting to see whether President Trump’s trade wars will stoke inflation, trigger job losses, or both. So far, neither scenario has materialized. Strong labor market data may give them further justification to stay in wait-and-see mode. Rosner wrote, “Given the Fed’s sharp focus on inflation risk management, today’s stronger-than-expected jobs report is unlikely to alter its patient approach. We expect the Fed to remain on hold at this month’s meeting and believe further deterioration

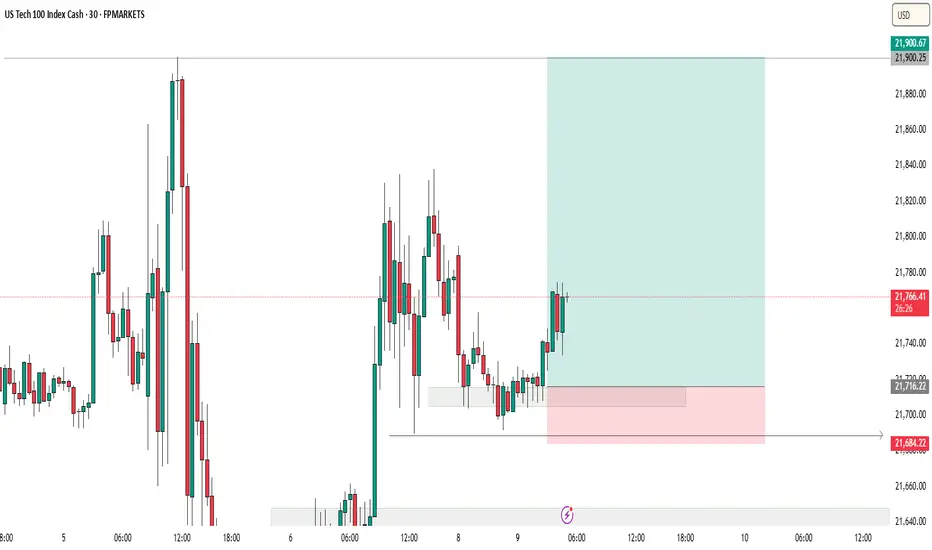
NASDAQ failed to capture hourly fair value gap multiple times.The US100 index failed to close a body above the hourly fair value gap multiple times. I would expect it to go towards sellside liquidity marked on the chart after multiple failed attempts at closing above an important level .

SELL NAS100This is my analysis of NAS100. These are the sell confirmations:
1. Doble top
2. Double top aligned with Fair Value Gap
3. Currently retesting the neckline of the double top
4. The trendline has been touched 3 times and therefore it is a weak trendline. It will be broken.
5. Please do not follow my take profit positions - when your profits make you smile, close the trade.
Trade what you see and not what you feel!

Indices Breakdown (US30-S&P500-NASDAQ)Market Outlook:
- Indices: Bullish trend emerging, potentially set to challenge or surpass recent highs in the coming weeks.
- USD: Bearish confirmation supports the bullish case for indices, as a weaker dollar often boosts market sentiment and drives stocks higher.

NASDAQ Still failing to secure meaningful closes above the rangeAll explained in video. Please let me know if there is anything I may have missed in this analysis.
Thanks and share with anyone who may be interested 🔓

NASDAQ TRADING ROADMAP 09 - 13 JUNI 2025📊 NASDAQ TRADING ROADMAP
Trade Plan & Market Outlook
The NASDAQ is currently trading within the H4 Supply Zone (21767.00 – 22158.00) after a bullish rejection from the H4 Demand Zone (21524.00 – 21404.00).
🔹 Key Zones to Watch:
🟩 Demand Zones:
H4 Demand: 21524.00 – 21404.00
Strong H4 Demand: 21136.00
Daily Demand: 20740.00
🟥 Supply Zones:
H4 Supply: 21767.00 – 22158.00
Daily Supply: 21736.00
🔹 Market Outlook & Scenarios:
If price breaks out above the H4 Supply Zone (21767.00), there's potential for a continued rally toward the strong Supply at 22158.00
However, if price gets rejected from this supply area, a pullback may occur toward the H4 Demand Zone (21524.00 – 21404.00), and possibly extend lower to the strong Demand at 21136.00
📌 Monitor price action closely around the current supply area.
Wait for breakout or rejection confirmation before entering trades, and always manage your risk properly.
⚠️ DISCLAIMER ON
This content is for educational purposes only and does not constitute financial advice.
Trading involves substantial risk and may not be suitable for all investors.
Always conduct your own analysis and apply appropriate risk management strategies.

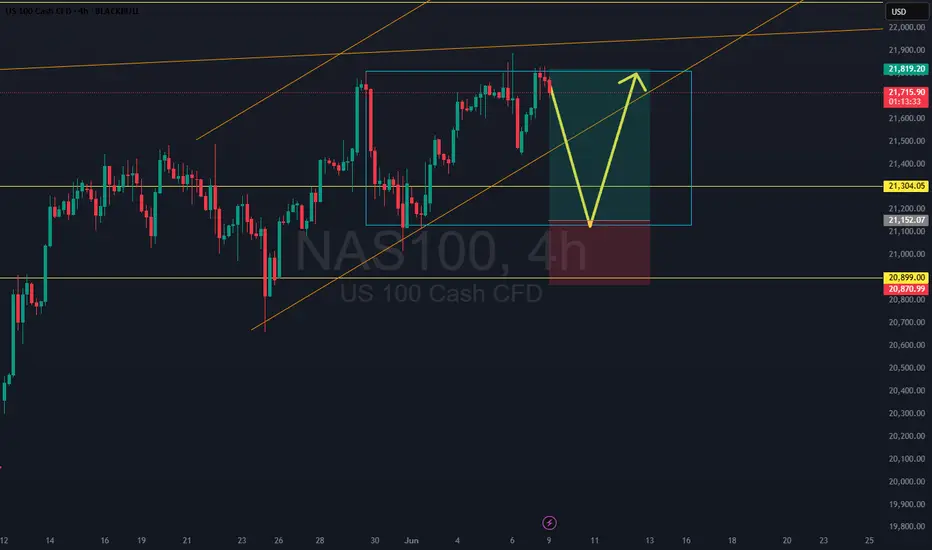
NAS100 Range Low Entry Aligned With TrendNAS100 is stuck mid-range on the 4H — neither pushing up nor breaking down. This idea plays it safe: placing a long at the bottom of the range, aligned with the overall bullish trend. If the channel holds, this may never trigger — but if it does, we ride it to the highs.
NASDAQ Potential UpsidesHey Traders, in today's trading session we are monitoring NAS100 for a buying opportunity around 21,300 zone, NASDAQ is trading in an uptrend and currently is in a correction phase in which it is approaching the trend 21,300 support and resistance area.
Trade safe, Joe.

NASDAQ 100 Long up to 22,000 then shortLooking for the short around 22,000-22,1000 region. Only valid on bearish PA confirmation. Looking for that 1,500+ point downside move. Some target in between.

NQ tumbles?Good day traders, I don't know why but I get a bit scared when it comes to analyzing NQ. I always doubt myself with it.
On the weekly TF price is trading inside an order block and for the past two weeks price has visited the order block two times. In the two times that price revisited the order block it failed to close above the midpoint indicating the strength of the order block, going into the new week I am going to use the discount zone of the OB+ as my resistance.
On the daily TF before I say much, THERE IS A GAP, and price did not trade to it since opening high on the 12th May. That gap is my target and I want to see price go and fill that volume imbalance as ICT calls it.
Still on the daily TF...when you read price for past two weeks on NQ, you'll quickly come to a realization that price has been expanding higher since Tuesday 3rd June, but expanding to where?...well liquidity resting above the high of the candle booked on the 29th of May.
Now on the 4 hour TF things are opening up and price is becoming clearer and it goes to show the importance of multi time frame analysis. The lows of Tuesday and Thursday make the relative equal lows that are shown on the chart. The internal liquidity shown below is my short term target or TP1. The red triangle represents that 4H inverse FVG and once price is trading below the inverse any movement inside that inverse should show weakness!

US100Hey traders ,Here is US30 1H Analysis for tomorrow
This is only my personal analysis
Buy / Sell at your own risk

US100 (NASDAQ)🔍 Short-Term Outlook (Next Few Days)
✅ Structure Highlights:
Market recently made a Higher High (HH).
Strong bullish BOS occurred after reclaiming the $21,600 zone.
Currently trading inside the brown supply zone (Area of Interest) between $21,775–$21,839.
0.236 Fibonacci retracement is holding as support — a sign of bullish control.
🟢 Short-Term Bullish Signals:
Strong bullish momentum with higher lows and internal BOSs.
If price breaks and holds above $21,839, the market may rally toward:
Target 1: $22,000
Target 2: $22,150 (psychological level)
⚠️ Short-Term Bearish Scenario:
If price gets rejected from the current supply zone:
Pullback expected toward $21,670 (0.382) or $21,597 (0.5 Fib)
Further dip to $21,500–$21,400 is possible if buyers fail to hold structure
📉 Short-Term Bias: Bullish with a possible pullback
Enter long on pullback to 0.382–0.5 Fib with bullish confirmation
Avoid fresh longs if price shows strong rejection at $21,839
📈 Long-Term Outlook (1–4 Weeks)
🧠 Macro Trend:
Consistent bullish structure from below $19,000 in early May
Every correction has been shallow with strong continuation
As long as $21,400–$21,200 holds, macro trend remains bullish
📊 Long-Term Fib Zones:
0.5–0.618 retracement (strong accumulation zone) = $21,400–$21,250
Last confirmed Higher Low (HL) at ~$21,000, structure break below this = trend invalidation
💡 Long-Term Bias: Strong Bullish
Any correction into the green AOI or Fib zone = potential long opportunity
Next upside expansions could target:
$22,500
$23,000

NAS100 Is Bearish! Short!
Take a look at our analysis for NAS100.
Time Frame: 9h
Current Trend: Bearish
Sentiment: Overbought (based on 7-period RSI)
Forecast: Bearish
The market is on a crucial zone of supply 21,771.1.
The above-mentioned technicals clearly indicate the dominance of sellers on the market. I recommend shorting the instrument, aiming at 20,767.2 level.
P.S
Please, note that an oversold/overbought condition can last for a long time, and therefore being oversold/overbought doesn't mean a price rally will come soon, or at all.
Disclosure: I am part of Trade Nation's Influencer program and receive a monthly fee for using their TradingView charts in my analysis.
Like and subscribe and comment my ideas if you enjoy them!

NAS100...Ever The Bullish Instrument Part 39I know I sound like a broken record, however the NAS100's behavior does not make it easier for me to be anything different.
This historically bullish instrument only makes HL to HH's and will continue to do so unless there is a total collapse of the United States economy and the Monthly timeframe would then have to start making LH's to LL's...There would be more than enough time for one to make adjustments to trade that move if that scenario were to happen..
So for all you conspiracy theorists out there who are waiting for a sudden collapse of the markets...NOT GOING TO HAPPEN...
As I have said time and time again, ever sell that the market makes is only a temporary retracement to form a HL on a larger timeframe and so if you are really trading the trend, you just wait for your largest HL to be completed and then you enter your buy back to your HH...that is all that is required...plain and simple.
The sooner you master this practice is the faster you will see phenomenal results in your trading profits and the ease with which the markets produce profits.
Now for the real analysis:
1. The Lowest point of 2025 was made on 4/6/2025 @7:10 pm
2. That signaled the HL on the monthly timeframe.
3. Since then the price has been steadily climbing back towards the previous ATH so that it will break it and produce another ATH
4. Once this ATH has been made, the market will then start creating opportunities for another retracement however, only after the buy has been completed and all the necessary retests have been done
Entry and Exit points
1. Remember once you take your largest HL...your TP will be your HH
2. Once you TP on your HH...you wait for another largest HL to take another buy...
Remember this strategy requires patience and observation of every single timeframe and understanding how every single timeframe talks to each corresponding timeframe.
It does not happen overnight and by reading a few posts...
It requires constant practice and adjustments on your part.
So have another great trading week.
#oneauberstrategy
#auberstrategy
#whywewait
#zigzagtheory
#patience

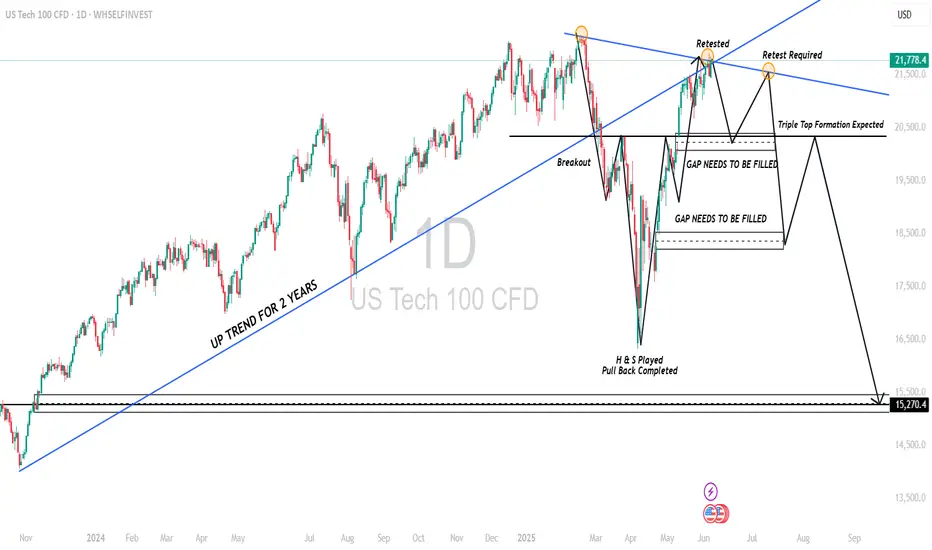
USTECH MAJOR DROP EXPECTED The price has been making higher highs and higher lows since the March 2025 low. Maybe New all-time highs about to happen but i think it's trend reversal , Next week is important if price doesn't break the trendline resistance and show weakness then i believe it's trend reversal.
NASDAQ100 TRADES AT HIGH!! POSSIBLE DECLINE IS EXPECTEDPrice experiences a resistance around the 21773 level. Technically, I anticipate a decline from that price level. a sell opportunity i envisaged if we begin to see seller step in the markket.

NASDAQBearish structure has formed, Waiting for further confirmation before looking for short positions.
SolarFX
