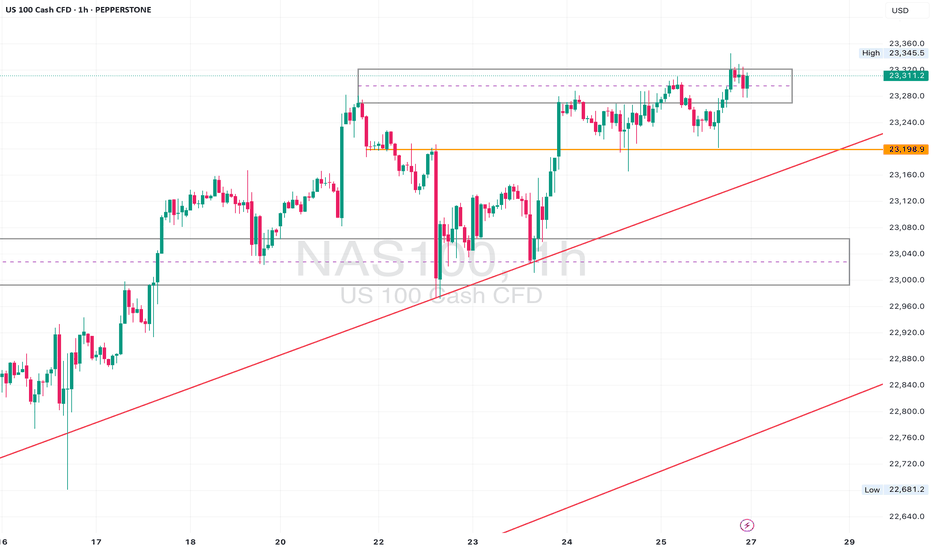
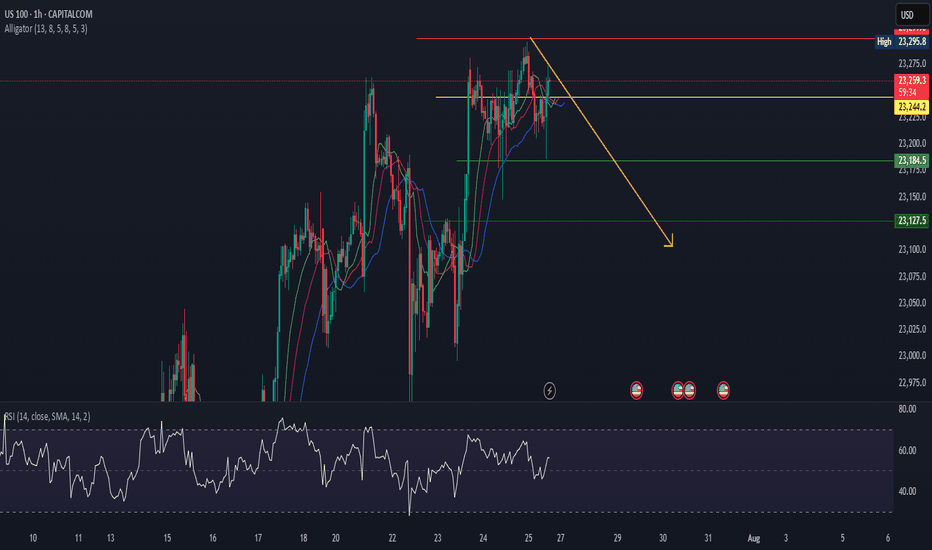
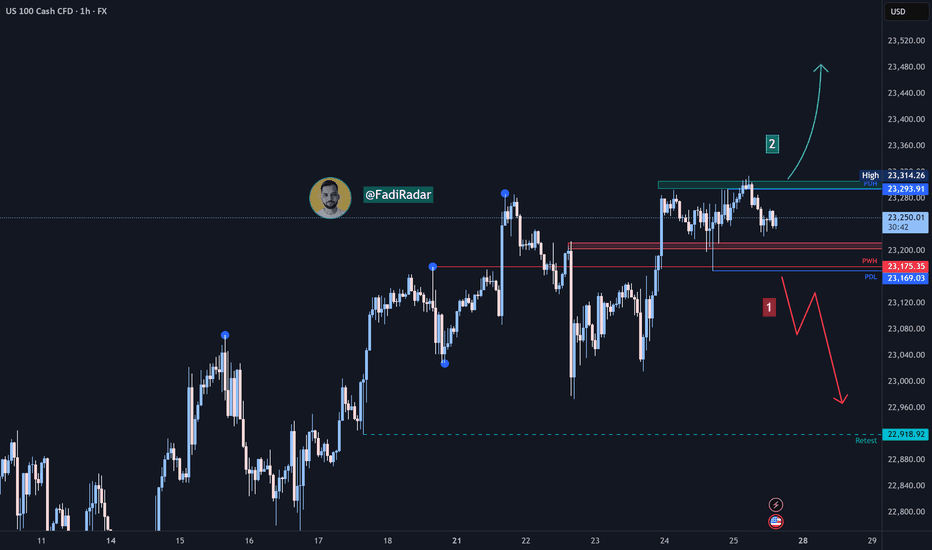
US100US 100 - Nasdaq Rising Wedge as an Corrective Pattern in Short Time Frame Break of Structure Change of Characteristics Completed " 12345 " Impulsive Waves RSI - Divergenceby ForexDetective4
Nasdaq analysis: 20-Dec-2024Good morning, traders! Today's Nasdaq analysis will help you achieve your trading goals. Let's work together towards success.07:03by DrBtgar3
Why Gann's TIME Over PRICE Wins in Trading ?Most traders fail in the market because they only focus on PRICE. However, according to W.D. Gann's principles, TIME is MORE IMPORTANT THAN PRICE. Big institutions can manipulate price movements, but TIME is a fixed entity that cannot be altered. The attached graph illustrates a fundamental yet overlooked concept: 1. Y-Axis → TIME 2. X-Axis → PRICE In reality, every high or low in the market is pre-determined by TIME, not price. Gann's Astro methods use planetary positions, ascendants, and advanced mathematical calculations to predict EXACTLY when the next HIGH or LOW will form in intraday markets. Key Insights: 1. TIME as the Guiding Factor: - The market operates like a clock, where each move happens ON TIME. - Highs and lows form according to fixed celestial cycles, not random price moves. 2. Price Delivery Algorithm: - Price follows a delivery system that respects TIME. - Without understanding TIME, traders become gamblers. 3.Intraday Gann Astro Example: - With calculations based on ascendant planetary alignments, TIME of specific turning points in intraday markets can be predicted. - Example from the chart: - At (2,1), a TIME-driven HIGH forms. - At (4,-1), a LOW forms based on pre-determined calculations. 4.What Gann Astro Does Differently: - Combines planetary positions and mathematics to forecast turning points. - Helps traders trade WITH CONFIDENCE instead of guessing. - Predict highs/lows hours before they happen. Now here is the Gann Intraday Trade Example. You can clearly see on the chart that the TIME for the price reversal was already calculated using the secret Gann Astro principles and advanced mathematics. I precisely identified the reversal time at 07:45, and you can verify this on the software screen. This highlights the power of time-based analysis, where price movements align perfectly with pre-determined time calculations, offering a clear edge in the market. And now observe when the price was delivered — it formed a strong reversal precisely at the TIME I calculated, 07:45. Is this just a coincidence? Absolutely not. This is the real way the market algorithm delivers price. TIME IS MORE IMPORTANT THAN PRICE, and this proves the unmatched accuracy of time-based analysis over conventional price-focused methods. Why Traders Lose Without TIME Knowledge: 1. Traders rely on price patterns, indicators, and technical setups, ignoring the foundational concept of TIME. 2. TIME is constant and unchangeable, while price can be manipulated. 3. Without mastering TIME, traders are reactive instead of predictive. Here’s another LIVE trade execution I successfully completed this week, profiting $3,125 . The trade was precisely calculated 5 hours in advance, demonstrating the power of Gann Intraday Astro Trading. There is nothing else in the trading space that comes close to this level of precision and accuracy. Below, I’ve outlined the step-by-step analysis of my LIVE trade on GOLD using the Gann Astro principles and advanced mathematical calculations. This is a testament to how TIME, not just price, drives market movements, allowing you to predict turning points with exceptional accuracy. The chart clearly demonstrates how I calculated the price reversal a solid 4-5 hours in advance using the Gann Intraday Astro technique. The exact time of reversal was determined to be 6:45, purely based on TIME. Watch closely as I executed the trade relying solely on this precise calculation. This is further proof that TIME is the real driver, while PRICE remains an illusion manipulated by the market. LIVE TRADE ENETRY - TIME IS MORE IMPORTANT THAN PRICE What? Shocked? Clear your mind because this is the real way of trading, whether in swing or intraday. If you're not applying this, you're just gambling with no clue about what you're doing in the market. Those useless indicators and strategies that revolve solely around PRICE will only mislead you. The real truth lies in TIME, not PRICE—because TIME is fixed, and PRICE is just an illusion manipulated by the market. NOW let's understand how markets turn on TIME - In this chart, I’ve calculated each market HIGH and LOW with unmatched precision—something rarely seen in the trading space. By leveraging mathematical models, I pinpointed the exact TIME at which these highs and lows would form. Using advanced mathematical and astro models inspired by Gann, I employed techniques like Squaring the Range, ASC Distance, and the concept of TIME = PRICE. This principle means that when TIME equals PRICE, the market is compelled to reverse due to the fundamental laws governing its movement. It’s crucial to note that while price manipulation can occur, TIME remains immutable—making it the ultimate factor in accurate forecasting. By calculating the critical TIME entries that align with price, we unlock insights into market behaviour that traditional approaches simply can’t match. GANN INTRADAY TRADING - "The Hidden Truth: Why Gann's TIME Over PRICE Wins in Trading" In this chart, you can see the market reversing exactly at 21:05, a TIME I calculated in advance using Gann's astro intraday techniques. The method applied here is Squaring the Range—a concept rooted in understanding the range as the time zone where the price remains confined between two major HIGHs and LOWs. Using advanced mathematical principles in Gann astro analysis, I was able to determine the precise future reversal point. This allows me to approach my trading desk only at the calculated time and execute trades with confidence. This highlights why TIME outweighs PRICE in importance—while prices can be manipulated, TIME remains a constant and reliable indicator for market reversals. "GANN INTRADAY TRADING - Exposing Market Algorithms: Gann's TIME Secrets Revealed" Now, let me share some golden nuggets of hidden Gann intraday trading strategies. It doesn’t matter if the market is in consolidation—you can still profit if you know exactly when the market will break out of that consolidation phase and begin delivering price in a single direction, also known as expansion. In earlier times, markets were primarily influenced by market makers, but now, price delivery is controlled by algorithms designed to enhance liquidity. With the massive influx of participants in today’s market, these algorithms play a critical role in maintaining liquidity flow. Despite these changes, the core principle remains intact: the market still moves based on mass psychology. Using Gann Astro's hidden techniques, traders can gain an unparalleled edge. For example, I calculated the precise TIME when the market’s price delivery algorithm was set to initiate expansion in a single direction. This predictive ability highlights how mastering these techniques can transform the way you approach market movements. Here’s another example showcasing a bullish scenario using Gann techniques. Take notes carefully because such valuable insights into Gann intraday trading strategies are rarely shared publicly, especially with this level of detail. In this bullish setup, the focus is on identifying key time cycles when the price delivery algorithm aligns with Gann's mathematical principles. By leveraging time-based calculations, I pinpointed the exact moment when the market began expanding upward, indicating a strong bullish movement. This strategy not only highlights the power of Gann’s intraday techniques but also reinforces the critical importance of TIME over PRICE in trading. Mastering these principles can provide a significant edge, allowing you to approach the market with confidence and precision. In the trading world, most market participants focus solely on price while overlooking the critical element that governs market movements: time. Time is fixed, immutable, and unaffected by external manipulation, unlike price, which can be influenced by institutions and market forces. By understanding the concept that "time is fixed, price is an illusion," traders can unlock a method to predict intraday highs and lows with unparalleled precision. This is the essence of the Gann Astro methodology, which reveals the market's natural rhythm and turning points based on time. The power of time-based analysis lies in its ability to expose market manipulation and predict market moves before they happen. Time, unlike price, is the key to decoding the market clock and identifying the exact moments when highs and lows form. With a deeper understanding of this principle, traders can remove guesswork, anticipate market movements, and align themselves with the forces that govern price delivery algorithms. The result is a disciplined, research-backed approach that replaces gambling behavior with a structured trading edge, offering a new perspective on intraday market success. I don’t know if Trading View will recommend this idea to people, but honestly, it’s worth far more than the garbage that gets posted here—signals, scams, and all those misleading strategies that do nothing but trap people in a gambling mindset. If you’re reading this, let yourself know that you’re in the right place. Save this, share this, and help boost it so that this idea can reach more people and guide them toward learning the real way of trading in the market. If you have any questions or thoughts, feel free to comment below. You can also reach out to me—links are below this post, in my bio, or via private message here on TradingView. Let’s trade smart, not gamble!Educationby GannAstroTrader114
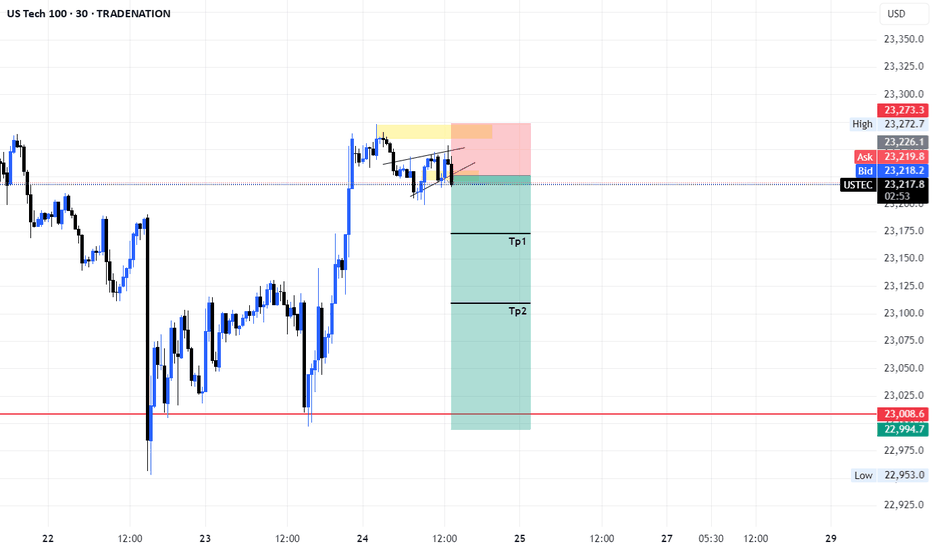
SELL NASDAQ I'm sharing with you a quick trade on NASDAQ, you can sell and target the same level as mine. Follow for more!Shortby YassineAnalysis3
NASDAQ-100 NEEDS MORE CLARITY TO MOVE INDEX FORWARD!Last week, the NASDAQ-100 established key levels for both sellers and buyers. As we head into the next trading week, price rejection at either of these levels will likely determine the index's direction. While the weekly outlook remains bullish, a bearish close this week could lead to further deterioration of the index. N.B! - NAS100USD price might not follow the drawn lines . Actual price movements may likely differ from the forecast. - Let emotions and sentiments work for you - ALWAYS Use Proper Risk Management In Your Trades #nas100usd #nasdaqby BullBearMkt4
US 100 Index – Fed to Bring Christmas Cheer or Fear?The US 100 has been on a roll over the last 2 weeks adding around 800 points or about 3.5% since its opening level of 20,950 on Monday December 2nd. This week however, the US 100’s December rally faces a tough test on Wednesday in the form of the Federal Reserve Interest Rate Decision (1900 GMT) and the Press Conference led by Chairman Jerome Powell (1930 GMT). Ahead of these events, it’s not so much the actual interest rate decision that stock index traders are nervous about, as the Fed are widely expected to cut rates another 25bps (0.25%) at this meeting. Their concerns are focused on whether recent resilient US economic data, sticky inflation readings and Trump taking office are enough for Fed policymakers to feel the need to slow the pace of rate cuts as markets move into 2025. Constituents of the US 100 index, often known as growth stocks, can be more sensitive to US interest rate changes, so this latest Fed meeting may have important implications for the US 100 index. This could well determine if the Tech sector is to see Christmas cheer in the shape of a ‘Santa rally’, or if the Fed Grinch is set to install fear and uncertainty into traders during the final 2 weeks of 2024. Technical Backdrop: Of course, it has already been a strong advance since the August 5th spike low, but what are the levels we can monitor into and over the announcement? Resistance Points to Watch While it has been a positive pattern of higher highs and higher lows in price for the US 100 index, resistance has been found at the trendline connecting highs since August 1st, which continued to limit last week’s attempts at strength. This line starts the new week at 21833, and the daily closing defence of this level will be watched closely. Successful closing breaks above this level, while not a guarantee of future price strength, may see a further phase of upside moves, once again pushing into uncharted territory of new all-time highs. Fibonacci extension measurements of the November 11th to November 19th correction, offers a possible first resistance level after the trendline, marked by the 38.2% extension at 22151. This may prove to be a stumbling block to any future advance, but if breached price activity could possibly test 23010, the higher 61.8% level. Support Levels If corrective themes emerge either into, or after the Fed announcement, a first support level to focus on could be 21286, which is equal to the 38.2% Fibonacci retracement of November 19th to December 13th strength. While this type of level has in the past limited price weakness, it may not again, but traders could be looking for this area to limit declines once more. If this first retracement support is unsuccessful in holding any weakness in price, the uptrend connecting the lows since August 5th downside extremes, currently stands at 21111. In the past this level has been able to hold and reverse selling pressure, so daily closes below this level, may be a sign of further price weakness materialising. The material provided here has not been prepared in accordance with legal requirements designed to promote the independence of investment research and as such is considered to be a marketing communication. Whilst it is not subject to any prohibition on dealing ahead of the dissemination of investment research we will not seek to take any advantage before providing it to our clients. Pepperstone doesn’t represent that the material provided here is accurate, current or complete, and therefore shouldn’t be relied upon as such. The information, whether from a third party or not, isn’t to be considered as a recommendation; or an offer to buy or sell; or the solicitation of an offer to buy or sell any security, financial product or instrument; or to participate in any particular trading strategy. It does not take into account readers’ financial situation or investment objectives. We advise any readers of this content to seek their own advice. Without the approval of Pepperstone, reproduction or redistribution of this information isn’t permitted. by Pepperstone12
Nasdaq market analysis: 19-Dec-2024Good morning! Join me for today's Nasdaq market analysis. Share your charts, ask questions, and let's discuss trading strategies.07:32by DrBtgar2
Approaching important resistance -161.8% (LOG)We are closing on important channel resistance and 161.8 extension from the previous high in November 2021. RSI 14 shows close to overbought. I expect a strong and healthy pullback to the bottom of the channel, but this correction could take a long time and drag to 2026.Shortby matejmn2
USTEC (NASDAQ 100) - Sell Limit Opportunity After Liquidity GrabUSTEC has reached a significant liquidity zone above resistance, offering a high-probability sell limit setup. This move suggests the market has cleared stop-losses and is poised for a bearish reversal. Key Observations: Liquidity Grab: The price spiked above a key resistance level, triggering stop-losses and trapping breakout buyers. Market Structure: Signs of bearish rejections and diminishing bullish momentum indicate a potential downside move. Optimal Entry: A sell limit at aligns with the liquidity sweep and anticipated reversal zone. Trade Plan: Entry: Sell limit at , targeting a move downward from the liquidity zone. Stop Loss: Above the liquidity sweep to protect against false breakouts. Take Profit: Targeting support levels around for an optimal risk-reward ratio. Risk Management: This setup uses the liquidity grab to pinpoint a strategic entry. Ensure disciplined risk management and proper position sizing. Monitor for bearish confirmation before executing the trade.Shortby Vusizwe_Capital3
NASDAQ - Trading Complex Pullbacks & Pennant PatternsThis video will teach you how to trade complex pullbacks. Concepts include: how to properly read a trend, breakout patterns, structure recognition & different entry techniques. From the fundamental side, we also examine how recent economic events, such as the FOMC Interest Rate decision, US government shutdown threats, and the Santa Clause Rally, have affected the markets. I wish you all a safe & happy holiday season! Akil Long05:41by Akil_Stokes2
Nasdaq trading zones: 18-Dec-2024Good morning, traders! As a seasoned price action trader, I'll share my Nasdaq insights to help you improve your trading skills. 06:54by DrBtgar2
NDX Is Very Bearish! Sell! Take a look at our analysis for NDX. Time Frame: 9h Current Trend: Bearish Sentiment: Overbought (based on 7-period RSI) Forecast: Bearish The market is approaching a significant resistance area 21,287.68. Due to the fact that we see a positive bearish reaction from the underlined area, I strongly believe that sellers will manage to push the price all the way down to 20,340.94 level. P.S The term oversold refers to a condition where an asset has traded lower in price and has the potential for a price bounce. Overbought refers to market scenarios where the instrument is traded considerably higher than its fair value. Overvaluation is caused by market sentiments when there is positive news. Like and subscribe and comment my ideas if you enjoy them!Shortby SignalProvider114
NasdaqOn daily timeframe the Market is Extremly bullish, and on strong support of pscychological level. And also on cot report we have more bullish net position than bearish once. And H4 we can see that it is also bullish,till 23000Longby Primus0725Updated 2
Potential bullish rise?NAS100 has reacted off the support level which is an overlap support that aligns with the 23.6% Fibonacci retracement and could rise from this level to our take profit. Entry: 21,426.87 Why we like it: There is an overlap support level that aligns with the 23.6% Fibonacci retracement. Stop loss: 21,119.53 Why we like it: There is a pullback support level that lines up with the 61.8% Fibonacci retracement. Take profit: 21,894.84 Why we like it: There is a pullback resistance level that aligns with the 78.6% Fibonacci retracement. Enjoying your TradingView experience? Review us! Please be advised that the information presented on TradingView is provided to Vantage (‘Vantage Global Limited’, ‘we’) by a third-party provider (‘Everest Fortune Group’). Please be reminded that you are solely responsible for the trading decisions on your account. There is a very high degree of risk involved in trading. Any information and/or content is intended entirely for research, educational and informational purposes only and does not constitute investment or consultation advice or investment strategy. The information is not tailored to the investment needs of any specific person and therefore does not involve a consideration of any of the investment objectives, financial situation or needs of any viewer that may receive it. Kindly also note that past performance is not a reliable indicator of future results. Actual results may differ materially from those anticipated in forward-looking or past performance statements. We assume no liability as to the accuracy or completeness of any of the information and/or content provided herein and the Company cannot be held responsible for any omission, mistake nor for any loss or damage including without limitation to any loss of profit which may arise from reliance on any information supplied by Everest Fortune Group. Longby VantageMarkets4
NAS/NQ are also preparing for the yearly transitionIf we are flexing daily Fib levels, I used the 21600 swing low as the base. If so we have achieved 75% today. It's also interesting that the volume profile POC (dashed) lies within the golden zone, which is also containing the Broken high retest point I believe we have down here over the next few weeks into mid January. Using the space between the broken support (breaker) and the new low as consolidation, we should be able to build a nice base for entry ticket into this coming year's candle highby HollywooodTrades3
Actionable Nasdaq insights: 17- Dec-2024Rise and shine, traders! Start your day with actionable Nasdaq insights. Let's grow your skills together, one chart at a time. 06:56by DrBtgar3
How to flip $2,000 into a million in a bubble. In this post I want to share with you an idea I've shared with my friends irl who have market exposure. Heading into the 2022 high I strongly encouraged my friends to sell stocks. We were heading into a multi decade resistance level and I'd put the odds somewhere around 80% there'd be a notable reaction to this level. Could be a pullback, could be a crash. If it's a pullback it's easy to get back in, not so easy to get out in a crash. So, no brainer. Late 2022 I started to tell them it was worth getting back in as long as they used good stop loss rules and then when we got to a 76% retracement of the 2022 drop I started to explain the concept I'll discuss in this post to them. First let's lay the groundwork for this. We can focus on the things we know. It's a known that indices have uptrended for a long time. And it's a known of trend development that trends do not get slower. A trend is always increasing in velocity. It goes up faster and faster and then when it comes down it comes down faster than it went up. This is always what happens. Trends speed up. Regardless of the direction. Now, in 2022 we hit a multiple decade resistance. This was evidenced by a local market top. Confirming the market also seems to care about this level. Whatever happens, this is likely to be a major pivot point in the trend. Either we'll top out here or well head into a stage of hyper overperformance. In this overperformance, we will likely see indices up 100% from the current highs. 200 - 300% is on the table, 100% is a number that would have high odds of hitting, based on historical breaks like this. And if the resistance is actionable, this could all come crashing down in a horrific way. If you accept these premises that the market is due to either crash up or crash down, then it makes no sense at all to have common stock exposure (Or whatever you prefer). If the long bet is wrong, you can take crippling losses and if the long bet is right you can make a lot more money betting on the hyper aggressive breakout. Around 4500 I started to tell my friends this. I told them if I was them I'd drop my stocks. Bank the profits on those and then I'd take 10 - 20% of what I'd made in profits and use these to buy a portfolio of aggressive OTM calls. My thinking here is if the market yanks, no big deal. SPX could drop 90% and my friends would take rather nominal losses. Giving back a fraction of what they made in the rally rather than seeing all their positions go from profits top negative. On the other side of the coin, if the breakout comes - they'd make a lot more on the calls than they'd make with common. Depending on aggression level, they'd make a crazy amount more. A rally similar to the Nasdaq breakout would translate as something like this on SPX. At this moment in time you can buy Jan 2027 calls for under $150. In the event this move happened, these would be worth min over $65,000. A bit under $75,000 if the move is completed faster and this is not even accounting for the potential of an IV boost if the market goes into hyper performance. $2,000 into a series of bets on that happening would return over a million in the event that it did actually happen. This is not without risk. The plan I proposed to my friends has one main risk and that is the market slowly continues to uptrend. Making good gains but not hitting the bubble conditions to make it realistic these deep OTMs actually trade (For context, the statistical probability of profit on these right now is 0.2% - something would have to change). In that scenario, they'd take some small losses on the call portfolio and they'd have missed out on whatever the gain of just owning the underlying asset would be. That's the potential cost of the bet. On the upside of that, my friends who had 10s or even 100s of thousands exposure to the bear move can covert this to a few grand risk and still make mega bank if the bubble thesis comes into play. If SPX hits the 100% move inside of 2 years, these calls pay somewhere around $25,000 per $130 risked. In the event this heads into a blow off event they start to get up to close to $100,000 on those positions. This is hyper high RR way to bet on a developing bubble. Ensure you do not have excessive losses in a crash and the price of this is basically you convert your bet into a bet that the market will not range. If the market ranges for a year or two, this idea suffers. I think this is the wise thing to do at this point if speculating in stocks. We're into a binary level in my opinion. A polarising decision will come in this area. The smart thing to do is to put a hard cap on risk exposure so all bearish tail events do not hurt you and have the potential to make 1,000s of % of profit in the event of a bullish tail event. I think the probability of a tail event in the coming years is high now. Rarely is the probability of a tail event high, but rarely do we test multiple decades of resistance in indices. There is so much that can be made or lost in a tail event, that it makes a lot of sense to think about how you can structure bets to survive or thrive in the different outcomes. If this proves to not be the end stages of a bubble, then I think it's only reasonable to assume we're actually somewhere in the middle of a bubble. Which means something exceptional is likely to come in the following years - whatever way this inflection point resolves itself. In my opinion, if you want to bet on continued up moves in indices, you might as well bet on a full fledged bubble. The odds of indices breaking resistance and slowly limping higher I consider super low. I think we reverse or we fly. I have my bets structured to benefit from either one. Longby holeyprofitUpdated 1111
NAS100USD: Capitalizing on Bearish Displacement!Greetings Traders! In today’s analysis of NAS100USD, the M15 timeframe shows a recent shift to bearish price action, marked by significant displacement to the downside. This displacement provides strong evidence of institutional sell order distribution, as seen in the large bearish candles that led to a bearish break of structure. Key Observations: 1. Premium Price Retracement: After the bearish break, price retraced into deep premium levels, where institutional arrays are present. These premium zones offer opportunities to seek confirmations for selling toward discount prices. 2. Breaker Block as a Key Zone: Price has retraced into a premium breaker block, a critical mitigation zone. What is a Breaker Block? Breaker blocks are mitigation zones created as institutions mitigate losses from opposing orders placed during the prior trend. Once price retraces to these zones, institutions close those losing positions and reinstate new orders to align with the prevailing trend. Trading Strategy: Entry: Look for confirmation at the premium breaker block to align with institutional order flow. Target: The primary target is the liquidity pool in discount prices, adhering to the principle of selling in premium and booking profits in discount zones, mirroring institutional strategies. If you have insights or questions, feel free to share them in the comments. Let’s analyze, learn, and succeed together! Kind Regards, The ArchitectShortby The_Archi-tectUpdated 3310
Downward correction followed with upward continuationNASDAQ is currently in a bull run, but seems to be fading and needing a correction to continue the upward trajectory. The below structures between 21800-21400, will be potential barriers of the bearish move, leading in towards a potential upward movement. Conversely, if price action stabilises below 21400 -21200, the movement will likely continue down. by Two4One41
iamtradingdon | NAS100 Market Daily Technical AnalysisWhile NAS100 CAPITALCOM:US100 continues to display a bullish trend, I closely monitor indicators suggesting a likely bearish shift. The price has been rejected by an uptrend line, marking this area as a significant institutional resistance zone. If the price drops and a bearish candle closes below 22180, I will establish my target at 21800.Shortby iamtradingdon1
Short Position - NASDAQShort Position Entry: Consider initiating a short position if the Nasdaq-100 Index falls below 21,000. Stop Loss (SL): Set a stop loss at 21,555 to manage potential losses.' Market Sentiment: The combination of the Federal Reserve's cautious approach and rising inflation may contribute to a weakening market sentiment, potentially leading to a downward movement in the index. his recommendation is for educational purposes only. Always consult your financial advisor before making any investment decisions. Stock trading involves risks, including the potential loss of capital. Ensure to evaluate your risk tolerance and conduct thorough research.Shortby KSLBroking1
Nasdaq 100: Sustained Uptrend with Strong Momentum SignalsChart Analysis: The Nasdaq 100 has maintained a steady uptrend after rebounding from its August low, respecting a rising trendline (black) and staying above key moving averages. Here's a breakdown of the key observations: 1️⃣ Trendline Support: The price has respected the ascending black trendline, acting as dynamic support during pullbacks. This showcases strong bullish commitment. 2️⃣ Fibonacci Projection: The price is approaching the 161.8% Fibonacci extension (around 22,694), a potential area for traders to watch closely for reaction. Extensions like this often serve as resistance in trending markets. 3️⃣ Moving Averages: The 50-day SMA (blue) remains upward sloping, while the 200-day SMA (red) confirms a long-term bullish structure. Price action staying well above these averages signals continued strength. 4️⃣ Momentum Indicators: RSI: Nearing 70, indicating strong momentum, though traders may watch for overbought signals. MACD: Bullish crossover continues, with rising histogram bars suggesting increasing buying pressure. What to Watch: Whether the price can sustain momentum towards the 161.8% Fibonacci extension level (~22,694). A healthy pullback towards the trendline or the 50-day SMA could offer clues for continuation patterns. Momentum indicators may warrant attention for short-term overbought conditions. The Nasdaq 100 remains firmly in an uptrend with bulls firmly in control. A break and hold above the Fibonacci extension would signal potential for further gains. Keep an eye on volume and momentum as price nears key levels. -MWby FOREXcom1
Technical Analysis of NASDAQ 100 Index (4-Hour Chart) Key Support and Resistance Levels Key Support Levels: The 20,566 level serves as the current support zone. This level is critical for determining the future direction of the index. If this level is breached, the next support lies around 20,250. Key Resistance Levels: The first resistance zone is between 21,329-21,381, which aligns with the 20-period moving average and acts as a significant hurdle for upward movement. Upon breaking this resistance, the next target is around 22,106, corresponding to the upper band of the Bollinger Bands indicator. Potential Scenarios 1. Bullish Scenario: If the price rebounds from the 20,566 support zone, the index is expected to initially move towards the 21,381 resistance level. A successful breakout of this level could push the index toward its next target at 22,106. Confirmation signals, such as bullish patterns or increased buying volume, would strengthen this scenario. 2. Bearish Scenario: If the 20,566 support zone is breached, the index could further decline toward the 20,250 level. Breaking this support would indicate significant market weakness and potential continuation of the downtrend. Indicator Analysis Bollinger Bands: The price has reached the lower Bollinger Band, typically signaling a potential reversal. However, continued downward movement is possible if the lower band is decisively broken. 20-Period Moving Average (Blue Line): This moving average acts as dynamic resistance. A breakout above this level may signal a short-term trend reversal. Conclusion and Trading Suggestions Considering the NASDAQ 100 index's position near the 20,566 support level, traders should watch for reversal signals. If confirmation of a rebound (e.g., increased trading volume or formation of reversal patterns) occurs, entering long positions near this area could be favorable. However, if this support is breached, it is advisable to avoid long trades and look for lower levels for market entry. Recommendations: Enter long positions near the 20,566 level with a stop-loss below 20,500. Initial upside target: 21,381. Manage risk by setting appropriate stop-loss levels and monitoring price behavior near critical zones. Longby arongroups1