USTECH bullish consolidation Long opportunityUSTECH is currently in a bullish consolidation from a 4 hour perspective. The 1 hour timeframe shows price is currently making a move to the upside which provides an intraday opportunity to trade to the upside. Confluences for the long position include the break and retest position at $21350 which has been tapped, price trading above the 50 SMA and volume currently testing the sweet spot region on the RSI between 45-55, indicating the end of the retracement an potential continuation to the upside
NDX trade ideas

NASDAQ Outlook: Waiting for a Catalyst in a Range-Bound Market!The NASDAQ NAS100 has shown impressive gains recently 📈, but overall sentiment remains cautious 😐 as the market consolidates and trades sideways in the short term 🔄. Investors seem to be waiting for a new catalyst—such as major economic data or policy announcements 📰—before committing to a clear direction.
Ongoing political and economic uncertainties, including trade negotiations 🤝, interest rate outlooks 💸, and valuation concerns 💰, are keeping market participants on edge. Given these factors, the near-term environment is likely to remain choppy and range-bound 🌊. As traders, it’s important to approach the markets with caution ⚠️, especially as equities approach key resistance areas 🚧. This uncertainty may also impact currency and other financial markets 💱. While tech stocks could eventually break out of the current range 💻, the direction is still unclear. Prioritize risk management and protect your capital during this period of heightened uncertainty 🛡️.
Political and economic uncertainties—like ongoing trade negotiations, interest rate expectations, and concerns about valuations—are keeping investors on edge.
The near-term outlook for the US100 is for choppy, range-bound trading as the market works through these uncertainties.


NAS100 - Massive Rejection at Supply Zone! Bearish Setup BrewingPrice has tapped into a clear Supply Zone and is showing signs of distribution.
Bearish divergence forming across momentum indicators (not shown here).
Price has failed to break new highs = Possible double top structure forming.
Arrows indicate potential downside targets if rejection holds.
---
💡 Trade Idea:
🎯 Sell Setup: Look for confirmation (e.g., break of short-term support or bearish engulfing) to target 19,185 → 16,948
❌ Invalidate if price breaks and closes above 21,785 with volume
---
📢 What do you think? Is NAS100 ready to drop? 💬 Drop your thoughts in the comments. 👍 Like & 🔁 Share if you find this helpful! 📈 Follow for more high-probability setups weekly.
#NAS100 #US100 #NASDAQ #TradingView #SupplyAndDemand #PriceAction #ForexSignals #BearishSetup #MarketAnalysis #SwingTrading #DayTrading #SmartMoney

NAS100 Bearish SetupHi there,
NAS100 looks bearish on the M15 timeframe but is currently hovering over a support zone.
The price has a potential bias toward 21,037.9 with two estimated price targets.
Happy Trading,
K.

The NASDAQ Fails to Break Out, Paving the Way for Lower PricesIt looked as though the Nasdaq 100 might break out last week, following a double boost from Nvidia’s surge after its results and news that a federal court had blocked US President Donald Trump’s tariffs. However, those hopes quickly faded, and the Nasdaq promptly reversed course. Now the index finds itself in a precarious position, as it appears to be preparing for a move lower.
The first thing that stands out on the Nasdaq 100 chart is the rejection of the breakout attempt on 29 May. As a result, the Nasdaq may be forming a double top pattern. The pattern still requires confirmation, which would come from a decline below the neckline at 20,900. A break of the neckline could set the stage for a return to the 19,900–20,100 region.
Additionally, the index has broken the uptrend that formed from the intraday lows on 7 April, with the rally on 29 May serving as a re-test of that trendline break. At the same time, momentum, as measured by the Relative Strength Index, has also reversed direction and is now trending lower, after having risen above 70, indicating the index had become overbought. This further strengthens the case that the Nasdaq is at some form of inflexion point.
One might have thought that two positive news events on the same day would have been enough to generate the momentum needed to push the Nasdaq higher and trigger a breakout. However, the failure to do so raises serious questions about whether the index has the strength required to move higher from here. It now seems more likely that a change in trend is beginning to emerge, and if a double top is forming, a move lower appears increasingly probable.
Written by Michael J. Kramer, founder of Mott Capital Management.
Disclaimer: CMC Markets is an execution-only service provider. The material (whether or not it states any opinions) is for general information purposes only and does not take into account your personal circumstances or objectives. Nothing in this material is (or should be considered to be) financial, investment or other advice on which reliance should be placed.
No opinion given in the material constitutes a recommendation by CMC Markets or the author that any particular investment, security, transaction, or investment strategy is suitable for any specific person. The material has not been prepared in accordance with legal requirements designed to promote the independence of investment research. Although we are not specifically prevented from dealing before providing this material, we do not seek to take advantage of the material prior to its dissemination.

[NAS100] Range Breakout Retest – Is Upside Continuation in Play?The NAS100 (US100) on the 4H chart is exhibiting a bullish structure following a recent breakout and retest of the 21,000.0 key resistance level, now acting as support. After forming a local high near 21,777.3, price retraced and is now attempting a second push higher, suggesting buyer strength.
Currently trading at 21,450.0, with
Support at: 21,000.0 🔽
Resistance at: 21,777.3 🔼 and 22,230.7 🔼
🔎 Bias:
🔼 Bullish: If price holds above 21,000.0 and breaks cleanly above 21,777.3, next upside target is 22,230.7.
🔽 Bearish: A drop back below 21,000.0 could open the door for a deeper retracement toward 20,200.0.
📛 Disclaimer: This is not financial advice. Trade at your own risk.

Hanzo / Nas100 15 Min Path ( Confirmed Break Out Zones )🔥 NAS100 – 15 Min Scalping Analysis (Bearish Setup)
Bias: Waiting For Break Out
Time Frame: 15 Min
Entry Type: Confirmed Entry After Break Out
👌Bullish After Break : 21475
Price must break liquidity with high volume to confirm the move.
👌Bearish After Break : 21120
Price must break liquidity with high volume to confirm the move.
☄️ Hanzo Protocol: Dual-Direction Entry Intel
➕ Zone Activated: Strategic Reaction from Refined Liquidity Layer
Marked volatility from a high-precision supply/demand zone. System detects potential for both long and short operations.
🩸 Momentum Signature Detected:
Displacement candle confirms directional intent — AI pattern scan active.
— If upward: Bullish momentum burst.
— If downward: Aggressive bearish rejection.
💯 Market Zone: Transition Phase
Asset in premium-to-discount (or vice versa) range — valid for both reversal and continuation trades. Execute with precision.

US 100 SELL
Position opened on US 100 SELL with good risk management and an optimal risk/reward ratio. Targeting a potential breakout, but with a tight stop loss to limit losses.
⚠️ Disclaimer: This is not financial advice, every trade carries risks.


US 100 Strong Signal Steps In? US100 Breaks Bearish Trendline & Pulls Back Above SMA — Strong Long Signal!
The US100 has just broken out of its bearish trendline, signaling a potential shift in market momentum from bearish to bullish.
What’s more bullish is the recent pullback above the Simple Moving Average (SMA), which now acts as a dynamic support level — a classic confirmation that buyers are stepping back in.
Adding to this bullish case, volume is increasing, showing strong participation and conviction behind the move.
This confluence of technical factors indicates a high-probability setup for a long position on the US100.
Key points:
Bearish trendline broken — trend reversal alert
Price retested and held above SMA — support confirmed
Volume rising — strong buyer interest
Traders might consider entering long positions with appropriate risk management and stop-loss placement below the SMA or recent swing low.
Stay sharp and trade smart!
Follow @GoldenZoneFX For more content and valuable insights.

QQQ best count if we rally above 525 The chart is the qqq wave structure the only alt is it is a triangle formation and that be down and up and down then rally back to above the heavy selling at 531 target I think


Nasdaq giving hints of bearishness failing to close above rangePlease review what I think I'm seeing. If you have any comments in regard to these potential levels they are always welcome.
I believe we may be actually bearish from here but without a daily close below the highest block, my decided choice must be neutral. Purely mechanical analysis will save your portfolio 💎
Don't forget to subscribe & share this with someone who is learning 🙏🏾

BUY NAS100 TO CLOSE GAPBreak of 1HR TL, retest, long. Basics. No greed, just trading to the gap. Monitor SL and let the trade breathe.

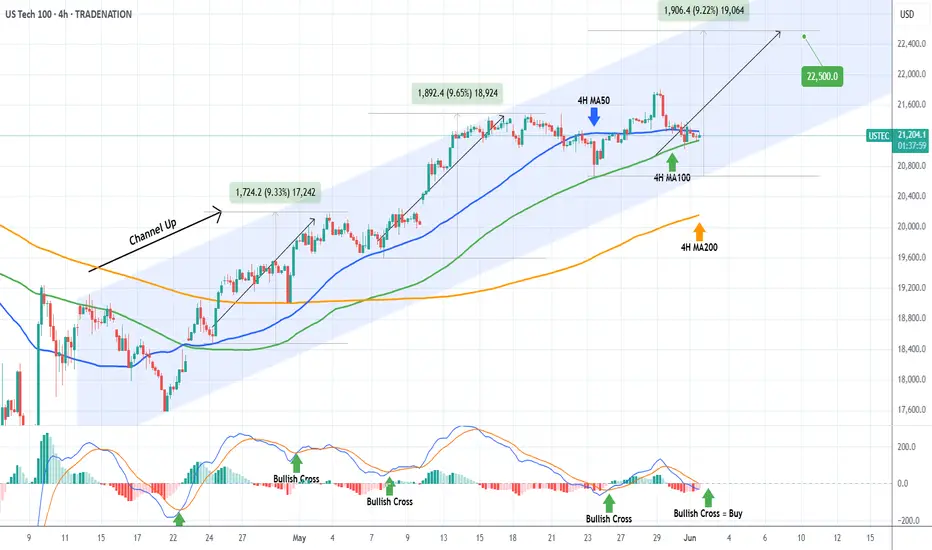
NASDAQ Will the 4H MA100 come to the rescue?Nasdaq (NDX) is trading within a 3-week Channel Up, which is currently supported by the 4H MA100 (green trend-line). In fact, the price is being squeezed in the last three 4H candles within the 4H MA100 and the 4H MA50 (blue trend-line).
This tight compression technically tends to cause violent break-outs either way. As long as the Channel Up holds, we expect that to be upwards and it should be confirmed by the formation of a 4H MACD Bullish Cross.
With the last two major rallies being around +9.50%, we expect to see 22500 on the next Leg Up.
-------------------------------------------------------------------------------
** Please LIKE 👍, FOLLOW ✅, SHARE 🙌 and COMMENT ✍ if you enjoy this idea! Also share your ideas and charts in the comments section below! This is best way to keep it relevant, support us, keep the content here free and allow the idea to reach as many people as possible. **
-------------------------------------------------------------------------------
Disclosure: I am part of Trade Nation's Influencer program and receive a monthly fee for using their TradingView charts in my analysis.
💸💸💸💸💸💸
👇 👇 👇 👇 👇 👇
US100 – Daily Chart Outlook (June 2, 2025)Price is showing signs of weakness after rejecting the 21,386 level, forming a potential shift in structure. Here's what I’m watching:
🔹 Context: After a bullish move in May, price is now stalling near previous highs.
🔸 Key Level: 21,386 marked as a potential rejection zone (also labeled as “Bullish”).
🔻 Scenario: If price stays below 21,386 and breaks the blue support (around 21,040), I expect continuation lower.
🟩 Discount Area: First demand zone between 20,000–20,500. Price could find support here if the bearish scenario plays out.
📌 ADR Levels included for volatility context.
🔄 Plan:
Wait for confirmation of rejection.
Target zone: 20,400–20,000.
Invalidation above 21,386 with bullish structure.
🧠 Bias: Bearish unless price reclaims 21,386 and holds.
📌 This is not financial advice – trade your plan.

Hanzo / Nas100 15 Min Path ( Confirmed Break Out Zones )🔥 NAS100 – 15 Min Scalping Analysis (Bearish Setup)
Bias: Waiting For Break Out
Time Frame: 15 Min
Entry Type: Confirmed Entry After Break Out
👌Bullish After Break : 21310
Price must break liquidity with high volume to confirm the move.
👌Bearish After Break : 21125
Price must break liquidity with high volume to confirm the move.
☄️ Hanzo Protocol: Dual-Direction Entry Intel
➕ Zone Activated: Strategic Reaction from Refined Liquidity Layer
Marked volatility from a high-precision supply/demand zone. System detects potential for both long and short operations.
🩸 Momentum Signature Detected:
Displacement candle confirms directional intent — AI pattern scan active.
— If upward: Bullish momentum burst.
— If downward: Aggressive bearish rejection.
💯 Market Zone: Transition Phase
Asset in premium-to-discount (or vice versa) range — valid for both reversal and continuation trades. Execute with precision.

US100 (NASDAQ100)🎯 Current Bias: Bearish Short-Term
-Price has already formed a lower high and lower low structure.
-Sitting at a key retracement zone after recent drop.
-Smart money concept (CHoCH → BoS) suggests institutional repositioning for shorts.
💡 Trading Opportunities
1. Short Opportunity (Main Bias)
-Entry Zone: Between 0.5 to 0.618 retracement (21,220–21,260)
-Stop Loss: Above 0.382 level / local high (~21,300)
-Target 1: 21,117.5 (marked Fibonacci level)
-Target 2: 21,000 psychological / next POI
Confluence:
-Bearish market structure
-Premium zone tap + Fib retracement zone
-CHoCH and BoS confirming order flow shift
2. Countertrend Long (Aggressive & Lower Probability)
-Entry: If price hits 21,117.5 and forms a bullish CHoCH or internal BoS
-SL: Below 21,050
-Target: Revisit 0.5–0.618 zone or unmitigated supply above
⚠️ Risk Notes
-NFP/major US data could trigger volatility (always check the calendar).
-US100 can whipsaw during macro catalyst moments – avoid overleveraging.

NAS100 - Will the stock market continue to rise!?The index is above the EMA200 and EMA50 on the four-hour timeframe and is trading within the specified range. In case of a valid break of this range, I expect a new trend to form. In case of corrective movements towards the demand zone, we can buy Nasdaq in that range with an appropriate reward for the risk.
A recent report from Bank of America reveals that investors are actively repositioning in global markets. For the second consecutive week, U.S.equities experienced capital outflows, while European stocks saw inflows for the seventh straight week.
Digital assets attracted $2.6 billion in inflows—the largest amount since January. In contrast, Japanese equities recorded the largest weekly outflow in history, while emerging markets equities attracted their highest inflows of 2025. Meanwhile, emerging markets debt also posted its strongest inflows since January 2023.
Jamie Dimon, CEO of JPMorgan, speaking at the 2025 Reagan National Economic Forum, warned that China will not yield to U.S. trade pressure. He urged that the U.S. must first address its internal challenges, including reforming laws, taxes, immigration, education, and healthcare systems. Dimon also underscored the importance of preserving military alliances.
He noted that China is a serious and potential rival, and if the United States fails to maintain its position as the world’s dominant economic and military power over the next 40 years, the dollar will no longer serve as the global reserve currency. Having just returned from China, Dimon added, “The Chinese are not afraid; don’t expect them to bow to America.”
Currently, markets are pricing in two interest rate cuts totaling 50 basis points by the end of 2025—a forecast aligned with the Federal Reserve’s official dot plot projections. Additionally, the latest FOMC minutes, which revealed policymakers’ concerns over persistent inflationary pressures, played a significant role in shaping these expectations.
Federal Reserve Governor Christopher Waller stated that he would support rate cuts later this year if tariffs remain around an average of 10%. However, his support hinges on inflation moving toward the Fed’s 2% target and the labor market maintaining its current strength.
Meanwhile, Morgan Stanley projects that the U.S. dollar could weaken by approximately 9% by mid-2026, citing a slowdown in U.S. economic growth and an anticipated 175 basis point reduction in the Fed’s interest rates. The bank also forecasts that 10-year Treasury yields will reach 4% by the end of 2025 but fall sharply in 2026 as rates decline further. Both Morgan Stanley and JPMorgan hold a bearish outlook on the dollar, expecting safe-haven currencies such as the euro, yen, and Swiss franc to benefit the most from its weakness.
In this context, market participants are closely watching key economic data in the week ahead. The ISM Manufacturing PMI is scheduled for release on Monday, followed by the Non-Manufacturing PMI on Wednesday. However, the main highlight will be Friday’s May Non-Farm Payrolls (NFP) report, which has exceeded expectations over the past two months. A similar result this time would signal continued strength in the labor market.
Given the Fed’s focus on inflation risks, special attention will likely be paid to the average hourly earnings growth. If wage growth remains above 3%, the market may begin to reprice some of its expectations for rate cuts—especially if the ISM reports also indicate improved economic activity in line with strong S&P Global readings. Such a scenario could pave the way for a renewed strengthening of the U.S. dollar.
Alongside the data releases, a series of speeches from key Federal Reserve officials—including Goolsbee (Chicago), Bostic (Atlanta), Logan (Dallas), and Harker (Philadelphia)—are expected. These remarks could further shape market expectations regarding the future path of monetary policy.

Nasdaq-100 H4 | Approaching an overlap supportThe Nasdaq-100 (NAS100) is falling towards an overlap support and could potentially bounce off this level to climb higher.
Buy entry is at 20,833.76 which is an overlap support that aligns with the 23.6% Fibonacci retracement.
Stop loss is at 20,100.00 which is a level that lies underneath a pullback support and the 38.2% Fibonacci retracement.
Take profit is at 21,763.98 which is a swing-high resistance.
High Risk Investment Warning
Trading Forex/CFDs on margin carries a high level of risk and may not be suitable for all investors. Leverage can work against you.
Stratos Markets Limited (tradu.com ):
CFDs are complex instruments and come with a high risk of losing money rapidly due to leverage. 63% of retail investor accounts lose money when trading CFDs with this provider. You should consider whether you understand how CFDs work and whether you can afford to take the high risk of losing your money.
Stratos Europe Ltd (tradu.com ):
CFDs are complex instruments and come with a high risk of losing money rapidly due to leverage. 63% of retail investor accounts lose money when trading CFDs with this provider. You should consider whether you understand how CFDs work and whether you can afford to take the high risk of losing your money.
Stratos Global LLC (tradu.com ):
Losses can exceed deposits.
Please be advised that the information presented on TradingView is provided to Tradu (‘Company’, ‘we’) by a third-party provider (‘TFA Global Pte Ltd’). Please be reminded that you are solely responsible for the trading decisions on your account. There is a very high degree of risk involved in trading. Any information and/or content is intended entirely for research, educational and informational purposes only and does not constitute investment or consultation advice or investment strategy. The information is not tailored to the investment needs of any specific person and therefore does not involve a consideration of any of the investment objectives, financial situation or needs of any viewer that may receive it. Kindly also note that past performance is not a reliable indicator of future results. Actual results may differ materially from those anticipated in forward-looking or past performance statements. We assume no liability as to the accuracy or completeness of any of the information and/or content provided herein and the Company cannot be held responsible for any omission, mistake nor for any loss or damage including without limitation to any loss of profit which may arise from reliance on any information supplied by TFA Global Pte Ltd.
The speaker(s) is neither an employee, agent nor representative of Tradu and is therefore acting independently. The opinions given are their own, constitute general market commentary, and do not constitute the opinion or advice of Tradu or any form of personal or investment advice. Tradu neither endorses nor guarantees offerings of third-party speakers, nor is Tradu responsible for the content, veracity or opinions of third-party speakers, presenters or participants.

starting shortIt seems that the week is set to start with a bearish move. Again, bulls can't hold or defend levels.
there isn't much to say, if bulls wont support America, it`s on them

NASDAQplanning this coming weeks trade on NAS... so here do have a common reaccurence that happens where price goes into accumulation then making a fake out just to go the opposite way, not its retracing to mitigate a candle i found in the 1hr entry but going to wait, quick RR 1:20
