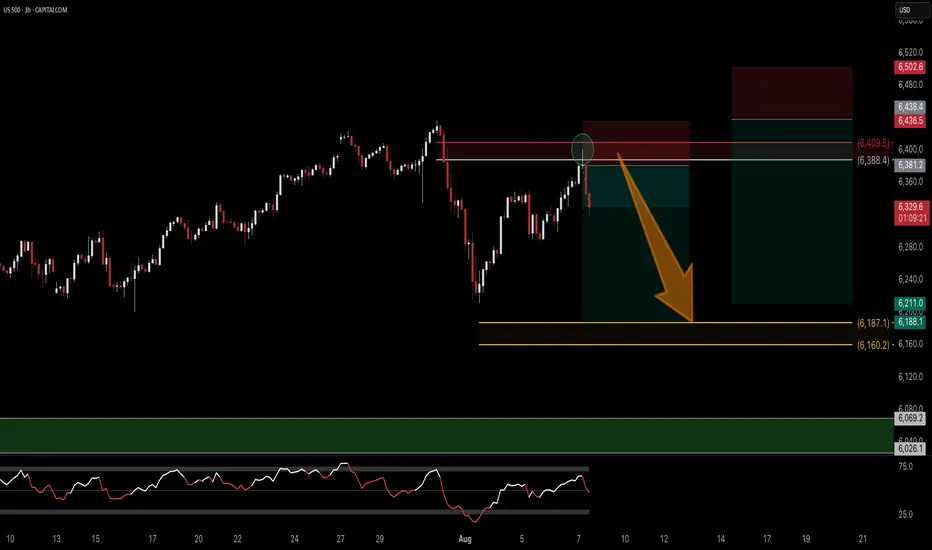
US500 Needs retracementVery good opportunity to sell above 6400... and then i expect it to touch 6085
About S&P 500 Index
Standard and Poor's 500 Index is a capitalization-weighted stock market index measuring the performance of 500 large publicly traded companies in the United States. This index covers a wide range of industries, including technology, healthcare, energy, and finance. It serves as a benchmark for the overall health of the U.S. stock market, as well as a reflection of the country's economic strength.
Substantial gains in the S&P 500 are often interpreted as positive signals for the economy, while losses can be seen as indicators of potential trouble. Investors use this index as a barometer for their own portfolios and to assess the performance of individual stocks. The S&P 500 index plays a vital role in the financial world and is closely watched by analysts and policymakers.
Substantial gains in the S&P 500 are often interpreted as positive signals for the economy, while losses can be seen as indicators of potential trouble. Investors use this index as a barometer for their own portfolios and to assess the performance of individual stocks. The S&P 500 index plays a vital role in the financial world and is closely watched by analysts and policymakers.
Related indices

Hellena | SPX500 (4H): LONG to resistance area of 6596 .Dear colleagues, I haven't made a forecast for the SNP500 in a long time and was waiting for a correction, but it seems that a major correction is not yet close, and at the moment the price continues to be in an upward five-wave movement.
Therefore, I believe that we should expect to reach the 6596

S&P 500 Bearish Pennant Signals Potential Downside MoveThe S&P 500 Index (SPX) is forming a bearish pennant pattern on the 30-minute chart, suggesting possible continuation of the recent downtrend. Price action is consolidating within converging trendlines after a sharp drop, with a breakdown below support near 6,360 potentially opening the door to furt

Lower High Complete?OFC earnings provided buys a good level to pick up price but POC at 6375 was key.
The 4HR shows and englufing with LH partially complete.
Bias is Short!

US500 Bearish Idea: Waiting for Structure Break ConfirmationWatching the SPX US500 right now 📈 — it’s rallied hard with strong momentum and is pushing into a key resistance level ⚠️. Since price is overextended, I’m expecting a pullback towards equilibrium on the current move 🔄. My bias is bearish from this level 🔻, with entry dependent on a break in structu

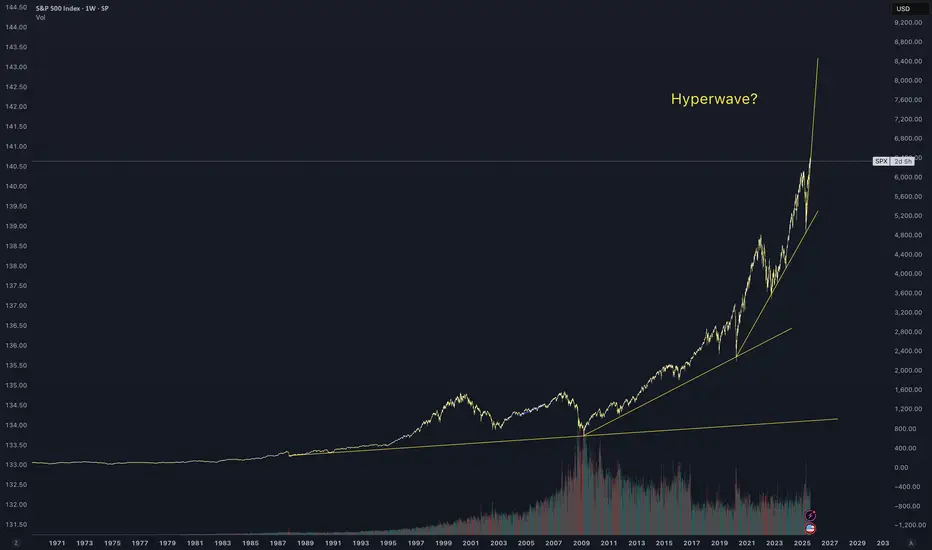
The Stock Market History Says…The Stock Market History Says…
When Capital Rotation Events (CRE) hit, stocks stall & gold outperforms.
Past (1949, 1974, 2009) hints at a retest of the 300-month MA before the next big leg up, maybe around 2036.
Watch GOLD vs SPX for the signal.

Anticipating the market to go down this Thursday ....After my last BAD trade prediction, I just laid low for a little while, was very sick and visited some relatives for a little while. But I am jumping back on the horse, as they say.
I anticipate the market to go down this Thursday when jobless claims are reported.
I expect for whatever the news fo

S&P500 Channel Up going straight to 6670.The S&P500 index (SPX) has been trading within a 3-month Channel Up since the May 12 candle. All of this time, it has been supported by the 1D MA50 (blue trend-line) and as long as it holds, the new Bullish Leg is expected.
The last two rose by +7.06%, and ahead of a new 1D MACD Bullish Cross, that

SP500 | Short | 3hrsThis technical analysis is for informational and educational purposes only. It does not constitute financial advice. Remember to always research and consult with a professional before making investment decisions. Good luck! 📈💼🚀
See all ideas
Summarizing what the indicators are suggesting.
Oscillators
Neutral
SellBuy
Strong sellStrong buy
Strong sellSellNeutralBuyStrong buy
Oscillators
Neutral
SellBuy
Strong sellStrong buy
Strong sellSellNeutralBuyStrong buy
Summary
Neutral
SellBuy
Strong sellStrong buy
Strong sellSellNeutralBuyStrong buy
Summary
Neutral
SellBuy
Strong sellStrong buy
Strong sellSellNeutralBuyStrong buy
Summary
Neutral
SellBuy
Strong sellStrong buy
Strong sellSellNeutralBuyStrong buy
Moving Averages
Neutral
SellBuy
Strong sellStrong buy
Strong sellSellNeutralBuyStrong buy
Moving Averages
Neutral
SellBuy
Strong sellStrong buy
Strong sellSellNeutralBuyStrong buy
Displays a symbol's price movements over previous years to identify recurring trends.
Frequently Asked Questions
The current value of S&P 500 Index is 6,445.75 USD — it has risen by 1.13% in the past 24 hours. Track the index more closely on the S&P 500 Index chart.
S&P 500 Index reached its highest quote on Jul 31, 2025 — 6,427.02 USD. See more data on the S&P 500 Index chart.
The lowest ever quote of S&P 500 Index is 2.73 USD. It was reached on Jun 1, 1877. See more data on the S&P 500 Index chart.
S&P 500 Index value has increased by 1.72% in the past week, since last month it has shown a 3.04% increase, and over the year it's increased by 20.44%. Keep track of all changes on the S&P 500 Index chart.
The top companies of S&P 500 Index are NASDAQ:NVDA, NASDAQ:MSFT, and NASDAQ:AAPL — they can boast market cap of 4.47 T USD, 3.93 T USD, and 3.41 T USD accordingly.
The highest-priced instruments on S&P 500 Index are NYSE:NVR, NASDAQ:BKNG, and NYSE:AZO — they'll cost you 7,962.30 USD, 5,461.54 USD, and 4,000.67 USD accordingly.
The champion of S&P 500 Index is NASDAQ:PLTR — it's gained 518.70% over the year.
The weakest component of S&P 500 Index is NASDAQ:MRNA — it's lost −69.81% over the year.
S&P 500 Index is just a number that lets you track performance of the instruments comprising the index, so you can't invest in it directly. But you can buy S&P 500 Index futures or funds or invest in its components.
The S&P 500 Index is comprised of 503 instruments including NASDAQ:NVDA, NASDAQ:MSFT, NASDAQ:AAPL and others. See the full list of S&P 500 Index components to find more opportunities.