S&P 500 Daily Chart Analysis For Week of June 20, 2025Technical Analysis and Outlook:
The S&P 500 Index has primarily exhibited downward trends during this week’s abbreviated trading session, narrowly failing to reach the targeted Mean Support level of 5940, as outlined in the previous Daily Chart Analysis. Currently, the index exhibits a bearish trend, suggesting a potential direction toward the Mean Support level of 5940, with an additional critical support level identified at 5888.
Contrariwise, there exists a substantial likelihood that following the accomplishment of hitting the Mean Support of 5940, the index may experience recovery and ascend toward the Mean Resistance level of 6046. This upward movement could facilitate a resilient rally, ultimately topping in the completion of the Outer Index Rally at 6073, thereby enabling the index to address the Key Resistance level situated at 6150.
SPX500 trade ideas

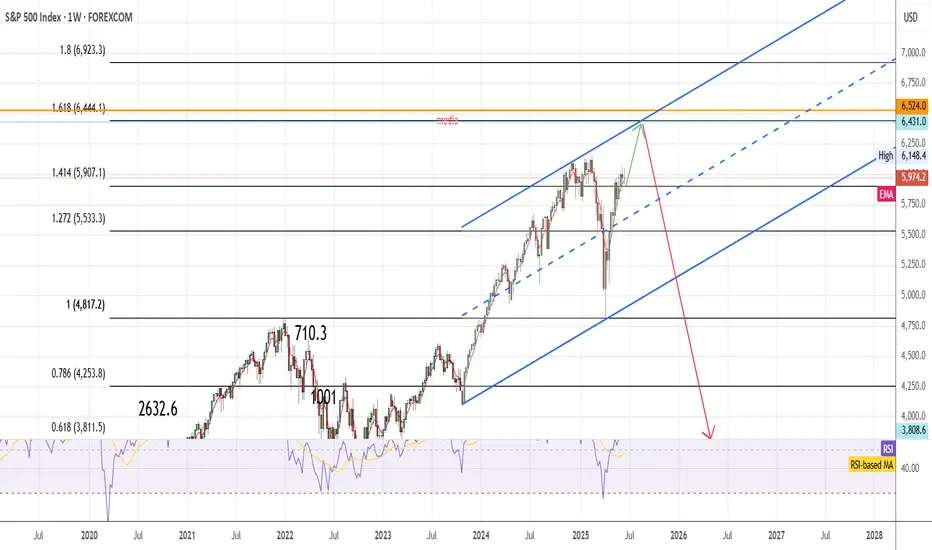
SPX tp 6440 then 3800In my view next month will be bullish for SPX, I expect a test of 6444 area (1.6 fibonacci extension from bullish trend started in 2020) then bearish market will start and push SPX to 3800 area.
SPX500 Technical Outlook: Balancing Risk and RewardPost Content:
🔍 SPX500 Analysis - 4H Timeframe
Our latest technical analysis showcases a detailed approach to the S&P 500 Index using Smart Money Concepts, Fibonacci tools, and volume dynamics. Here's the breakdown:
1️⃣ Trend Structure
The price has formed a wedge within the premium zone, indicating potential exhaustion.
BOS and ChOCH markers highlight key pivots, emphasizing a weak high and strong low.
2️⃣ Fibonacci Insights
We're observing equilibrium near 5,668.57, a critical area where price may consolidate or pivot.
Higher Fibonacci extensions suggest an upside target near 6,580.38, should momentum hold.
3️⃣ Risk-Adjusted Strategy
Short Opportunity: Bearish retracement expected toward equilibrium; target around 5,668.57.
Long Opportunity: Look for confirmations to buy at the discount zone or post-retracement breakout above the weak high.
4️⃣ Volume Dynamics
Spikes at key pivot points signal institutional activity, strengthening the validity of liquidity zones.
📊 Trade Setup Overview
Entry: Short near premium zone OR Long near equilibrium/discount zone.
Stop-Loss: Place below the strong low for longs or above weak highs for shorts.
Target: Extensions at 6,580.38 align with the broader bullish sentiment.
🎯 Key Takeaway: This model emphasizes patience, precision, and risk management. Be sure to monitor upcoming macro events and confirm entry triggers before committing to any position.
🌟 Follow WaverVanir International LLC for more actionable insights, technical breakdowns, and AI-driven strategies!
📈 Trade Safe,
Team WaverVanir International LLC

[06/16] Weekly GEX Roadmap - Diagonal Spreads or Put Hedges?📊 Weekly GEX Map (SPX)
This week’s GEX profile looks nearly identical to last week:
Positive bias above 6020 up to 6100
But a sticky chop zone remains from 5975 to 6020
Below 5950? That’s where things get interesting…
⚠️ What Happens If 5950 Fails?
In that case - welcome to negative gamma territory:
Delta becomes unstable → fast, erratic moves
Gamma loses influence → hedging effectiveness drops
Dealer hedging lags → market makers chase, not lead
Vega + theta distort readings → charm decay accelerates
Result:
GEX zones lose clarity.
Pinning breaks down.
Reactions become nonlinear and emotional.
If we drop below 5950, we might see acceleration instead of stabilization — despite the positive GEX profile.
💡 Trade Idea of the Week – With Caution
If not for Wednesday's macro risk (Fed rate decision), I'd suggest a bullish diagonal spread toward 6100–6150:
Limited downside
Defined risk
Covers the full squeeze zone
But with FOMC looming, I'd only hold this trade until Thursday and close once the debit doubles or earlier.
🧨 Macro + Geo Risks
Fed is priced for “no move” → any surprise = volatility spike
Rising tensions with Iran → oil and futures could react violently
Recommendation : Avoid OIL this week, especially futures and naked strategies
🛡️ Prefer Downside Protection?
If you expect weakness on SPX weekly:
Consider a put debit spread with the short leg at 5950, where the second strongest Put Support sits.
This type of structure can offer up to 6:1 reward-to-risk, making it one of the most efficient bearish hedges for this week.
If you enjoyed the above breakdown, feel free to check out my previous weekly analyses or explore my tools as well.
Until next time – Trade what you see, not what you hope,
– Greg @ TanukiTrade

SPX vs VIX: Is this a sign of a bullish market?VIX has seen a strong decline in the past 2 months following the massive surge of Feb-March due to the Tariff War. In contrast, the S&P500 rose massively to almost its ATH, which is a natural response as the two assets are negatively correlated. This VIX pattern has been seen during every major market bottom in the past 15 years, the strongest of which was the 2020 COVID crash. This is a sign of a very bullish market, TP = 6,800 by the end of the year.
## If you like our free content follow our profile to get more daily ideas. ##
## Comments and likes are greatly appreciated. ##


MAJOR TOP IS NOW IN PLACE 5th wave up from 4835 has ended 6059The chart posted is that of the sp 500 and I now have counted 5 waves up as ending based on this wave structure I will look for two things to happen a rather deep ABC if there is a bull market intact and it should decline in 3 waves back to .236/382 area from 6059 - 4835 The 4th wave or A low This MUST HOLD at .382 or The cycle has ended the 5 wave sup from march 23 low 2020 I sold longs this morning based on NAAII exposure and Now have moved to a 100 % long VERY DEEP IN THE MONEY PUTS 2027 Best of trades The WAVETIMER

The Midyear Mindset Reset: Reboot Your Trading Before Q3Because nothing says "trader growth" like admitting you’ve been winging it for six months.
👋 Welcome to Halftime — How’s Your P&L Looking?
June’s closing bell isn’t just a date on the calendar — it’s that awkward moment where traders stare into the middle distance, coffee in hand, and quietly whisper: “Well… that went differently than I expected.”
Whether you’ve been racking up wins, nursing drawdowns, or simply surviving market whiplash, midyear is nature’s way of handing you a clean slate. Before Q3 throws its inevitable curveballs, now’s your chance to pause, reset, and actually look at what the heck you’ve been doing. And, of course, prepare for the next batch of earnings reports .
Spoiler: if your trading strategy this year has involved equal parts hope and caffeine, you’re not alone.
🔥 The Year So Far: Markets Kept It… Interesting
Let’s quickly recap 2025 so far (because trauma processing is healthy).
The Magnificent Seven? More like the Magnificent Two-And-A-Half. Meta NASDAQ:META and Microsoft NASDAQ:MSFT ran victory laps while everyone else tripped over AI headlines or regulatory landmines.
Nvidia NASDAQ:NVDA moonwalked into trillion-dollar territory, then stumbled after export bans — but somehow still has every fund manager whispering “Blackwell” like it’s a secret password.
Bitcoin BITSTAMP:BTCUSD set new highs north of $110K (who needs fiat when you can have memes?).
The Fed teased cuts, inflation teased persistence, and Trump teased… well, everyone.
And summer trading arrived with its usual low-volume traps, giving us breakouts that break hearts and liquidity that disappears faster than your broker’s customer support.
In short: volatility? Check. Opportunity? Absolutely. Discipline? That depends on whether you’re still following your rules or trading on vibes.
By June, most traders have crafted elaborate narratives in their heads. You know the type: "This breakout is different," "The Fed has to cut next month," and "There’s no way Nvidia can keep running like this."
The problem is, markets don’t care about your narrative. They care about price, volume, sentiment — and sometimes, absolute chaos. That beautifully clean chart setup? It’s not asking for your prediction. It’s begging you to respond with discipline, not bravado.
The traders who thrived in the first half didn’t win by forecasting every twist in the macro plotline. They won by following the tape. The breakout happened? They took it. The stop-loss hit? They respected it. That’s not luck — that’s execution.
🫶🏻 Emotional Capital: The Real Balance You Should Be Watching
P&L tells one story. Emotional capital tells another.
By June, a lot of traders aren’t out of money — they’re out of discipline. They’ve been revenge trading after a string of losses, chasing AI headlines that already ran, and convincing themselves they can “make it all back” on the next oversized position.
Do you know that feeling?
Resetting your trading mindset at midyear means recalibrating that emotional bankroll. Start by reviewing your trading journal (yes, you’re supposed to have one ). Revisit the trades that made sense and the ones that make you cringe. Recognize your patterns — your strengths, but also your weaknesses. Success leaves clues and there are lessons in failures.
💭 Clean Up the Clutter
There’s a special type of fatigue that sets in after six months of consuming too much trading content. You start layering on indicators like toppings at a frozen yogurt bar — RSI, MACD, Stochastics, VWAP, Fibonacci, Elliott Waves, Gann fans... until your charts light up like the billboards in Times Square.
The truth is, the best traders heading into Q3 are simplifying. They’re not chasing complexity; they’re chasing clarity. They know their setups, they trust their process, and they wait for clean signals.
Summer trading especially demands this discipline. Liquidity gets thinner, breakouts fail more often , and the tape gets choppy.
Complex systems may amplify the noise. Strip it down. Focus on price structure. Simplify your strategy so you can execute when real opportunities appear — not when your 12th oscillator blinks green.
⚾ You Don’t Need a Home Run
At this stage of the year, many traders fall into what we’ll call the desperate hero phase. They feel behind. They want to make up for drawdowns. They want “the trade” that fixes everything. If you’ve missed making bank over the first half of the year, chances are, you want to catch up — and fast.
Here’s a secret: The best traders aren’t always looking for grand slams. They’re playing small ball too — consistent singles, tight risk, controlled losses, steady gains.
Q3 isn’t about doubling your account. It’s about staying alive long enough for your edge to show up and play out. The traders who make it to year-end consistently profitable aren’t the ones chasing massive wins. They’re the ones compounding quiet, boring, disciplined trades.
Midyear Reset: Your Q3 Trading Checklist
Here’s your brutally simple plan for the back half:
✅ Journal your biggest mistakes from H1
✅ Cut your watchlist in half
✅ Size smaller than feels exciting
✅ Trust clean setups over crowded trades
✅ Stay curious — but stay selective
✅ Leave the FOMO trades to the TikTok influencers
So the real question heading into Q3 isn’t whether markets will go up or down. It’s whether you will trade better or keep winging it.
Happy midyear reset. Trade smarter, not harder.

Spy chart for 6/25/25This and patience, it can change based on how we open for New York session but we will see

Where will the market goes from here ?Gap or hole to be filled up reminds me of looking at your own wallet. How many times did you realise that you were low on cash (yes in SG, we still use a lot of physical cash) and needs to go to the ATM machine to withdraw money to fill it up.
Logically, from the chart, it appears that option 2 is more likely to happen first before we think a rally picks up thereafter, right ? Nobody can tells you for certain where the market is going and that is why it is easier to REACT to the market moves and follows the trend rather than oppose it and predicts how it should moves.
At any time, there can be short sellers, institutional buyers, government agencies, algo traders, etc that are in the market with tons of cash to move the market. How can you possibly knows as a retail trader ? That is why it is wiser and financially prudent to follow the market trend and not go against it.
If it breaks up to 6126 resistance level, I will add more for the 2nd leg bullish run. However, if it falls to the support at 5741 level, I will buy slightly more as it has becomes cheaper.
Either way, I am long term bullish on the market

S&P 500 H4 | Rising into a pullback resistanceThe S&P 500 (SPX500) is rising towards a pullback resistance and could potentially reverse off this level to drop lower.
Sell entry is at 5,982.20 which is a pullback resistance that aligns with the 50% Fibonacci retracement.
Stop loss is at 6,030.00 which is a level that sits above the 78.6% Fibonacci retracement and a swing-high resistance.
Take profit is at 5,869.32 which is a swing-low support that aligns closely with a 78.6% Fibonacci retracement.
High Risk Investment Warning
Trading Forex/CFDs on margin carries a high level of risk and may not be suitable for all investors. Leverage can work against you.
Stratos Markets Limited (tradu.com ):
CFDs are complex instruments and come with a high risk of losing money rapidly due to leverage. 63% of retail investor accounts lose money when trading CFDs with this provider. You should consider whether you understand how CFDs work and whether you can afford to take the high risk of losing your money.
Stratos Europe Ltd (tradu.com ):
CFDs are complex instruments and come with a high risk of losing money rapidly due to leverage. 63% of retail investor accounts lose money when trading CFDs with this provider. You should consider whether you understand how CFDs work and whether you can afford to take the high risk of losing your money.
Stratos Global LLC (tradu.com ):
Losses can exceed deposits.
Please be advised that the information presented on TradingView is provided to Tradu (‘Company’, ‘we’) by a third-party provider (‘TFA Global Pte Ltd’). Please be reminded that you are solely responsible for the trading decisions on your account. There is a very high degree of risk involved in trading. Any information and/or content is intended entirely for research, educational and informational purposes only and does not constitute investment or consultation advice or investment strategy. The information is not tailored to the investment needs of any specific person and therefore does not involve a consideration of any of the investment objectives, financial situation or needs of any viewer that may receive it. Kindly also note that past performance is not a reliable indicator of future results. Actual results may differ materially from those anticipated in forward-looking or past performance statements. We assume no liability as to the accuracy or completeness of any of the information and/or content provided herein and the Company cannot be held responsible for any omission, mistake nor for any loss or damage including without limitation to any loss of profit which may arise from reliance on any information supplied by TFA Global Pte Ltd.
The speaker(s) is neither an employee, agent nor representative of Tradu and is therefore acting independently. The opinions given are their own, constitute general market commentary, and do not constitute the opinion or advice of Tradu or any form of personal or investment advice. Tradu neither endorses nor guarantees offerings of third-party speakers, nor is Tradu responsible for the content, veracity or opinions of third-party speakers, presenters or participants.

S&P 500: The Wedge, the Oil, and the Yen
The S&P 500 SP:SPX OANDA:SPX500USD CME_MINI:ES1! AMEX:SPY appears to have completed a rising ending diagonal — a classic reversal structure.
The 6050 zone stands out as strong resistance — notably, no monthly candle has ever closed above this level.
🧭 Minimum correction targets:
filling the weekly FVG
a retest of the 20-week moving average
retracement to the 0.382–0.5 Fibonacci zone from the recent leg
📌 Fundamentals support the downside:
Iran–Israel tensions are pushing oil prices higher → which fuels inflation expectations
Rising CPI in Japan may accelerate the carry trade unwind and lead to a stronger yen OANDA:USDJPY
Seasonality also leans bearish during the summer months
⚠️ Bottom line: momentum is fading. A cooling phase is likely next — time to focus on risk management.

SPX500 Market Outlook!We remain bullish on the SPX500.
🔍 Short-Term Expectation:
A potential bottom could form around 2 AM London time on the 4H chart.
📉 Key Support Levels:
• 5904.3
• 5865.1
• 5849.3
📅 Top Projection Dates:
• 25th June
• 4th July
Stay sharp. Structure still favours the bulls. 🐂📊

SPX: Elliott Wave indicating corrective phase nearly doneMy Elliott Wave count suggests the S&P 500 ( SP:SPX ) is nearing the completion of its current corrective phase. Price action has been consolidating around the 5980 area, last closing at 5980 on Wednesday.
From an Elliott Wave perspective, this setup implies an uptrend continuation is likely coming in the upcoming days.
Key levels I'm watching:
Immediate Support: 5840-5900 zone. A hold here would confirm strength.
Stronger Support: 5767-5840. A break below this would challenge the immediate bullish count.
Resistance: 6000 (psychological) and the all-time high of 6147.43. A clear break above these levels will validate the next impulse wave.
Volume and market breadth will be crucial confirmations. Let's see how the market reacts!
What are your thoughts on the current SPX wave count? Share below!
Disclaimer: This content is for informational and educational purposes only, and should not be considered financial advice. Trading involves substantial risk and may result in the loss of your capital. Always conduct your own thorough research and consult with a qualified financial professional before making any investment decisions.

SPY where are we going into OPEX and last week of June tradingYesterday was almost an indecision candle on daily. Markets cheered the jobs data earlier in day with a nice green candle, however the pump faded going into FOMC, where AMEX:SPY and SP:SPX were around 600/ 6000 at 2pm. FOMC event mostly turned out to be a "non-event". While the no rate cut and 2 for 2025 were largely expected, Powell spooked the markets commenting that he expects higher inflation in months ahead due to tariffs. Off course this set of a set of comments from Trump which was expected as well.
While markets are closed today (Juneteenth) futures are open, and in after hours and now we have drifted downwards... as of this writing SPX is around 5950. Bulls lost the 9 sma yesterday and now are trying to defend the 20 sma. Tomorrow is OPEX so expect some volatility and movement to where big money is positioned.
Certainly bulls can show up and reclaim 9 ma at 6003 or if we lose 5950, the next level down is below 5800. Meanwhile JPM collar is intact... Do we go down from here. Tomorrow will be key as we will know if we have lost 20 sma or regained 9 sma and how this week candle looks like.
Bulls can charge but is there enough gas in tank to make meaningful upside move? Maybe possible pump to open next week (around 6060 was recent high), but bears are now lurking to take us down towards that 5800 level next week.
As I said earlier tomorrow will be telling and I will update over the weekend.

Geopolitics vs. Fed: SPX500 Trading Below Key Pivot at 5966SPX500 – Overview
Geopolitical Tensions & Rate Decisions Keep Markets on Edge
Investor focus has shifted from monetary policy to geopolitics, as speculation grows over a potential U.S. military strike on Iran.
According to Bloomberg, senior U.S. officials are reportedly preparing for possible action in the coming days. This comes as global markets remain cautious ahead of key central bank meetings that are expected to provide updated guidance on growth and inflation.
Technical Outlook:
SPX500 remains under bearish pressure as long as the price trades below 5966.
A break and hold below 5966 targets 5938, with further downside toward 5902 and 5885
For a shift to bullish momentum, price must stabilize above 6010
• Support: 5938 / 5902 / 5885
• Resistance: 5989 / 6010 / 6041

S&P500Net shorts increased by 58,668 contracts, which is a massive bearish shift from institutions and hedge funds.
This signals that large speculators are aggressively betting against the S&P 500.
It’s one of the largest bearish positions in recent months — often tied to expectations of a market pullback, economic concern, or interest rate risk.
Bearish bias intensifies — short positions rising fast.

S&P500: 1D Golden Cross incoming. 6,300 sighted.S&P500 is on an excellent bullish technical outlook on 1D (RSI = 60.006, MACD = 86.860, ADX = 23.325), extending a May 23rd rebound on its 1D MA200. Soon the market will form a 1D Golden Cross, drawing valid comparisons with the 2020 COVID recovery. That pattern, following its 1D MA200 rebound, extended the uptrend all the way to the 1.136 Fibonacci extension before pulling back to the 1D MA50 again. Buy, TP = 6,300.
## If you like our free content follow our profile to get more daily ideas. ##
## Comments and likes are greatly appreciated. ##

17-04-2025This chart contains my analysis and key observations for today's trading session. All drawings and indicators reflect my current view of the market as of today. The purpose of this publication is to keep a record of my analysis and review it later for learning and improvement. No investment advice is provided.
SPX500 | Regression Channel Aligned with Bullish Sentiment – 6,1The S&P 500 ( FOREXCOM:SPX500 ) continues to respect the newly drawn regression channel after breaking above both descending resistance and AI-based mid-zones. Price is now moving in alignment with the prevailing sentiment bias, indicating potential momentum toward the 6,156–6,167 extension range.
🧠 Key Observations:
Breakout from a compressed structure
VWAP reclaims confirm market strength
Regression channel suggests controlled ascent
1.236 Fib projection at 6,062.22 aligns with short-term resistance
Higher confluence targets: 6,156.60 and 6,167.02
📉 Risk Levels:
Breakdown below 6,007 or re-entry into the prior wedge would invalidate this view short term.
🔍 Follow US, WaverVanir_International_LLC for more high-precision confluence maps, risk models, and macro-aligned quant setups.

15-04-2025This chart contains my analysis and key observations for today's trading session. All drawings and indicators reflect my current view of the market as of today. The purpose of this publication is to keep a record of my analysis and review it later for learning and improvement. No investment advice is provided.
The market still has ample room to grow!Society isn't crumbling yet.... We'll get there sure enough, but as for now, there is still plenty of spoils to be had.

