Structure Over Sentiment: Multi-Asset View into Month-End📊 Structure Over Sentiment: Multi-Asset View into Month-End | May 30, 2025
This isn’t a crash. This isn’t a rally. This is digestion.
The multi-asset view tells the real story — and it's not as chaotic as it looks.
🔍 What the Chart Shows:
This correlation lens plots key macro and market drivers YTD:
🟣 Gold (XAUUSD): Leading with +24.71% — this is the quiet macro bid no one’s talking about
🟢 Bitcoin (BTCUSD): Holding +8.47% — volatile, but still showing risk appetite
🔴 10Y Yield (US10Y): Up +5.31% — signalling rates peaking
🟠 Nasdaq (NDX): Nearly flat, -0.36% — NVDA strength masking internal rotation
🔵 S&P 500 (SPX): -2.32% — structurally fine, just not euphoric
🔵 Dow (DJA): -5.91% — lagging, cyclical drag
🔵 Russell 2000 (RTY): -13.60% — small caps under pressure, risk-on caution flag
🟣 Dollar Index (DXY): -6.44% — fading after a strong Q1
🟢 Oil (WTIUSD): -10.26% — no inflation panic here
🧠 Key Insight:
Despite the tariff headlines, sticky PCE, and conflicting narratives — the market remains internally consistent.
Gold is leading
Yields are rising but not sharply
Bitcoin is positive
Equities are flat-to-negative
Oil is weak
Dollar is fading
This is classic late-cycle digestion, not a crisis.
🛡️ Titan Mindset Check-In:
Don’t get lost in single headlines
Follow structure, not speculation
Let leaders lead (NVDA, Gold, BTC)
Protect equity when breath narrows
Zoom out, reduce noise, trade the curve — not the chaos
📍“Volatility isn’t risk. Misinterpretation is.”
Take Profits, Not Chances.
#MultiAssetView #StructureOverShock #TitanProtect #SPX #NDX #BTC #Gold #DXY #WTI #US10Y #MacroFlow #MarketMindset #LateCycleSignals #DigestDontPanic
SPX500 trade ideas

S&P 500 MAJOR REVERSAL INCOMING? | SPX500 SELL ZONE HIT SPX500 just tapped into a critical supply zone near 5985 and has started pulling back. Is this the beginning of a deeper correction? Here’s what I’m watching 👇
---
📊 Key Technical Zones:
🔵 Supply Zone: 5985 – 6000 (Strong historical rejection zone)
⚠️ First Support: 5436.1 – potential bounce area, but already tested
🧱 Major Demand Zone: 4990 – heavy volume base, ideal buy zone for bulls
---
🚨 Bearish Clues on the Chart:
Price got rejected at the top of the supply range with a strong wick.
Bearish divergence on recent highs (not shown here but evident on RSI/MACD).
Clean downside structure could target 5436, then 4990 if broken.
📉 Downside Projections:
First TP: 5436
Final TP: 4990 (big institutional interest)
---
🔁 Possible Scenarios:
1. 🔻 Bearish Continuation: If we break below recent support near 5880, expect speed towards 5436.
2. 🟢 Bullish Fakeout: Only a strong breakout above 5985 invalidates this setup.
---
🎯 Trade Idea (Educational):
Entry: Break and retest below 5880
SL: Above 5985 zone
TP1: 5436
TP2: 4990
---
📅 June Will Be Volatile – Stay prepared.
💬 Do you think this is the start of a correction or just a dip before ATH?
🔔 Follow @FrankFx14 for clean and professional chart updates! 👍 Like, 🔁 share, and 💭 comment your thoughts below!

SPX, Final choppy leg upExpecting choppy ending diagonal wave 5 up to 6130-6200area. Followed by a larger wave 2 correction at the next higher degree/ set up for the a larger wave 3 wave to new ATH. ( Tax cuts/ rate cuts ).
How low will wave 2 go? ( somewhere in the green box most likely). Will we need to monitor its structure going down. Trump will not let market collapse to far If he can help it... And he can help it.

The Bias remains up on both Gold and the SP500 Both markets are above their 18mas so the bias remains up. SPX BB is 6054 and if I'm right we will get there.

Tracking a pattern that could signal the Top is In I am tracking a micro pattern with the new local high made in the ES last night and today's price action as a micro 5-down....we should get a slight retrace into the 5960 ish area. Maybe tomorrow...maybe in the overnight session tonight.
If price can then breach todays micro low of 5884 in the ES futures...we need to then follow through with a breach of 5857 to give us our first indication, we may have struck a top.
From there I am following 2 counts...Purple, or my primary count which is a minor C of Intermediate (A).
Best to all,
Chris

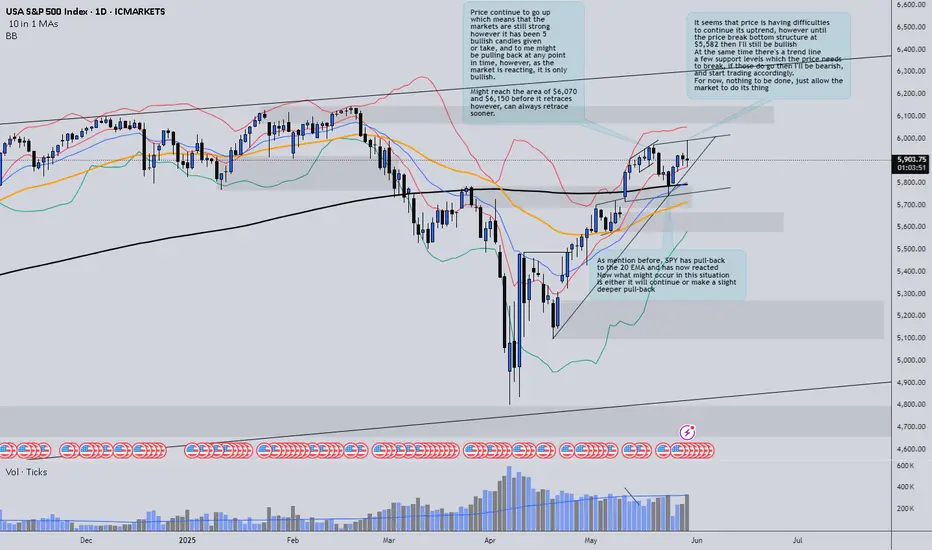
SPY update - still bullish!In today’s session, we saw an increase in volume without significant price movement. This could indicate underlying uncertainty or a potential shift in momentum.
At the moment, price is still respecting a key trend line and several support levels. Until these are broken, it's too early to confirm whether the broader market is turning bearish.
🧠 I also want to point out that the price is forming an ascending channel, often a reversal pattern, especially when occurring at market highs. While we’re seeing some bearish signs, it’s crucial to remain patient and let the market show its hand.
📊 As always, the key is to observe, not assume, and be ready to adapt as the price action develops.
Thanks for watching the update, I hope it brought some insight and value to your trading journey!
Bullish bounce off overlap support?S&P500 is falling towards the support level which is an overlap support that lines up with the 23.6% Fibonacci retracement and could bounce from this level to our take profit.
Entry: 5,784.04
Why we like it:
There is an overlap support level that aligns with the 23.6% Fibonacci retracement.
Stop loss: 5,689.40
Why we like it:
There is a pullback support level that is slightly above the 38.2% Fibonacci retracement.
Take profit: 5,973.58
Why we like it:
There is a pullback resistance level.
Enjoying your TradingView experience? Review us!
Please be advised that the information presented on TradingView is provided to Vantage (‘Vantage Global Limited’, ‘we’) by a third-party provider (‘Everest Fortune Group’). Please be reminded that you are solely responsible for the trading decisions on your account. There is a very high degree of risk involved in trading. Any information and/or content is intended entirely for research, educational and informational purposes only and does not constitute investment or consultation advice or investment strategy. The information is not tailored to the investment needs of any specific person and therefore does not involve a consideration of any of the investment objectives, financial situation or needs of any viewer that may receive it. Kindly also note that past performance is not a reliable indicator of future results. Actual results may differ materially from those anticipated in forward-looking or past performance statements. We assume no liability as to the accuracy or completeness of any of the information and/or content provided herein and the Company cannot be held responsible for any omission, mistake nor for any loss or damage including without limitation to any loss of profit which may arise from reliance on any information supplied by Everest Fortune Group.

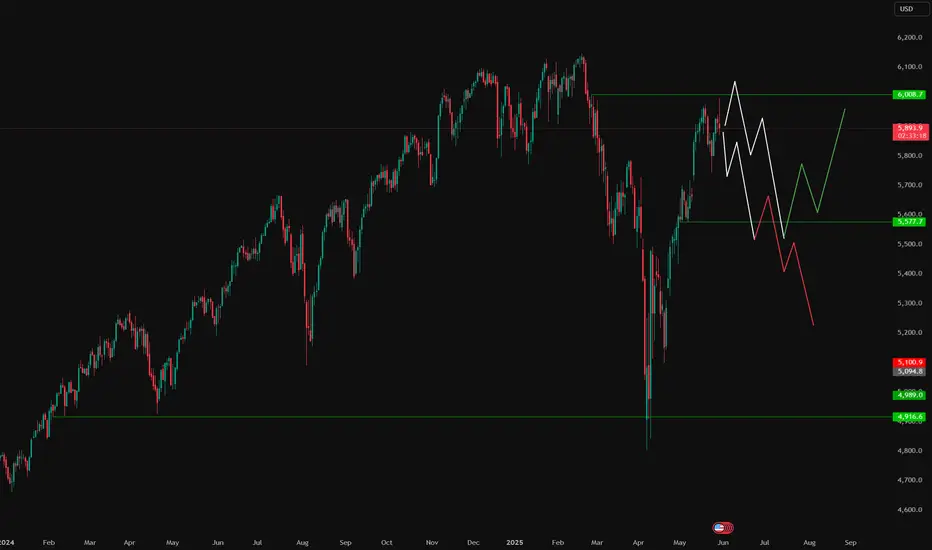
US500 Long TermBased on the technicals I'd be expecting US500 and other indices (US30, NAS100) to turn bearish again, at least for a short while. US500 has a key level of liquidity at 5577 which has to be swept before any major bulls return. Once that level is taken out, it depends on how the fundamental will develop and we can either expect the bears to continue the sell off or we may see the top 3 indices reach new ATHs.
S&P500: Inverse Head and Shoulders set to extend Apr-May rally.The S&P500 is bullish on its 1D technical outlook (RSI = 58.868, MACD = 85.480, ADX = 31.901) as it maintains a steady Channel Up pattern and just formed the first 1H Golden Cross in a month. Technically this is forming the Right Shoulder of an Inverse Head and Shoulders pattern, typically a bullish reversal formation, which not surprisingly was last seen in April when the Channel Up started and was completed with the previous 1H Golden Cross on April 24th. The result was a bullish extension fo rht 1.618 Fibonacci level. We're bullish on this, TP = 6,150.
## If you like our free content follow our profile to get more daily ideas. ##
## Comments and likes are greatly appreciated. ##

US500 US500 15min analysis
wait for the breakout of previous LH
bullish divergence formed
Targets mentioned

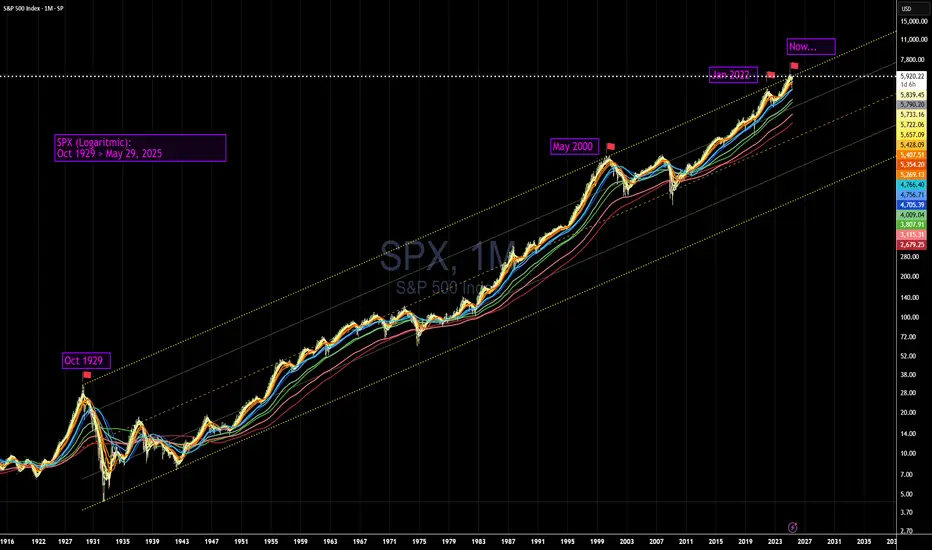
SPX top of near 100 yr channelAs we are in the vicinity og channel top, I have no idea wherte it will go next :)
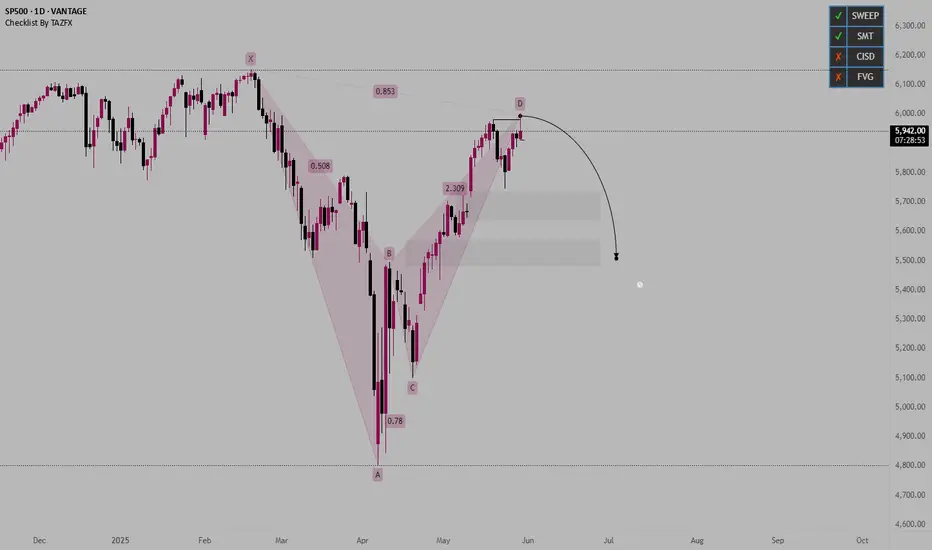
US500 - BEARISH HARMONICFollowing are the marked targets as am expecting price to move to downside to atleast fill the gap area
S&P INTRADAY corrective pullback - support retest?Trump-Era Tariffs Canceled: A US court struck down the “Liberation Day” tariffs, effective immediately. This boosts sentiment for industrials, consumer goods, and global supply chain-reliant stocks. The government is appealing the ruling.
US Dollar Strengthens: The DXY is back above 100, up 1.8% from last week’s lows. A strong dollar helps importers but may pressure exporters and commodities.
Fed Rate Cut Expectations Decline: Markets now price 42 bps of rate cuts in 2024, down from 50 bps. This supports financials (e.g. banks), but challenges rate-sensitive sectors like real estate and small caps.
Mixed Eurozone Data: Positive Italian confidence figures offset weak German and French job numbers, offering slight global risk support. Limited direct impact on US stocks.
Fed Flags Stagflation Risk: Minutes show the Fed is worried about stagflation. This could weaken confidence in growth stocks and favor defensive sectors.
Today’s US Data Watch:
Q1 GDP 2nd estimate (expected -0.3%)
Weekly jobless claims
Fed speakers
All ahead of Friday’s key PCE inflation data
Market Outlook
Positive: Trade relief, resilient dollar, stronger bank outlook
Caution: Slowing growth, inflation worries, fewer rate cuts
Focus Areas: Industrials, financials, tech (watch for pullbacks); avoid rate-sensitive sectors short term
Key Support and Resistance Levels
Resistance Level 1: 6010
Resistance Level 2: 6070
Resistance Level 3: 6160
Support Level 1: 5780
Support Level 2: 5740
Support Level 3: 5700
This communication is for informational purposes only and should not be viewed as any form of recommendation as to a particular course of action or as investment advice. It is not intended as an offer or solicitation for the purchase or sale of any financial instrument or as an official confirmation of any transaction. Opinions, estimates and assumptions expressed herein are made as of the date of this communication and are subject to change without notice. This communication has been prepared based upon information, including market prices, data and other information, believed to be reliable; however, Trade Nation does not warrant its completeness or accuracy. All market prices and market data contained in or attached to this communication are indicative and subject to change without notice.

US500 Is Going Down! Sell!
Please, check our technical outlook for US500.
Time Frame: 1D
Current Trend: Bearish
Sentiment: Overbought (based on 7-period RSI)
Forecast: Bearish
The market is approaching a key horizontal level 5,960.96.
Considering the today's price action, probabilities will be high to see a movement to 5,538.99.
P.S
We determine oversold/overbought condition with RSI indicator.
When it drops below 30 - the market is considered to be oversold.
When it bounces above 70 - the market is considered to be overbought.
Disclosure: I am part of Trade Nation's Influencer program and receive a monthly fee for using their TradingView charts in my analysis.
Like and subscribe and comment my ideas if you enjoy them!

US500 - Will the stock market reach ATH?!The index is above the EMA200 and EMA50 on the four-hour timeframe and is trading in its ascending channel. I expect the index to continue moving, and on the other hand, if the index declines towards a certain zone, you can also look for the next S&P long positions with a risk-reward ratio.
Yesterday, a U.S. federal court halted the implementation of President Trump’s “Freedom Day” tariffs. The U.S. Court of International Trade ruled that these tariffs exceeded the legal authority granted to the president and unanimously decided to revoke them. Nonetheless, Trump still retains the right to appeal the ruling.
Following the court’s decision, President Trump promptly filed an appeal. In response, the White House issued a statement asserting, “The decision on how to handle a national emergency should not fall into the hands of unelected judges.”
Meanwhile, the market reacted strongly to Nvidia’s latest financial report. The company’s stock surged by as much as 5.8% in after-hours trading, before settling at a 4.8% gain compared to the previous day.
This bullish movement reflects investors’ confidence in Nvidia’s continued strong performance.
Nvidia is actively expanding into new markets, including the Middle East—an indication that the company is poised for sustained growth even if its presence in China is constrained.
The rally in Nvidia’s stock didn’t just lift semiconductor companies; broader markets followed suit. The S&P 500 index climbed to 6,005.75 points, representing a 1.7% increase from the prior session.
According to the company’s announcement, Nvidia posted $44.1 billion in revenue for the first quarter of fiscal year 2026, marking a 69% increase year-over-year and slightly surpassing analysts’ expectations. Revenue from data center operations rose 73% to reach $39.1 billion.
CEO Jensen Huang stated: “Our Blackwell NVL72 AI supercomputer—designed for reasoning and acting as a ‘thinking machine’—is now being mass-produced by system builders and cloud service providers.” He added, “There is enormous global demand for Nvidia’s AI infrastructure. Over the past year alone, AI inference token generation has grown tenfold. As AI agents become mainstream, the demand for AI compute will continue to surge.”
A Reuters poll now projects that the S&P 500 will reach 5,900 by the end of 2025—down from the 6,500 level forecast in February. Similarly, the Dow Jones index is expected to close 2025 at 43,708, compared to the previous projection of 47,024 from the February survey.
Separately, the Federal Deposit Insurance Corporation (FDIC) reported that the increase in U.S. bank profits was largely driven by growth in noninterest income. Bank earnings in the first quarter of 2025 rose by 5.8%, reaching $70.6 billion. While overall asset quality remains favorable, the commercial real estate loan portfolios continue to show signs of weakness. The number of “problem banks” declined by three, bringing the total down to 63. The banking industry also reported a slowdown in lending growth; the annual loan growth rate for the first quarter was just 3%, down from the pre-pandemic average of 4.9%.

SP500 // Stock Market Still a Buy? Here’s My ETF ApproachUnlike the Forex market, in the stock market—even when we’re hitting new highs and running out of chart space—it still makes sense to continue accumulating positions in U.S. indices. For a more profitable and diversified approach, ETFs offer a wide range of options: SPY, TQQQ, QQQ, and international ones like VEA.
Where do you trade stocks? I'm curious to hear what platforms and strategies others are using.
If you have any questions about building a portfolio or selecting ETFs, feel free to reach out. Happy to share insights and help where I can.
Wishing you consistency and strong returns.

Skeptic | SPX 500 Update: Bullish Breakout Brewing?Hey everyone, Skeptic here! It’s been a while since we’ve checked in on the SPX 500 , but the market’s now flashing a killer long opportunity with a high R/R—don’t miss this one! 😊 Stay with me to the end for the full breakdown. Let’s dive into the Daily Timeframe to set the stage. 📊
Daily Timeframe: The Big Picture
The SPX 500 pulled off a deep correction , dropping from a high of 6154.64 to lows around 4810.39 with some wild shadows that caught everyone off guard. But now, it’s firing up with fresh momentum, carving out higher highs and higher lows that scream bullish strength. The corrections in this new uptrend are super shallow and flow with the trend—exactly what we want to see! After hitting resistance at 5961.82 , we’ve had a slight pullback, but it looks like this correction is wrapping up, and we’re on the verge of the next big uptrend leg. Let’s zoom into the 4-Hour Timeframe to hunt for long and short triggers.
4-Hour Timeframe: Long & Short Setups
On the 4-hour chart, the correction shaped up as a descending trendline . We broke it, pulled back, and now we’re primed to crack 5895.39. A breakout above this level is our main long trigger. To get more precise, let’s check the 1-Hour Timeframe.
For the long setup , a clean break above 5896.34 gets us in the game. This move also busts through P.P. Level 1, giving us solid confirmation, and we could ride the wave up to P.P. Levels 3 or 4, targeting 5930.83 to 5956.97 . Those are prime spots to lock in some profits, but don’t close the whole position—since we’re trading with the trend, we can hold for more upside. For shorts, I’ve got nothing. Going against this bullish momentum would be pure madness! I’d wait for a sharp drop below support at 5849.67 before even considering short triggers, but right now, there’s zilch.
💬 Let’s Talk!
If this update sparked some ideas, give it a quick boost—it means a lot! 😊 Got a pair or setup you want me to tackle next? Drop it in the comments. Thanks for hanging out— let’s grow together and remember: Weathermen forecast. We trade! :))) ✌️

SP500CFD // The bowl is completed at the 6128.16 level, we can see this level as a sales opportunity and make some profit. When we sell, our take profit point is 10 exponentials.

SHORT The S&P 500 Index: Not A Bear Market, Just A CorrectionWe are about to witness an inception of bearish action. A correction within a correction.
After 7-April, the Cryptocurrency market started to recover, but the main Altcoins that were growing were all memecoins, and I wondered, "Why are mainly memecoins growing?" I know that when memecoins grow the market is actually bearish on the bigger picture. I shrugged it off and went LONG.
It seems I have an explanation now, this recovery was only a partial recovery or, we are just in front of a classic retrace, a small correction. This means that regardless of how fast and strong it goes the end will result in a higher low, compared to 7-April. This means that the bullish structure will remain intact, but you can't change the fact that strength is not present on this chart.
The SPX is going down next. There two main support levels to consider, you decide which one is the one that you should take. My job is to alert you of the event before it happens, great timing and entry prices, you can take care of the rest.
Thank you for reading.
This is a friendly reminder.
Market conditions can always change.
Namaste.

[05/27] Weekly GEX Outlook for SPX⚠️ Unbalanced GEX & Institutional Hedging – A Closer Look
I haven’t seen such an asymmetric GEX setup in quite a while — and it’s definitely not a pretty one 😬. The current profile suggests a highly skewed positioning in the market:
📍 Massive upside expectation:
It feels like the market is almost exclusively preparing for a move toward 6000.
🛑 Limited downside protection:
Below the current level, there's very little hedging in place — especially unusual with Friday’s expiry approaching.
🔻 Current Key Zone: 5925-5930
The largest put open interest is sitting right around 5925, which is also close to spot.
Below that? Things get murky. The GEX profile becomes fragmented and mixed, with no clear put support until much lower.
Interestingly, most of the current downside hedging is clustered around the 5900–5925 range, which includes ITM puts — not OTM, as you’d typically expect from retail.
🧠 Institutional Footprint vs. Retail
This hedging pattern — closer to ATM rather than deep OTM — suggests institutional players are managing downside risk with precision.
In contrast, retail traders don’t seem to be actively hedging the downside with OTM puts, which is a notable shift from typical behavior in high-IV weeks like this.
🔼 What to Watch: The 5930 Breakout
If SPX can break and hold above 5930, it enters a clear, call-dominated zone.
From there, the path to 6000 looks much cleaner, with lighter resistance and the potential for a gamma-driven push 📈.
The details show the same picture when examining more details:
SPX conclusion
😬 In short: we’re at a tipping point.
Below 5900, hedging is tactical and institutional.
Above 5900, the path is open to 6000 — but only if bulls can take control at 5930!

SPX500 H4 I Bearish Drop Based on the H4 chart, the price is approaching our sell entry level at 6001.65, a pullback resistance.
Our take profit is set at 5849.37, a pullback support.
The stop loss is set at 6153.88, a swing high resistance.
High Risk Investment Warning
Trading Forex/CFDs on margin carries a high level of risk and may not be suitable for all investors. Leverage can work against you.
Stratos Markets Limited (tradu.com ):
CFDs are complex instruments and come with a high risk of losing money rapidly due to leverage. 63% of retail investor accounts lose money when trading CFDs with this provider. You should consider whether you understand how CFDs work and whether you can afford to take the high risk of losing your money.
Stratos Europe Ltd (tradu.com ):
CFDs are complex instruments and come with a high risk of losing money rapidly due to leverage. 63% of retail investor accounts lose money when trading CFDs with this provider. You should consider whether you understand how CFDs work and whether you can afford to take the high risk of losing your money.
Stratos Global LLC (tradu.com ):
Losses can exceed deposits.
Please be advised that the information presented on TradingView is provided to Tradu (‘Company’, ‘we’) by a third-party provider (‘TFA Global Pte Ltd’). Please be reminded that you are solely responsible for the trading decisions on your account. There is a very high degree of risk involved in trading. Any information and/or content is intended entirely for research, educational and informational purposes only and does not constitute investment or consultation advice or investment strategy. The information is not tailored to the investment needs of any specific person and therefore does not involve a consideration of any of the investment objectives, financial situation or needs of any viewer that may receive it. Kindly also note that past performance is not a reliable indicator of future results. Actual results may differ materially from those anticipated in forward-looking or past performance statements. We assume no liability as to the accuracy or completeness of any of the information and/or content provided herein and the Company cannot be held responsible for any omission, mistake nor for any loss or damage including without limitation to any loss of profit which may arise from reliance on any information supplied by TFA Global Pte Ltd.
The speaker(s) is neither an employee, agent nor representative of Tradu and is therefore acting independently. The opinions given are their own, constitute general market commentary, and do not constitute the opinion or advice of Tradu or any form of personal or investment advice. Tradu neither endorses nor guarantees offerings of third-party speakers, nor is Tradu responsible for the content, veracity or opinions of third-party speakers, presenters or participants.

SPX: This is what I see happening...This will be a roller coaster ride for the next year or two. I am seeing 3 waves structures everywhere....a ginormous ending diagonal finish that may take SPX to 7500 to 8k. What comes next will be anyone's guess! For now, need to stay vigilant and manage money with caution.

