Moody’s U.S. Downgrade – Why Markets May Stay ResilientMoody’s downgrade of the U.S. credit rating from Aaa to Aa1 is notable but unlikely to trigger a major market sell-off. Here’s why:
Why a Severe Drop Is Unlikely:
Already Priced In: Follows similar actions by S&P (2011) and Fitch (2023); markets may have already adjusted.
Minimal Regulatory Impact: Aa1 is often treated similarly to Aaa in capital and collateral rules.
Stable Outlook: Signals no immediate risk of further downgrades, offering reassurance.
U.S. Strengths Intact: Economic size, resilience, and dollar reserve status continue to underpin investor confidence.
Possible Reactions:
Treasury Yields: May rise slightly on risk re-pricing.
Equities: Modest pullback possible, but no sharp correction expected.
Sentiment: Could revive fiscal debate, but not a game-changer for positioning.
Conclusion: The downgrade highlights longer-term fiscal concerns but is unlikely to cause immediate market turmoil.
#Moody’s #USDebt #CreditDowngrade #MarketOutlook #TreasuryYields #SPX #RiskSentiment
SPX500 trade ideas

Correction and up for SPX500USDHi traders,
Last week SPX500USD slowly went up some more. The pullbacks are overlapping so it looks like price is forming a leading diagonal (wave 1).
I'm still expecting a downmove because of the price action. Price came into the 4H FVG and is showing a bearish doji. So next week we could see a (corrective) move down.
Let's see what the market does and react.
Trade idea: Wait for price to develop some more before you take any trades.
If you want to learn more about trading FVG's & liquidity sweeps with Wave analysis, then please make sure to follow me.
This shared post is only my point of view on what could be the next move in this pair based on my technical analysis.
Don't be emotional, just trade your plan!
Eduwave

SPX: time to digest the uptrend?The S&P closed the week at 5,958, continuing its climb along a steep uptrend that’s been in place since mid-April. While momentum remains bullish, we’re now entering a zone where digestion or short-term pullbacks would not be surprising. And not because of weakness, but after every run is a period of digestion.
In this video I first go through how I clear out the noise to focus on the outlook for the next few weeks, re-chart my levels and trendlines, and walk through potential scenarios for the coming week.

S&P 500 Daily Chart Analysis For Week of May 16, 2025Technical Analysis and Outlook:
The S&P 500 Index showed a steady upward trend during this week's trading session, successfully reaching a key target at the Outer Index Rally level of 5955. However, it's important to note the significant downward trend due to letter completion, which could lead to a decline toward the Mean Support level of 5828. Additionally, there is a possibility of further drops to the Mean Support level of 5661. On the other hand, the index may continue to rise from its current level, potentially advancing toward the Inner Currency Rally target set at 6073.

S&P 100Trade Plan BUY S&P 100 ENTRY-1
Entry-1 5720
SL 5578
RISK 142
REWARD 1717
Target as per Entry 7437
RR 12.1
Last High 6147
Last Low 4843
Trend: All timeframes are in a clear UP trend, suggesting bullish sentiment across the board.
Demand Strength: As we move from macro to micro, the demand zones are increasing:
Macro demand: 4750 (lower)
Mid-term demand: 5398 (higher)
Micro demand: 5668 (highest)
Implication:
The upward trend across all timeframes and rising average demand zones suggest strong bullish momentum.
If price pulls back, the 4750–4807 zone could act as strong macro support.
For short-term entries or intraday trades, 5668 is the key support level to watch.
🔹 Macro View (Long-Term Demand Zones)
Time Frame Trend Proximal Distal Avg
Yearly UP 4818 4682 4750
Half-Yearly UP 4818 4682 4750
Quarterly UP 4818 4682 4750
Macro Avg UP 4818 4682 4750
🔹 Mid-Term View
Time Frame Trend Proximal Distal Avg
Monthly UP 4931 4682 4807
Weekly UP 5720 5578 5649
Daily UP 5787 5692 5740
Mid-Term Avg UP 5479 5317 5398
🔹 Micro View (Short-Term)
Time Frame Trend Proximal Distal Avg
240 Min UP 5691 5644 5668
180 Min UP 5691 5644 5668
60 Min UP 5691 5644 5668
Micro Avg UP 5691 5644 5668

BUY s&p 500Elliott wave forecast clearly indicates 3 wave ABC is ended.
a new ABC wave emerging to reach the previous highs
Traders can use this bullish recovery for short term oppertunity

MASTER PATTERN TEACHING using TradingView charts. Master pattern - Tonight we are looking at the SPX 500 index directional trade. Using Options.
This is a master pattern technical analysis set up for entry, discipline and execution of a trade.
I will use the 3 time frames to identify
1) Higher time frame ( HTF) Direction trade, trend & liquidity, volume confirmation, and the contraction box
2) Lower time frame ( LTF) Market makers and smart money set up contraction and expansion phases
3) Lower time frame ( LTF) Continuation leg of the trend
Once I have identified and selected my option DTE and spread I will execute when the LTF has reached a new low in the intraday.
Hope you learned something new.
Happy Trading.
Tommaso

Master Pattern SPX 500 We can see the Master pattern from Daily, 4 HR, and 30 Minute. We use the Larger Time Fram to identify the trend. Using the Lower time frame, the 30 minute, to enter the trade in the direction of the trend.

SPX500 Hits Major Supply Zone – Will the Bears Take Over?The S&P 500 (SPX500) just tapped a significant supply zone between 5945–5952, a key level where previous selling pressure led to strong bearish moves. Price is currently showing signs of exhaustion at the top of this zone on the 4H timeframe, and we may be witnessing a potential reversal setup.
Key Levels:
Supply Zone (Resistance): 5945 – 5952
Mid-Support: 5478
Demand Zone (Strong Support): 4916 – 4920
Possible Scenarios:
1. Rejection from the supply zone could trigger a pullback to 5478, and if that breaks, the next bearish target would be the demand zone at 4916.
2. If the bulls break and close above 5952 with strong momentum, we might see new highs, but volume confirmation is needed.
Watch for:
Bearish candlestick patterns in the supply zone
Reversal confirmation with RSI or MACD divergence
Volume drop on the breakout attempt
Red Arrows Mark: High-probability downside targets in case of reversal.
With key economic events marked on the chart (highlighted on May 22), volatility is expected. A fakeout or whipsaw move could be in play—stay cautious!
Are you bullish or bearish on SPX500? Drop your thoughts below and don’t forget to like and follow for more institutional-level analysis!
#SPX500 #S&P500 #LuxAlgo #SupplyDemand #TradingView #Forex #Stocks #PriceAction #SmartMoney #TechnicalAnalysis #SP500Analysis

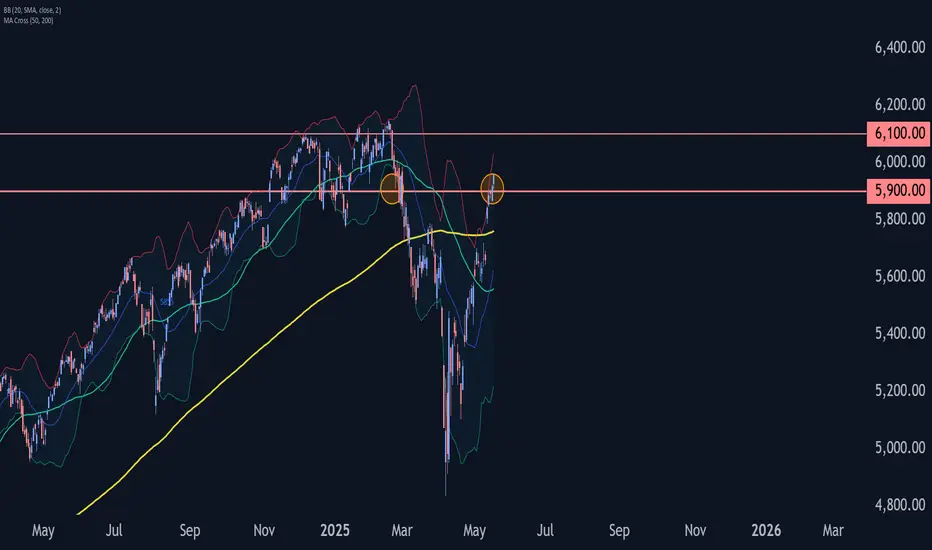
S&P 500 Wave Analysis – 16 May 2025
- S&P 500 broke the resistance level 5900.00
- Likely to rise to resistance level 6100.00
S&P 500 index recently broke the resistance level 5900.00, the former support from January and February.
The breakout of the resistance level 5900.00 should accelerate the active short-term impulse wave 3, which belongs to the intermediate impulse wave (3) from the end of April.
S&P 500 index can be expected to rise to the next resistance level 6100.00, which reversed the price multiple times from December to March, as can be seen below.
No need to fomo on SPX, a dip will happen before hitting highsmarkets are going up on illusions and fomo, SPX dip incoming, monthly and daily support that

+10% from tomorrow till mid-MaySPX is getting ready to rebound with around 10% till mid-May. Invalidated if breaks below 5400.

$SPX May 16 2025 Contract - Analysis & Targets for Day TradersSP:SPX May 16 2025 Contract - Analysis & Targets for Day Traders
This is for Friday May 16th. Let's go

SPX going to push more before going downmarkets are strong, suadi money buying, bears will believe we going much higher, they fomo, and just like that the dump begins.

S&P500 Historic reversals like this delivered even +100% gains!The S&P500 (SPX) is making a remarkable bullish reversal and on the monthly (1M) chart is even more evident due to April's candle, which almost closed flat leaving a huge wick under it, a feat we've never seen in recent history.
What we have seen however since the 2008 Housing Crisis, is every time the index hits (or approaches) its 1M MA50 (blue trend-line), it reverses to an incredible rally, technically a new Bull Cycle.
This is what happened in April, the index came a breath away from the 1M MA50 and delivered the strongest monthly bullish reversal of our time. On top of that, it hit and rebounded exactly on the former All Time High Resistance, which held and turned into Support. All such Resistance levels since 2008 have held. Also note that the only time the 1M MA50 really broke (closed the month below it), was during the March 2020 COVID flash-crash, which is a non-technical event/ irregularity and still it rebounded on the 1M MA100 (green trend-line).
The minimum long-term rise that SPX had after such correction was +76.20% and the maximum +104.17%. Assuming the minimum price increase for the current emerging rise, we expect the index to hit 8300 by late 2027.
-------------------------------------------------------------------------------
** Please LIKE 👍, FOLLOW ✅, SHARE 🙌 and COMMENT ✍ if you enjoy this idea! Also share your ideas and charts in the comments section below! This is best way to keep it relevant, support us, keep the content here free and allow the idea to reach as many people as possible. **
-------------------------------------------------------------------------------
💸💸💸💸💸💸
👇 👇 👇 👇 👇 👇

Could the US500 be setting up for a bounce?Hello,
The US500 is trading near the trend line, a key area where technical investors will be looking for a bounce back. While the current market remains choppy due to tariffs from the US president, technical analysis does offer us key areas where we can look for entries going forward.
What is certain is that this is not the time to panic and sell all your held positions. As always, during moments like these composure + a clear plan are your best line of defence. Probabilistic thinking as well can go a long way in identifying great opportunities. We’re all dealing with known and unknown variables now, and there’s no shame in saying, "I don’t know."
For me I see opportunities in the S&P especially because the news is already out. Additionally, we are coming into earnings season when the market is at the bottom. Companies that show resilience will attract early investors and the index will bounce back. So please keep your long-term view.
Disclosure: I am part of Trade Nation's Influencer program and receive a monthly fee for using their TradingView charts in my analysis.

SPX sideways for 4 weeksExpecting the main indices will experience some sideways motions for the next +/- 4 weeks. Top might be between 5,950 and 6,000. This doesn't mean ALL stock will be sideways. *(Defense sector seems very bullish)
Ultimately after wave 2 is complete Markets will have a good consolation / launching pad for Wave 3.

Bearish Alt-Bat Pattern Completed on SPX | Potential PullbackOANDA:SPX500USD
The Index is approaching a critical technical juncture as a bearish Alt-Bat harmonic pattern* completes on the 4-hour chart. This formation, finalized at the 113% Fibonacci extension level at $5,924 , signals a potential shift in market sentiment after a sustained period of upward momentum. Price action recently touched a new high at $5,924 , with immediate fractal resistance forming just above at $5,927 .
Despite this bullish extension, momentum indicators are flashing warnings. Both RSI and MACD are showing clear signs of bearish divergence, indicating that upward strength may be waning. When momentum weakens while prices continue rising, it often suggests that the underlying trend is becoming unstable.
A decisive break below $5,849 would likely confirm the pattern’s bearish implications and open the door to a corrective move. In that scenario, we will be watching for potential support near $5,579 , a previously tested level. If selling pressure continues, the next downside target could be around $5,500 , aligning with the 38.2% Fibonacci retracement level and the projected Alt-Bat target zone.
* This setup doesn't guarantee a reversal, but it significantly raises the probability of a pullback in the short term. Price confirmation below key levels will be essential to validate the pattern and assess the strength of any emerging downtrend.
Happy Trading,
André Cardoso

[𝟬𝟱/𝟭𝟮] 𝗪𝗲𝗲𝗸𝗹𝘆 𝗦𝗣𝗫 𝗚𝗘𝗫 𝗣𝗹𝗮𝘆𝗯𝗼𝗼𝗸🔍 IF/THEN QUICK GAMMA PLAYBOOK
IF > 5825 THEN path to 5900 → stall/profit-taking likely
IF > 5900 THEN path to first 5950, then 6000 → gamma squeeze extension zone
IF < 5825 THEN path to 5700 → test of transition zone support
Chop Zone: — re-entry = short-term balance/testing zone
IF < 5700 THEN path to 5500 → gamma flush / dealer unwind risk
🧭 𝗘𝗫𝗧𝗘𝗡𝗗𝗘𝗗 𝗭𝗢𝗡𝗘 𝗠𝗔𝗣/b]
✅ Gamma Flip Level
5700 → This is the confirmed Gamma Flip level = High Volatility Zone = HVL. We are comfortably above it, confirming positive gamma environment.
🧱 Major Call Walls / Resistance to upside from here
5900 → Significant call resistance zone (highlighted across GEX, profile, and /matrix command). 5825–5900 = Current rally zone → expected stall at 5900 (Profit-taking zone)5950 → Next mid-large positive gamma wall to the upside, mid-station between mounts. Dealers short gamma, adding fuel to breakout.6000 → Positive Gamma squeeze continuation target. Gamma squeeze intensifies → likely extends to 6000.🟦 Transition / Chop Zone
5700–5825 → Previous chop range. Retrace could test this before renewed upside.Currently outside and breaking up from this zone, indicating trend initiation.
Balance zone from prior structure.
Expect fade setups if price dips back in.
Needs catalyst or strong sell flow to re-enter meaningfully.
🛡️ Major Put Supports to the downside
5700 → = HVL, also aligned with pTrans and Put support.Dealer unwind risk, downside opens.5500 → Key level if the 5700 zone fails — “total denial zone” of current FOMO.
-----------------------------
This week’s SPX setup remains decisively bullish from a gamma perspective. The GEX profile shows strong positive gamma, with institutional and dealer hedging flows firmly positioned to support continued upside—especially into Friday’s OPEX. The environment is ideal for a controlled melt-up: volatility is softening, implied volatility is trending lower, and there’s no sign of panic in the options market.
Put pricing skew is also declining, which suggests reduced fear and a shift toward more aggressive call buying—another sign of bullish sentiment. Dealer positioning implies that any upward momentum is likely to be chased and hedged into, reinforcing the trend.
However, traders should stay alert: if SPX slips back below 5825, we may see a pause or retracement back into the 5700–5825 transition zone. Only a decisive break below 5700 would flip the gamma regime back to negative and open the door to real downside volatility.

S&P500 - The bottom we have been waiting for!The S&P500 - TVC:SPX - officially created the bottom:
(click chart above to see the in depth analysis👆🏻)
This month we officially saw one of the craziest stock market fakeouts of the past decade. With a drop and reversal rally of about +15%, the S&P500 is about to even close with a green monthly candle, which then indicates that the stock market bottom was created.
Levels to watch: $120, $250
Keep your long term vision!
Philip (BasicTrading)

SP500 possible top, Gold looking Bullish again. All in the video. I know calling tops is dangerous, but I state my reasons why a turn from here is more likely than not. Gold now back into balance is bullish.

S&P500 INDEX (US500): More Growth is Coming
This week, S&P500 managed to violated a significant
daily demand zone.
It opens a potential for much more growth and trend-continuation.
Next resistance - 5973
❤️Please, support my work with like, thank you!❤️

$SPX Analysis, Key Levels & Targets for Day Traders // May 15 25SP:SPX Analysis, Key Levels & Targets for Day Traders // May 15 25
Let's go, we had PPI in premarket w// Powell... Today's range looks fun.
