SP500 weekly balance?JUst some ideas while looking at weekly charts. We've put in a doji on the week - indecision. A pullback to 6100 would start raising flags about a possible false breakout from balance.
SPX500 trade ideas

Short Term Risk On S&PMomentum is slowing on the S&P 500.
HT still looking nice.
Short term chance of a correction to around 6140 - conservative, potentially to 6070 if we see a deeper sell off.
Wouldn't want to be a buyer until we see a pullback like this or some strength.

Gap down is likely a bear trap - SPYSo the gap down looked bearish but the technicals are not confirming it. One more high is likely today or Monday. Gold is at resistance here. OIl found support and looks like a long. BTC rallied and can go higher but it's putting in daily bearish divergences. Natural Gas looks like it will bounce.

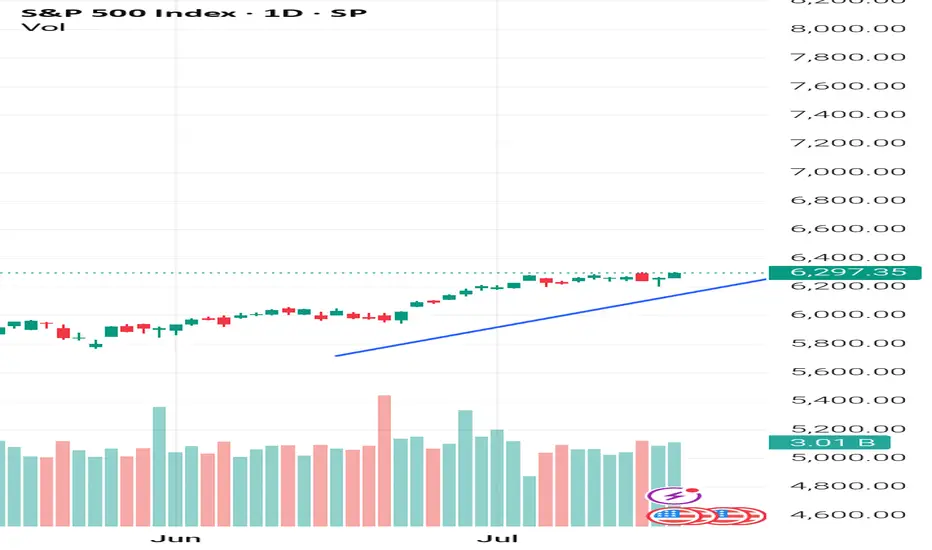
Quick take on the S&P500From the very short-term perspective, the SP:SPX is currently stuck in a tight range. Waiting for a little breakout.
Let us know what you think in the comments below.
Thank you.
75.2% of retail investor accounts lose money when trading CFDs with this provider. You should consider whether you understand how CFDs work and whether you can afford to take the high risk of losing your money. Past performance is not necessarily indicative of future results. The value of investments may fall as well as rise and the investor may not get back the amount initially invested. This content is not intended for nor applicable to residents of the UK. Cryptocurrency CFDs and spread bets are restricted in the UK for all retail clients.

Let’s talk about technical analysis & stops.Technical analysis is not your decision-making process — it’s a tool to help you structure better trading decisions by studying past price movements to anticipate likely future moves.
👉 Every time you look at a chart, you should decide:
✅ Do I want to trade at all?
✅ What’s my entry?
✅ Where’s my stop (when does my thesis fail)?
✅ What’s my target (where will I take profits)?
________________________________________
🛑 Where to put your stop?
Take the S&P 500 daily chart. It’s been trending up strongly. Many traders use an exponential moving average (EMA) as a dynamic stop.
But:
• A 9 EMA often stops you out too early on strong trends.
• Adjusting to a 15 or 16 EMA could keep you in the trade longer, letting your winners run.
In tools like TradingView, you can visually adjust the EMA and see in real time how it would have kept you in or taken you out.
________________________________________
💡 Key takeaway:
When price closes below your EMA stop — that’s your signal to exit and lock in profits.
Use TA to structure your trades, not just spot pretty patterns.
________________________________________
💬 What’s your favourite method for setting stops?
Disclaimer:
The information posted on Trading View is for informative purposes and is not intended to constitute advice in any form, including but not limited to investment, accounting, tax, legal or regulatory advice. The information therefore has no regard to the specific investment objectives, financial situation or particular needs of any specific recipient. Opinions expressed are our current opinions as of the date appearing on Trading View only. All illustrations, forecasts or hypothetical data are for illustrative purposes only. The Society of Technical Analysts Ltd does not make representation that the information provided is appropriate for use in all jurisdictions or by all Investors or other potential Investors. Parties are therefore responsible for compliance with applicable local laws and regulations. The Society of Technical Analysts will not be held liable for any loss or damage resulting directly or indirectly from the use of any information on this site.

S&P 500 - Sell in May, return anther day. The truth - 2025No doubt everyone has heard a variation of the phrase:
“Sell in May, return another day.”
In Wikipedia it is written:
“Sell in May and go away is an investment strategy for stocks based on a theory (sometimes known as the Halloween indicator) that the period from November to April inclusive has significantly stronger stock market growth on average than the other months. In such strategies, stock holdings are sold or minimised at about the start of May and the proceeds held in cash”
A public comment from last year:
“Over 100 years ago, the (practical) reason to sell in May and September, was to pay seasonal workers to seed the field (May) and to harvest (September). Caravans of landlords and farm owners went to New York to sell stocks and withdrew money from the banks to do payrolls
so for people without agricultural business, i'll say it's okay to hold in May”
If we are to take all this at face value then we should be unwinding our long term positions until the Autumn?
What does the chart say?
On the above monthly chart of the S&P 500 each vertical line marks the month of May going back to 2012. That is a dataset of 13 points.
The facts:
1) From the month of May onwards, 11 from 13 periods returned positive price action of not less than 10%. Selling in May was a bad choice.
2) 2015 and 2022 saw corrections of 15% from May onwards. However in both examples the correction was erased within 12 months as the index continued the uptrend.
In summary, 86% of the time a minimum return of 10% was seen before the year end. Amazing odds.
Furthermore, corrections up and until the end of April (like we’re now seeing) represented some of the best long opportunities.
Sell in May go away? I suggest it should be: Buy in June and watch it boom!
Ww

$100 to $1k to $10k to $100k: TRADING MASTERCLASSHow I approach trading:
Trading is a mostly psychological endeavor
You will not WIN LONGTERM in trading until you WIN YOURSELF (i.e. master your emotions)
I use Technical Analysis to help me determine overall Market Direction and Entry/Exit points
I do not use ANY fundamental analysis in my trading
I use Elliott Wave Theory to understand MARKET STRUCTURE
I use a combination of Anchored Volume Weighted Average Price (AVWAP), Fixed Range Volume Point of Control (VPOC) and custom coded Momentum indicators to pinpoint Entry/Exit points
Risk Management:
I will generally aim for 2%-5% percent stop loss but price structure will dictate as well
Position sizing will be fluid
Targets will be fluid but will generally target key Fib Extensions, VWAPs or VPOCs..or a combination of all of the above
Starting Account Size:
$100
Goal:
Grow a small $100 account to $1k then $10k then $100k
Every trade will be public...wins and losses
I will be looking to make my first trade(s) shortly and will show Entry level, Stop Loss and Target
NONE OF THIS CONSTITUTES FINANCIAL ADVICE

Bearish drop?S&P500 is reacting off the resistance level which is a pullback resistance and could drop from this level too ur take profit.
Entry: 6,237.85
Why we like it:
There is a pullback resistance level.
Stop loss: 6,268.46
Why we like it:
There is a pullback resistance level.
Take profit: 6,187.51
Why we like it:
There is a pullback support that is slightly below the 61.8% Fibonacci retracement.
Enjoying your TradingView experience? Review us!
Please be advised that the information presented on TradingView is provided to Vantage (‘Vantage Global Limited’, ‘we’) by a third-party provider (‘Everest Fortune Group’). Please be reminded that you are solely responsible for the trading decisions on your account. There is a very high degree of risk involved in trading. Any information and/or content is intended entirely for research, educational and informational purposes only and does not constitute investment or consultation advice or investment strategy. The information is not tailored to the investment needs of any specific person and therefore does not involve a consideration of any of the investment objectives, financial situation or needs of any viewer that may receive it. Kindly also note that past performance is not a reliable indicator of future results. Actual results may differ materially from those anticipated in forward-looking or past performance statements. We assume no liability as to the accuracy or completeness of any of the information and/or content provided herein and the Company cannot be held responsible for any omission, mistake nor for any loss or damage including without limitation to any loss of profit which may arise from reliance on any information supplied by Everest Fortune Group.

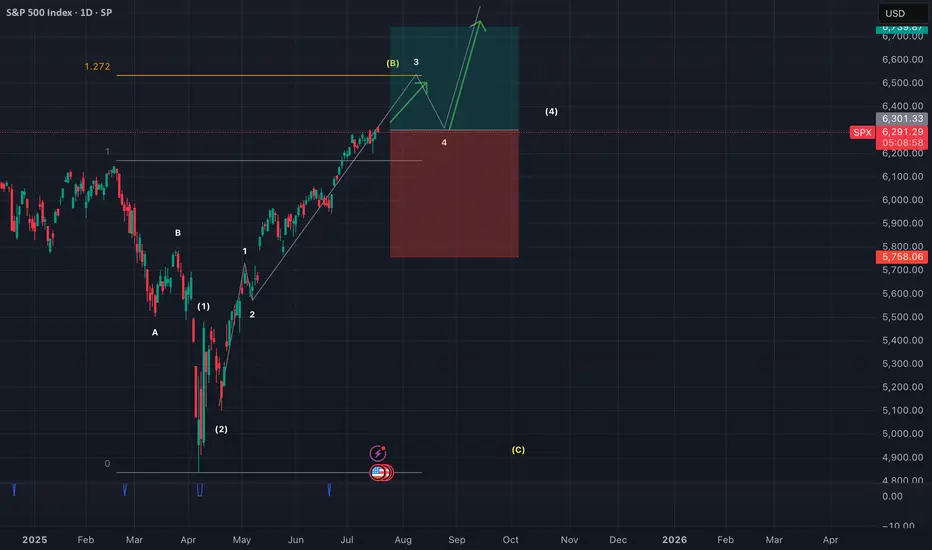
SPX500 in a Powerful Wave 3 Expansion – New Highs on the HorizonMarket Analysis – SPX500 (S&P 500 Index CFD)
The SPX500 is currently exhibiting a strong bullish structure, consistent with the characteristics of an Elliott Wave 3 extension. This wave phase is typically the most powerful and impulsive part of a bullish cycle, often driven by increasing market confidence, strong macroeconomic fundamentals, and institutional accumulation.
After completing a textbook corrective Wave 2, the index has broken key resistance levels with strong momentum, confirming the beginning of Wave 3. What sets this phase apart is its capacity to generate accelerated gains, often surpassing expectations and historical highs.
Key signs supporting the Wave 3 hypothesis:
High volume breakout from consolidation zones.
Higher highs and higher lows structure on multiple timeframes.
Confirmation from supporting indicators such as RSI holding above 50 and MACD showing strong upward momentum.
What’s next?
As long as market structure remains intact and no significant bearish divergence appears, we can expect multiple new all-time highs to be formed during this wave. Traders should look for retracement entries using Fibonacci levels (e.g., 38.2% or 50% pullbacks) to ride the trend while managing risk carefully.
Outlook:
Bullish bias remains strong. Strategic buying during minor corrections could offer favorable risk-reward setups throughout the progression of this wave.

Market ViewWatch
Trade
Manage
Smile
Rejection Level
Daily Volume
Market Structure Shift
London US Session
Trend Line Break
Untapped Order Point

S&P 500 Daily Chart Analysis For Week of July 11, 2025Technical Analysis and Outlook:
During this trading week, the S&P 500 Index has shown a predominantly downward/upward course of action and created a new Key Resistance at 6280. Currently, the index exhibits a bullish bias, with the Outer Index Rally objective set at 6420. However, it is crucial to note that the current price action may cause prices to see in a new light from their current fluctuation to push toward the Mean Support at 6200 before resuming their upward movement.

Risk environment to remain positive? S&P continuation?Despite all the recent tariff concerns, inflation concerns and Middle East worries. The S&P continues to push all tine highs. And 'risk surprises' not withstanding, is likely to do so. Backed up by a solid start to ratings season, especially from Netflix.
In the currency space, that should mean the JPY remains weak. And I'm cutoutting recent JPY strength due to profit taking ahead of weekend elections. But moving into the new week, i'll be looking for JPY short opportunities.
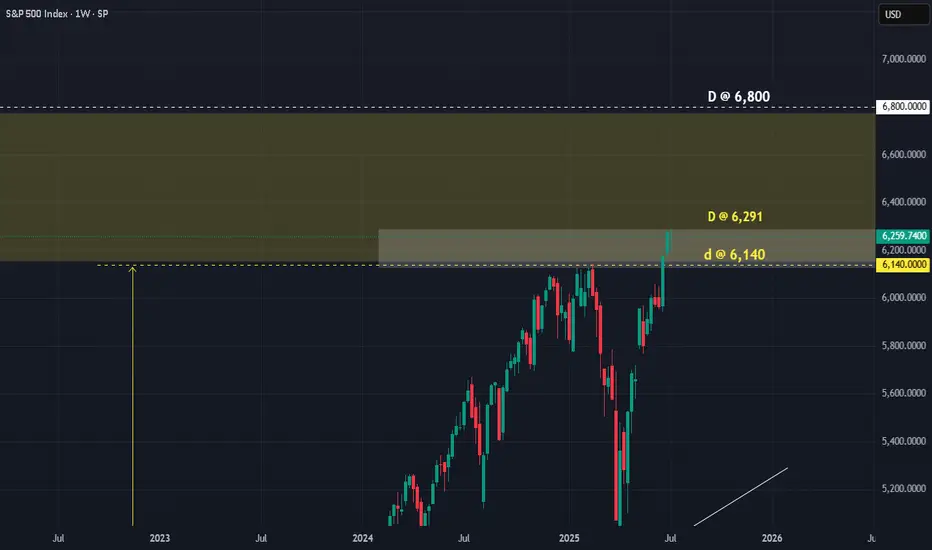
SPX : How to play this DPrice has now reached our target as anticipated. The question is, when do we SELL?
Anyway, for those who follow the D, I am sure it has saved you guys a lot of trouble. At least you know where/when to start SELLING. Many others who started selling EARLy had all lost their money.
As we can see, there are 3 D's. Price can still move UP to 6,800. Bear that in mind. Or has already reached the max at 6,291!!!
Price is at where they are, there are 2 choices:
a) SELL now and SL @ 6,300
b) SELL when price touched the lower D @ 6,140 with SL @ 6,291
Whichever way, the R/R is still FANTASTIC.
It is true that MARKET MAKER might still take advantage and try to screw short sellers. But even they would find it hard at the D. For even they need to respect it a bit.
If you know your D, you trade safer.
Good luck.
S&P 500 - Medium Timeframe AnalysisAs illustrated, we appear to be in the final wave to the upside. At this stage, I’m treating Wave 5 as a standard impulse. However, given that Wave 4 retraced deeply, nearly to the termination point of Wave 1, there remains a modest possibility that this higher-degree Wave 5 in gray, which began in 2020, could ultimately unfold as an ending diagonal. That said, this scenario remains highly unlikely, as the internal structure of the preceding waves does not exhibit the characteristics of corrective price action.

SPX500 in bullish impulseSPX500 currently at 3rd wave of wave (3) (both 2.618% extended). Expecting a retrace at 6517 region for wave 4.
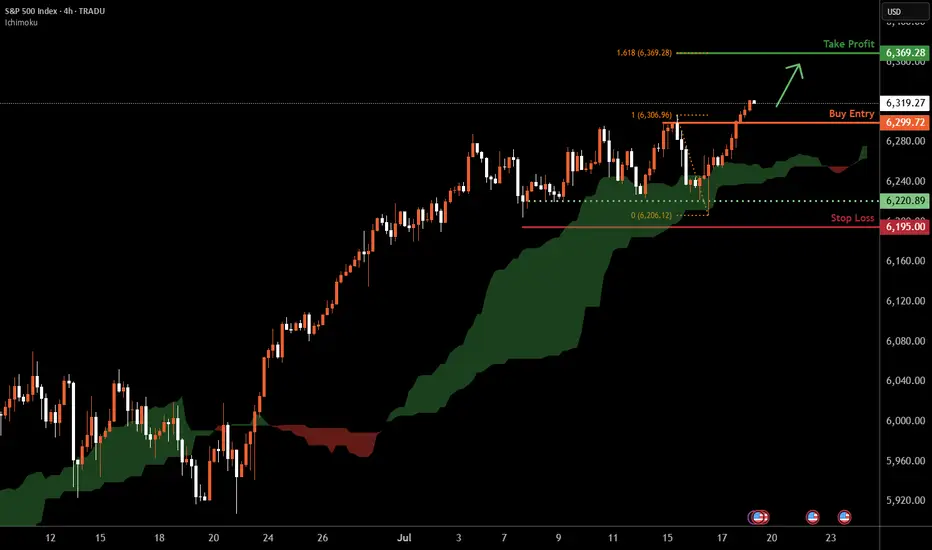
S&P 500 H4 | Making a run towards a new ATH?The S&P 500 (SPX500) is falling towards a pullback support and could potentially bounce off this level to climb higher.
Buy entry is at 6,299.72 which is a pullback support.
Stop loss is at 6,195.00 which is a level that lies underneath a multi-swing-low support.
Take profit is at 6,369.28 which is a resistance that aligns with the 161.8% Fibonacci extension.
High Risk Investment Warning
Trading Forex/CFDs on margin carries a high level of risk and may not be suitable for all investors. Leverage can work against you.
Stratos Markets Limited (tradu.com ):
CFDs are complex instruments and come with a high risk of losing money rapidly due to leverage. 66% of retail investor accounts lose money when trading CFDs with this provider. You should consider whether you understand how CFDs work and whether you can afford to take the high risk of losing your money.
Stratos Europe Ltd (tradu.com ):
CFDs are complex instruments and come with a high risk of losing money rapidly due to leverage. 66% of retail investor accounts lose money when trading CFDs with this provider. You should consider whether you understand how CFDs work and whether you can afford to take the high risk of losing your money.
Stratos Global LLC (tradu.com ):
Losses can exceed deposits.
Please be advised that the information presented on TradingView is provided to Tradu (‘Company’, ‘we’) by a third-party provider (‘TFA Global Pte Ltd’). Please be reminded that you are solely responsible for the trading decisions on your account. There is a very high degree of risk involved in trading. Any information and/or content is intended entirely for research, educational and informational purposes only and does not constitute investment or consultation advice or investment strategy. The information is not tailored to the investment needs of any specific person and therefore does not involve a consideration of any of the investment objectives, financial situation or needs of any viewer that may receive it. Kindly also note that past performance is not a reliable indicator of future results. Actual results may differ materially from those anticipated in forward-looking or past performance statements. We assume no liability as to the accuracy or completeness of any of the information and/or content provided herein and the Company cannot be held responsible for any omission, mistake nor for any loss or damage including without limitation to any loss of profit which may arise from reliance on any information supplied by TFA Global Pte Ltd.
The speaker(s) is neither an employee, agent nor representative of Tradu and is therefore acting independently. The opinions given are their own, constitute general market commentary, and do not constitute the opinion or advice of Tradu or any form of personal or investment advice. Tradu neither endorses nor guarantees offerings of third-party speakers, nor is Tradu responsible for the content, veracity or opinions of third-party speakers, presenters or participants.
US500 evening analysisMy primary count of bullish price action since 7 April 2025 low sees regular flat (regular flat A, zigzag B, impulse C), impulse C with ending diagonal 5 of (5).
Median line (red line) of pitchfork was never tagged, implies price action eventually returning to origin (5098.6).
Ending diagonal invalid above 6307.2, bears with high reward, low risk opportunity.

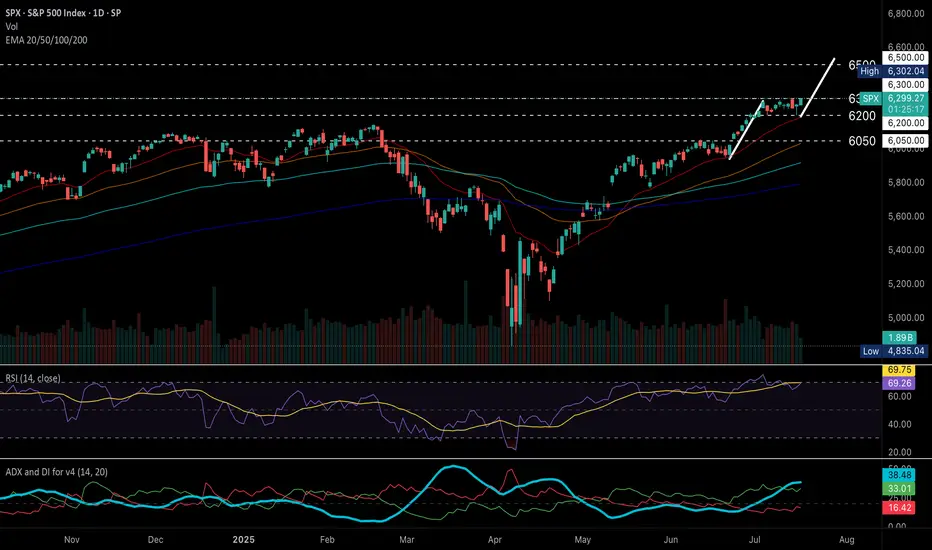
S&P 500 (US500) maintains strong bullish momentum.S&P 500 (US500) maintains strong bullish momentum.
Technical Outlook
S&P 500 (US500) holds a strong bullish structure, continuing to print higher highs and higher lows above diverging EMAs, signaling sustained upward momentum.
RSI has eased from overbought levels, now hovering below 70, while price consolidates sideways near recent highs, a typical pause before potential continuation.
ADX remains elevated above DI+ and DI-, with DI+ above DI–, confirming trend strength and ongoing bullish momentum.
A breakout above the 6300 all-time high would confirm a bullish continuation, with the next upside target near 6500 based on the flagpole projection.
Conversely, a drop below 6200 may trigger a deeper pullback toward the 6050 support zone.
Fundamental Outlook
Corporate earnings, particularly in the tech sector, continue to exceed expectations, providing significant support to the index. Analysts project continued earnings growth for S&P 500 companies, with profits expected to grow by approximately 9% year-over-year in 2025, reinforcing confidence in the index’s rising fundamental valuation.
Markets are now pricing in earlier Fed rate cuts, driven by evolving economic data and political pressure.
Economic data such as stronger-than-expected retail sales and unemployment claims, though the latter could reduce the likelihood of imminent rate cuts, signal robust consumer demand, which should continue to support economic growth.
by Terence Hove, Senior Financial Markets Strategist at Exness
Congress passes H.R 1 into law. About the new bill.🔵 In what's been an eventful last few weeks congress passed H.R 1 which is essentially Trump's 900 page mega bill Act. Both Democrats and Republicans ultimately united against each other over the bill with Vice President Vance casing the tiebreaking vote giving Senate Republican's the large legislative victory.
🔵 To note is that independent-minded Republican Lisa Murkowski, senator of Alaska had some concerns with the bill before GOP negotiators we're able to acquire her vote for the 50-50 votes. Murkowski's primary issue was with the legislation's changes to Medicaid and federal food assistance funding which she was concerned would hurt her home state understandably. Republican's originally tried to sway her vote by adding language to shield Alaska from the full effect of the legislation's Medicaid and SNAP cuts.
🔵 Parliament opposed that as it violated the Byrd Rule which is there to determine the legislation that can go into a budget reconciliation package as well as passing with only GOP votes. Least to say the amendment was reworked many times in order for the waivers for the SNAP funding cuts to apply more broadly than just Alaska and Hawaii. Parliament rejected the prior amendment and language which targeted just the two states understandably.
🔵 With the rework the new SNAP provisions are planned to reduce food assistance funding more slowly in about 10 states with the number ultimately being decided by a formula and based on the error rate in delivering food assistance benefits in a year. After an arduous process the amendment was passed and Republican's secured the vote with Murkowski saying it was an agonizing process.
🔵 When speaking with reporters afterwards Murkowski noted that the process was stressful with them operating under an artificial timeline in reference to the pressure Trump put on the Senate to pass the bill.
🔵 Her concern was as follows: “Rather than taking the deliberative approach to good legislating, we rushed to get a product out. This is important. I want to make sure that we’re able to keep in place the tax cuts from the 2017 Jobs Act,” said Murkowski when asked about her support for the bill and why it was hard for her to come around to giving her vote.
🔵 “I struggled mightily with the impact on the most vulnerable in this country when you look to the Medicaid and the SNAP provisions,” said Murkowski. This point highlights just how the effort to push the bill through was met with haste and pressure notably.
🔵 The bill itself is projected to add $2.8 trillion to the federal deficit by 2034. Main reason for that would be thanks to a reduction in revenues as well as interest cost which could have the deficit rise by a potential $5 trillion if some temporary provisions become permanent. Interest payments on the national debt are also expected to increase significantly by 2034.
🔵It should be noted that these numbers and estimates are based on a "current law" baseline and are largely thanks to tax cuts in the bill with Economist having differing opinions on the economic impact of the bill. Time will tell us how estimates go but least to say this is a large turnaround from what many we're expecting with even DOGE's Elon Musk opposing the Bill and forming a new party in strong opposition.
🔵 The tax and spending bill will see spending increase and phase in a cut to Medicaid of an estimated $1 trillion over the next decade with the CBO projecting roughly 11.8 million more American's t hat would become uninsured within the next 10 years compared to the current law. This could lead to many losing healthcare services due to medical cost with states as well likely needing to adjust their own programs and having to take on a larger share of the cost whether that means reducing services or even closing some facilities.
🔵 The bill has many key changes but in summary it solidifies many tax breaks from Trump's first term with an estimated $4.5 trillion in tax cuts alongside tax deductions on tips, overtime and auto loans with deductions for adults that make under $75,000 and a boost to the child tax credit from $2,000 to $2,200 though millions of families at lower income levels would still not receive the full credit as one of the credit's, requirements is a minimum earned income of $2,500. In 2022 alone an estimated 18 million children under age 17 (26 of all children) were ineligible for the full child Tax credit because the family income was not high enough as reported by Columbia University's Center on Poverty and Social Policy.
🔵 To say in the least the new bill has many implications for the country and the next few months and years will definitely represent those changes and how the country shifts and adjusts to this with many having differing opinions understandably. I'll definitely keep you guys posted through it all but definitely a lot to see so much happen so quick and only time will tell and show us just how things play out simply put. The market itself is still continuing within this ascending channel, especially since we got that convergence with the 200 EMA and broke that $6,130 resistance. $6,300 is what I'm expecting resistance to hit the strongest so definitely gonna keep an eye there as traders process the news and changes.
🔵 Have to go but grateful as always for the support, definitely a long idea here but wanted to focus on some important points though the bill itself has so many changes it's hard to go over every one but you get the point. This is a big changes and we'll definitely see things shift a lot over the next few months and years and as always we'll keep posted with things. Thanks as always and all the best.
Best regards,
~ Rock'

Bullish continuation?S&P500 (US500) is falling towards the pivot which acts as a pullback support and could bounce to the 1st resistance, which aligns with the 161.8% Fibonacci extension.
Pivot: 6,127.80
1st Support: 5,785.00
1st Resistance: 6,428.64
Risk Warning:
Trading Forex and CFDs carries a high level of risk to your capital and you should only trade with money you can afford to lose. Trading Forex and CFDs may not be suitable for all investors, so please ensure that you fully understand the risks involved and seek independent advice if necessary.
Disclaimer:
The above opinions given constitute general market commentary, and do not constitute the opinion or advice of IC Markets or any form of personal or investment advice.
Any opinions, news, research, analyses, prices, other information, or links to third-party sites contained on this website are provided on an "as-is" basis, are intended only to be informative, is not an advice nor a recommendation, nor research, or a record of our trading prices, or an offer of, or solicitation for a transaction in any financial instrument and thus should not be treated as such. The information provided does not involve any specific investment objectives, financial situation and needs of any specific person who may receive it. Please be aware, that past performance is not a reliable indicator of future performance and/or results. Past Performance or Forward-looking scenarios based upon the reasonable beliefs of the third-party provider are not a guarantee of future performance. Actual results may differ materially from those anticipated in forward-looking or past performance statements. IC Markets makes no representation or warranty and assumes no liability as to the accuracy or completeness of the information provided, nor any loss arising from any investment based on a recommendation, forecast or any information supplied by any third-party.

S&P 500 Technical Analysis – Potential Correction AheadThe S&P 500 is approaching critical historical resistance levels, just as economic headwinds begin to resurface — particularly the expiration of tariff ceasefire agreements and renewed trade tensions. These overlapping factors could signal an upcoming technical correction.
🔹 From a technical standpoint:
The index is forming a classic multiple-top pattern, typically associated with weakening bullish momentum and potential trend reversals.
However, we remain cautious and will only consider a bearish scenario if the 6200 support level is broken on a daily close.
📉 Proposed Trading Plan:
• Short entry: Only if the daily close is below 6200
• Stop-loss: Daily close above the last top
• Targets in order:
• 5800
• 5500
• 5250
⚠️ Note: Despite the bearish setup, we do not recommend rushing into selling without confirmation of support break.

S&P Bullish Flag developing supported at 6180Trump Softens Tariff Stance:
Trump said the Aug. 1 tariff deadline isn’t firm, easing fears of an immediate trade war. US equity futures rose on hopes for more negotiation. Japan criticized the planned 25% tariff, calling it “truly regrettable.”
Texas Floods – Trump to Visit:
Over 100 people died in the Texas floods, including 27 children. Trump said he’ll visit the state Friday to support recovery efforts. The news may draw attention to infrastructure and emergency response spending.
Apple Loses AI Chief to Meta:
Apple’s AI lead, Ruoming Pang, is leaving for Meta’s new AI unit. This raises more questions about Apple’s AI strategy, while Meta’s aggressive hiring supports its tech edge.
US Resumes Ukraine Weapons Aid:
Biden will restart weapons shipments to Ukraine, reversing a previous pause. This could support defense stocks, though broader market impact is limited for now.
Takeaway:
Markets welcomed Trump’s trade flexibility, lifting sentiment. Watch tech and industrials as traders react to shifts in AI leadership and trade policy.
Key Support and Resistance Levels
Resistance Level 1: 6290
Resistance Level 2: 6340
Resistance Level 3: 6400
Support Level 1: 6180
Support Level 2: 6120
Support Level 3: 6065
This communication is for informational purposes only and should not be viewed as any form of recommendation as to a particular course of action or as investment advice. It is not intended as an offer or solicitation for the purchase or sale of any financial instrument or as an official confirmation of any transaction. Opinions, estimates and assumptions expressed herein are made as of the date of this communication and are subject to change without notice. This communication has been prepared based upon information, including market prices, data and other information, believed to be reliable; however, Trade Nation does not warrant its completeness or accuracy. All market prices and market data contained in or attached to this communication are indicative and subject to change without notice.

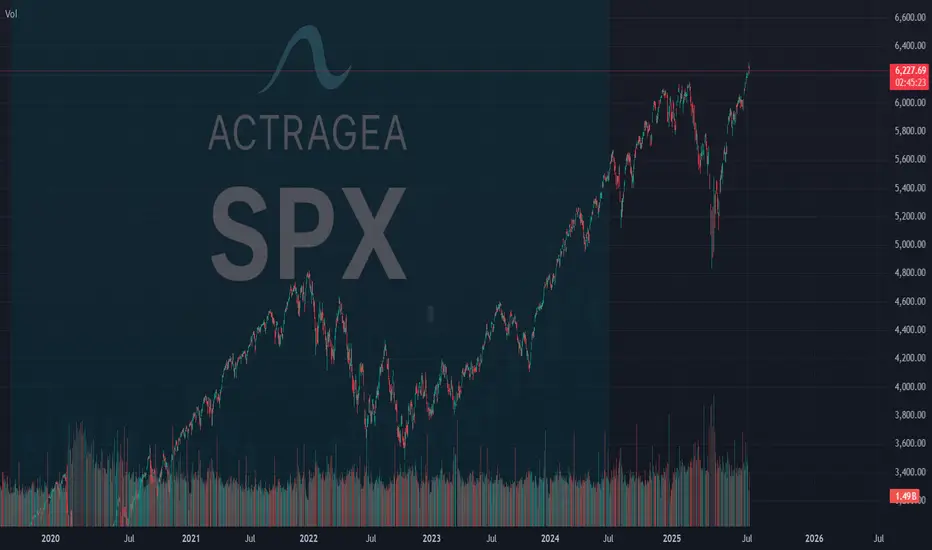
SPX: 75% chance Multi-Timeframe Reversal to 5,775-6,103 Zone **SPX MULTI-TIMEFRAME CYCLE CONFLUENCE ANALYSIS - SUPER VERSION**
**CURRENT SITUATION: July 7, 2025 - Price: 6,238**
Based on our quantitative cycle analysis across 4 timeframes, applying **ACTRAGEA hierarchical dominance principles** where ITM >> MTY >> TCY >> TYL.
---
## **CYCLE HIERARCHY STATUS**
| **Timeframe** | **Cycle Phase** | **Status** | **Hierarchy** | **Key Level** |
|---------------|-----------------|------------|---------------|---------------|
| **ITM (1D)** | Phase 2 | FLAT | **DOMINANT** | Max: 6,284.65 **awaiting confirmation** |
| **TCY (1H)** | Phase 2 | FLAT | Secondary | Max: 6,284.65 **awaiting confirmation** |
| **MTY (270m)** | Phase 1 | LONG (+1.64%) | Subordinate | Seeking max: 6,359 |
| **TYL (15m)** | Phase 2 | LONG (+0.11%) | Subordinate | Max: 6,242.7 **awaiting confirmation** |
---
## **PRIMARY SCENARIO (Probability: 75%)**
**DIRECTIONAL BIAS:** **Multi-timeframe reversal upon ITM maximum confirmation**
**RATIONALE:**
- **ITM timing**: 0 bars remaining from 50° percentile window → Maximum at 6,284.65 **awaiting confirmation** → Statistical pressure for confirmation increases daily
- **Hierarchical cascade**: **When ITM confirms maximum** → all subordinate cycles transition into Phase 3 (minimum search)
- **Current LONG positions** (MTY +1.64%, TYL +0.11%) face hierarchical override risk upon ITM maximum confirmation. Subordinate cycles will align regardless of current profitability.
**STATISTICAL PRICE LEVELS (50° Percentile):**
- **ITM**: 5,775.84
- **TCY**: 6,103.58
- **MTY**: 5,996.35
- **TYL**: 6,170.98
**STATISTICAL TIME WINDOWS (50° Percentile):**
- **ITM**: 65 bars | **TCY**: 58 bars | **MTY**: 62 bars | **TYL**: 81 bars
**EXTREME SCENARIOS (20° Percentile):**
- **ITM**: 5,420.71 | **TCY**: 5,934.73 | **MTY**: 5,728.16 | **TYL**: 6,084.71
---
## **⚠️ ALTERNATIVE SCENARIO (Probability: 25%)**
**DIRECTIONAL BIAS:** ITM extension toward 80° percentile before maximum confirmation
**CONDITION:** ITM exceeds statistical time boundaries, allowing subordinate cycles temporary independence
---
## **CRITICAL DECISION POINT**
**Confirmation Trigger:** ITM maximum validation at 6,284.65 → Phase 2→3 transition → Activation timeframe: Within 1-3 trading sessions (statistical pressure)
**Hierarchy Activation:** Immediate subordinate cycle alignment into Phase 3 upon ITM confirmation
**Invalidation:** Sustained break above 6,285 (negates ITM maximum thesis)
---
## ** PROBABILITY FOUNDATION**
**75% probability derived from:**
- ITM expired timing creating high statistical pressure for confirmation
- Historical dominance patterns (85%+ subordination rate upon ITM phase changes)
- Dual Phase 2 alignment (ITM + TCY at identical maximum level awaiting confirmation)
---
## **ACTRAGEA METHODOLOGY FOUNDATION**
Our **quantitative cycle framework** operates on **hierarchical dominance principles** where longer timeframes command shorter ones. Statistical levels represent **50° percentile probabilities**, not certainties. The **ITM critical juncture** at 6,284.65 creates high-probability setup for **coordinated multi-timeframe reversal initiation**.
**Performance Context:** Systems demonstrating 65.71% to 82.86% statistical reliability across timeframes.
---
*Analysis based on ACTRAGEA hierarchical cycle principles and statistical percentile distributions. All levels represent probabilities, not guaranteed outcomes.*