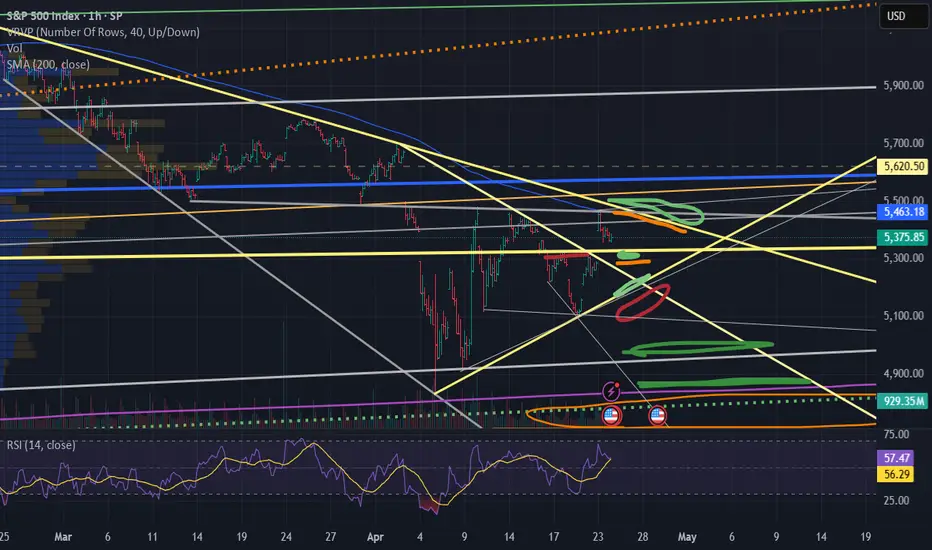
SP500 remains very bearish overall📈 In my previous post, I highlighted the confluence support zone and the potential for a bounce — and we got it. SP500 rallied around +10% off the lows.
But let’s not get too comfortable...
❓ I s the worst behind or is this just a trap before the next leg down?
From my perspective, the correction is not over.
The current bounce looks more like a bear market rally than a true reversal.
📉 Why I expect another drop:
1. Technically, as long as SP500 is trading below 5500-5600 zone, the structure remains bearish
2. Fundamentally, the backdrop hasn’t improved — if anything, it’s getting worse
3. Price is approaching a major resistance zone, which I plan to sell into
📌 My Plan:
I’m watching this zone for signs of weakness.
If momentum fades, I’ll look to short, targeting at least 5k, potentially even a new local low.
Disclosure: I am part of Trade Nation's Influencer program and receive a monthly fee for using their TradingView charts in my analyses and educational articles.
SPX500 trade ideas

US500 Day Trade Setup: Liquidity Pools, Gaps & What’s Next?The US500 (S&P 500) 4-hour chart recently showed a gap up, followed by a strong move into the previous range highs. This price action likely triggered buy stops and tapped into buy-side liquidity above the prior swing highs. After this liquidity sweep, the market has pulled back and is now consolidating just above a visible gap, which sits slightly below the current price level.
From a Wyckoff perspective, this resembles an upthrust after distribution, where price runs stops above resistance before reversing. The current pullback suggests a potential test of the gap area, which often acts as a magnet for price, especially if there’s unmitigated liquidity left behind.
Using ICT (Inner Circle Trader) concepts, the recent move above the range high can be seen as a raid on buy-side liquidity, followed by a retracement. The gap below current price represents an imbalance, and ICT traders often look for price to revisit such inefficiencies before resuming the trend.
🌐 Fundamental & Sentiment Backdrop
Recent data shows the S&P 500 has experienced a sharp correction in April, with a monthly drop of about 5.75% from the previous month, but it remains up 6.8% year-over-year (YCharts). The market has been volatile, with sentiment shifting due to macroeconomic concerns, including renewed trade tensions (notably new tariffs), a mixed earnings season, and questions about the Federal Reserve’s next moves (IG).
Wall Street analysts have recently revised their year-end targets lower, citing increased risks from tariffs and slowing earnings growth (Yahoo Finance). The VIX is elevated (28.45), and the put/call ratio is above 1, indicating heightened hedging and caution among market participants (YCharts).
🏦 Wyckoff & ICT Concepts in Play
🏗️ Wyckoff: The recent rally into the highs and subsequent pullback fits the upthrust after distribution narrative. If the market fails to reclaim the highs, a move back into the gap (potentially as a sign of weakness) is likely.
💧 ICT: The gap below current price is a clear area of interest. If price trades down to fill this gap, watch for a reaction—either a bounce (if demand steps in) or a continuation lower if the gap fails to hold.
💡 Day Trade Idea (Not Intra-day)
Scenario: If price trades down to fill the gap just below the current level (around 5,300–5,320), monitor for a bullish reaction (such as a strong daily close, a bullish order block, or a clear rejection wick).
Trade Plan:
🕵️♂️ Wait for price to fill the gap and show a bullish daily signal.
🎯 Enter a day trade long at the next day’s open if confirmation is present (e.g., a bullish daily candle close or a break above the previous day’s high).
🛑 Place a stop loss just below the gap or the most recent swing low.
📈 Target the previous high near 5,400 for a day trade, or consider scaling out if momentum continues.
Alternative: If price fails to hold the gap and closes below it on the daily chart, consider a day trade short the following day, targeting the next liquidity pool below (e.g., 5,200).
⚠️ Disclaimer
This analysis is for educational purposes only and does not constitute financial advice. Trading involves risk, and you should do your own research or consult with a professional before making any trading decisions. Past performance is not indicative of future results.

Updated levels for SP500 buy/hold/sell zonesDrawn-in areas represent red/ylw/grn sell/hold/buy zones
Crash? Here's the case for a crash.
You may have noted I can, on occasion, be a bit of a bearish guy - but I don't actually use the word "Crash" all that much. Not all bear setups are crash setups. Even when they will be, a less dramatic bear move usually happens before a crash. The times when there's actual crash risk are low - but we have a confluence of them now.
Let's run through some crash signals.
1 - Pending 1.61 break. In any self respecting crash (anyone you know by a number for sure) the crash clearly picks up on a 1.61 break. If we drop again, we threatening that break.
www.tradingview.coem
Examples:
All the good ones, and other ones. Go look. You'll find over and over a downtrend transitions to a crash under the 1.61. The 1.61 either does not break- or we crash.
We currently have a bounce off the 1.27, retest of the previous structure and possible new sell off coming - these are things that can precede a 1.61 break.
Looking at local structure, this looks like a butterfly correction. Which is often found at or before the MIDDLE of a trend (crash).
Or an ABC.
Which would predict a drop stronger and bigger than the first (crash).
Then you have things like the 200 SMA bounce, those can get sketchy if there's a new low.
...Crash.
And we have the reason. Because although the technical norms I've explained here have been features in every notable crash ever, there was always a reason. Always something that would not be foreseeable with TA and would make the crash appear to be unpredictable.
The things that just seem too weird to be true unless take time to look into them.
Like Covid being a perfect 1.61 top.
Which started similarly to what we have here.
The Covid crash would start once the 1.27 broke- which is where we are now.
Conditions for a crash now are actually realistic. Generally speaking a crash is something that it's only valid to speak of potentially in the future in the event of multiple markers hitting. Lots of things have to happen before we have real honest and true crash conditions.
Unusual things. Like trending down consistently for a couple months.
Having insanely aggressive bounces off support but not really getting anywhere.
Containing a correction inside a 2 leg structure.
...Breaking a 1.61.
See where I'm going with this?
It might happen. If the low is not made, we enter into real crash territory on the next break.

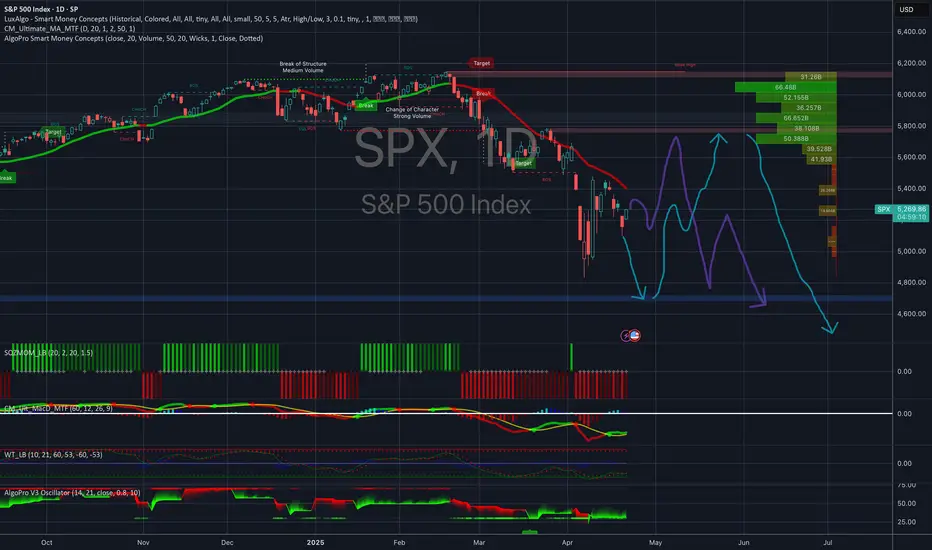
5800 Would le Optimal for a Bear SetupThe market is fast and ATR is high so I make sure I have plans to both sides so as not to be caught out, but realistically I've done hardly any trading since the day we dropped 6% and the rallied to retest the high. That was the last day I took big positions (longs which hit trailing stops for 300 points) and since then I've been mainly watching.
Spectating rather than speculating. There are times to make money and times to lose it, it's good to know the difference between them.
In a simple bear trend, we could see a high here somewhere in the 5200 - 5300 range - but to best suit the things I expect to see in a good bull trap before a real drop, I'd like to 5800.
SPX at 5800 would convince me to start trying to trade big positions short again.

3:30 pm updateMarket is still biased to the upside, but the fact that the rejected again at around 5500 is bearish for the time being. A gap fill tomorrow seems likely, we'll see how the overnight goes.


Potential bearish drop?S&P500 (US500) has reacted off the pivot and could drop to the 1st support.
Pivot: 5,480.90
1st Support: 5,099.50
1st Resistance: 5,778.60
Risk Warning:
Trading Forex and CFDs carries a high level of risk to your capital and you should only trade with money you can afford to lose. Trading Forex and CFDs may not be suitable for all investors, so please ensure that you fully understand the risks involved and seek independent advice if necessary.
Disclaimer:
The above opinions given constitute general market commentary, and do not constitute the opinion or advice of IC Markets or any form of personal or investment advice.
Any opinions, news, research, analyses, prices, other information, or links to third-party sites contained on this website are provided on an "as-is" basis, are intended only to be informative, is not an advice nor a recommendation, nor research, or a record of our trading prices, or an offer of, or solicitation for a transaction in any financial instrument and thus should not be treated as such. The information provided does not involve any specific investment objectives, financial situation and needs of any specific person who may receive it. Please be aware, that past performance is not a reliable indicator of future performance and/or results. Past Performance or Forward-looking scenarios based upon the reasonable beliefs of the third-party provider are not a guarantee of future performance. Actual results may differ materially from those anticipated in forward-looking or past performance statements. IC Markets makes no representation or warranty and assumes no liability as to the accuracy or completeness of the information provided, nor any loss arising from any investment based on a recommendation, forecast or any information supplied by any third-party.

S&P500 Index Intraday Trend Analysis for April 23, 2025Market Timing tool signals Bearish Trend for the day and the Sell Signal got confirmed with Stop Loss @ 5471. Trailing Stop Loss for running sell is at 5394. First Target for the bearish trend is at 5318 and if the market moves down further, it may take support at 5173.
It's my view. Traders are suggested to follow technical analysis for trade entries with proper risk management rules.

S&P 500 | SPX500USD: Bulls Find Support — But Is It Enough?SPX500USD 12H TECHNICAL ANALYSIS 🔍
OVERALL TREND
📈 UPTREND (Tentative) — Market structure appears to be attempting a reversal from a recent pivot low. However, the macro trend remains under pressure unless price clears the key resistance range above 5,950.
📉RESISTANCE
🔴 6,152.5000 — PIVOT HIGH | Dynamic Resistance Level
🔴 6,086.2943 — SELL ORDER II
🔴 5,952.1652 — SELL ORDER I
📊ENTRIES & TARGETS
🎯 5,884.4400 — EXIT BUY | TP 4
🎯 5,640.5683 — BUY ORDER | TP 3
🎯 5,482.3500 — BUY ORDER | TP 2 | Mid-Pivot
🎯 5,254.5432 — BUY ORDER | TP 1
📈SUPPORT
🟢 5,021.6218 — BUY ORDER
🟢 4,879.2150 — BUY ORDER II
🟢 4,812.2000 — PIVOT LOW | Dynamic Support Level
📊OSCILLATOR SUMMARY
🧭 RSI (14): 51.98 — Neutral
📉 MACD Level: -41.34 — Buy Bias Forming
🚀 Momentum (10): -36.21 — Positive Divergence Developing
📊 ADX (14): 21.08 — Early Trend Formation
📉 Awesome Oscillator: -87.21 — Bearish but Flattening
🧮MOVING AVERAGE SUMMARY
✅ 10/20/30 EMA & SMA — All Showing Buy Signals
❌ 50/100/200 EMA & SMA — Still Bearish, Suggesting Long-Term Pressure
📊 VWMA (20): 5,289.90 — Bullish Price Reaction Above VWMA
📏 Ichimoku Base Line: 5,158.19 — Neutral, Needs Further Validation
🤓STRUCTURAL NOTES
Current price is battling between 5,300–5,400 resistance range — a break and close above 5,482 could trigger further upside
Significant bullish reversal candle formed near the last pivot low at 4,812
Volume profile suggests re-accumulation; price attempting to reclaim 5,300 structure
Momentum indicators show signs of shifting bullish, but not yet in strong confirmation territory
TRADE OUTLOOK 🔎
📈 Bullish bias above 5,254 with targets at 5,482 / 5,640 / 5,884
📉 Bearish pressure reactivates if price rejects 5,482 and closes below 5,021
👀 Monitor ADX for trend confirmation — under 25 = caution; above 25 = trend validation
🧪STRATEGY RECOMMENDATION
CONSERVATIVE APPROACH (Reversal Play):
— Entry: 5,254.54
— Targets: 5,482.35 / 5,640.56 / 5,884.44
— SL: Below 5,021.62
HIGH-RISK SCALP (Resistance Fade):
— Sell Order near 5,952.16 or 6,086.29
— Targets: 5,640 / 5,482
— SL: Above 6,152.50
“Discipline | Consistency | PAY-tience™”

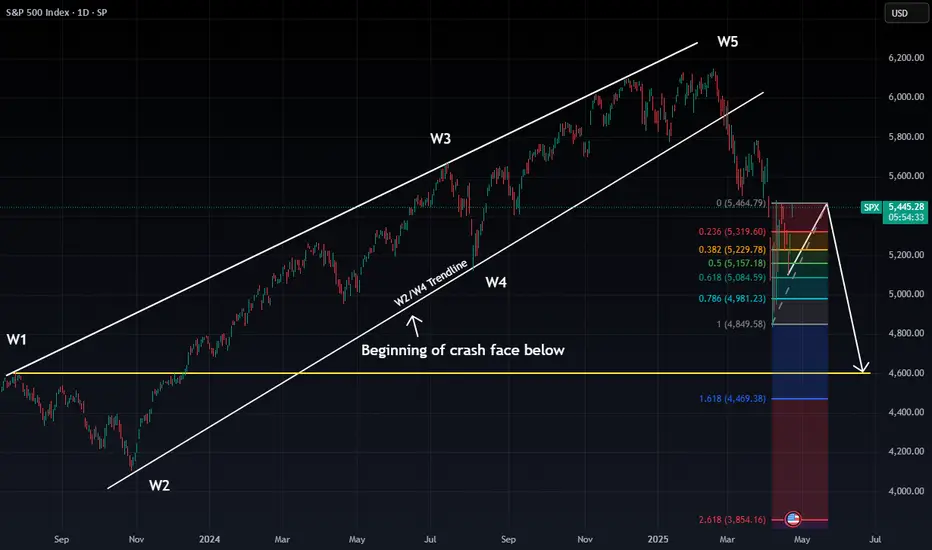
PIVOTAL DAY AHEAD FOR $SPX: Will We Reclaim the Highs or Begin tTechnical Breakdown: We’re at a critical junction for the S&P 500. After completing a 5-wave structure, SP:SPX is teetering near a decision point. Two potential paths are now unfolding:
Bullish Scenario (🟢):
A daily close above 5386 would invalidate the current bear thesis.
This opens the door to a push toward the 90–100% Fib retracement zone (5685–5750).
Short-term traders may look to ride the momentum if 5485 is broken cleanly.
Bearish Scenario (🔴):
A rejection at current levels, coupled with a close below 5386 and a gap-fill back down, confirms the bearish triangle setup.
If this plays out, we’re targeting a drop to the 4600–4400 range based on the 1.618 and 2.618 Fibonacci extensions and broken trendline dynamics.
This aligns with the Elliott Wave breakdown (W5 peak, now in corrective ABC structure).
🧩 Macro Context:
High inflows to safe havens like gold suggest rising fear.
Volatility is elevated, and liquidity is thinning post-earnings season.
💥 Conclusion: Tomorrow’s close is not just another candle – it’s a potential macro trigger. Either we confirm a final leg higher in this cycle, or the bearish wave unfolds in full.
⏳ Watch 5386 closely.
Bias is now bullishThe Bias is up but I also discuss the alternative bearish count. Vix is at support here, but it's bias is currently down.

Tariff Talks Flip the Tape - 5400 Under FireWolfe Gasping, Bulls Grinning
Well, this is exactly what every bear didn’t want to wake up to…
Overnight, markets surged higher after Trump hinted at easing tariffs and gave Powell a thumbs-up. It’s like watching your opponent trip mid-game, then suddenly recover, score a hat trick, and throw you a smug grin.
That line in the sand we’ve been talking about?
5400.
It’s been the invalidation level for weeks – and now it’s being bulldozed like it never mattered.
This isn’t about guessing the news.
It’s about having a clear point where your bias says, “Okay, I’m out.”
The Wolfe was working… until it wasn’t.
And that’s okay.
Because while the bear swing has been fantastic, we’re now seeing what might be the higher low reversal we flagged a few weeks ago - just without the drop to 5000 first.
Frustrating? A little.
Unexpected? Not really.
Tradable? Absolutely.
Let’s look at how this flips our setup for today.
---
SPX Market View - Bull Bias Activated (Finally)
Well, that escalated quickly.
With the overnight futures surge and 5400 now breached, the Wolfe Wave is officially off the board. Our long-standing bear bias has been invalidated — and we flip bullish for the first time in weeks.
This is the power of having a system.
You don’t need to guess. You just need a line in the sand. Ours was 5400. Price crossed it. The bias flips.
Here’s what I’m watching now:
5400 is now the breakout zone – if it holds at the cash open, bulls have full control
Higher low structure playing out across the daily chart
GEX positioning will be key — I’ll be watching for hedging demand shifts to confirm upside stability
This doesn’t mean we go all-in bull mode with blind optimism.
It means we assess new setups in line with the price action, and if they confirm – we act.
Bull’s got the ball (for now).
Let’s see if he fumbles or scores.
GEX Analysis Update
5300 acting as the updated flip point overnight
SPX prices potentially gaping 100+ points assuming the futures hold their gains.
---
Expert Insights: Know Your Invalidation
❌ Clinging to a bias too long
It’s tempting to hold on to the story. “Wolfe’s still in play,” you tell yourself… even after price says otherwise.
✅ Know your invalidation level
5400 was the line. It’s been clear for weeks. Once price punched through it — the plan said, “That’s it. Game over for the bear.”
No ego. No hoping. No rewriting the script mid-trade.
Your system needs boundaries.
Otherwise, it’s not a system — it’s a story.
---
Rumour Has It…
Trump’s tweet this morning: “Tariffs are dumb. Powell’s alright. Markets UP!” Dow gained 200 in 10 seconds.
CNBC now referring to 5400 as “The Enlightenment Zone.”
The Wolfe Wave was last seen howling into the wind and fading into the distance.
(This section is entirely made-up satire. Probably.)
---
Fun Fact - The 5400 Flip
Here’s a kicker for you…
5400 has flipped bias more times than any other round number level in the SPX this year.
It's the psychological equivalent of a market mood swing.
And every time price hits it, traders start reaching for different narratives:
“It’s resistance.”
“Now it’s support.”
“No wait, it’s just a number.”
“Actually, it’s Fibonacci-magnet-retrograde!”
Sometimes it’s just this:
5400 = The Line Where We Flip.
Meme of the Day - “Wolfe’s Out. Bull’s In.”
IMAGES ON MAIN BLOG
Happy trading,
Phil
Less Brain, More Gain
…and may your trades be smoother than a cashmere codpiece

S&P500 Long and painful but necessary bottom formation.The S&P500 index (SPX) has been trading within a 2-year Bullish Megaphone pattern and the recent 2-month correction completed its latest Bearish Leg, as it reached the Higher Lows trend-line.
The massive rebound that took place there on April 07 may have turned out to be a highly volatile one but as mentioned on the title, it might be long and painful, but a necessary process nonetheless. That's mainly because it is the strongest correction since 2022 and the longest Bearish Leg of the pattern.
The market remains highly volatile until it gets a clear signal, bearish below the current Support of the 1W MA200 (red trend-line) or bullish above the 1D MA50 (blue trend-line). Despite the rather short-term uncertainty, the similarities with the Megaphone's previous bottom are uncanny, both having formed their Low on 1D RSI Double Bottom patterns.
Given that this previous Low initiated a massive +50% 1 year Bullish Leg/ rally, we expect to see at least 7100 on this next one by mid-2026.
-------------------------------------------------------------------------------
** Please LIKE 👍, FOLLOW ✅, SHARE 🙌 and COMMENT ✍ if you enjoy this idea! Also share your ideas and charts in the comments section below! This is best way to keep it relevant, support us, keep the content here free and allow the idea to reach as many people as possible. **
-------------------------------------------------------------------------------
Disclosure: I am part of Trade Nation's Influencer program and receive a monthly fee for using their TradingView charts in my analysis.
💸💸💸💸💸💸
👇 👇 👇 👇 👇 👇

S&P500 Long then Short: Last Wave 5 of 5In this video, I updated the wave counts for S&P500 and expects a last wave 5 of 5 (thus the long). I uses 2 Fibonacci extensions to project the final target and chose the lower of the target as the TP.
Once the target is reached, then we look for a reversal signal before entering short. The target of the short will be the end of sub-wave 4 as illustrated.
Good luck!

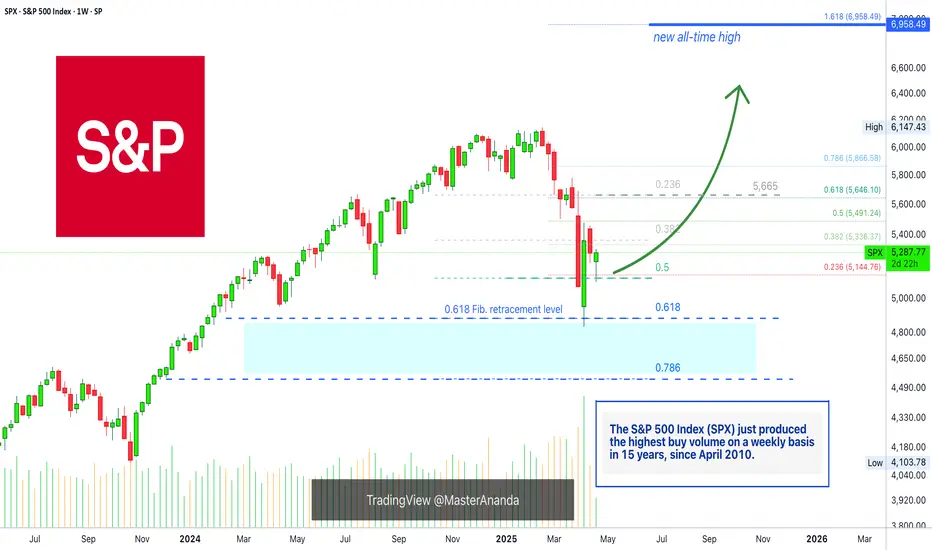
The SPX On Track To A New All-Time High In 2025 (6,958— Soon!)Do not let anybody distract you, do not allow yourself to be deceived. Know that the market is very resilient and this has been true for the longest time ever. The catastrophe that everybody is always expecting and is always due is never true. Ok, there was a correction, but that's it, from now on the market grows. That's just how it works.
Very, very strong bull markets, and the bear markets weak and short.
The S&P 500 Index (SPX) looks great right now and nothing can surpass the wisdom that comes from a chart. A chart cannot lie nor can mislead you in any way.
The charts have pure raw data, you can make your own interpretation of this data but there are no mistakes.
Here the chart shows a very strong higher low. The 0.5 Fib. retracement level was tested and it holds. Now, saying a "new All-Time High" might be speculation, but saying that prices will rise is simply how technical analysis works.
A low first pierced 0.5 and challenged 0.618 fib. The candle closed above and full green, the highest volume since 2010 and that is a clear signal that the correction reached its end.
The SPX is bullish now of course.
The next week we get a red week and this led to the present day, a higher low. A higher low is bullish and notice, the 0.618 level is no longer relevant. The correction that happened was really strong, there is absolutely no need for more.
So a strong correction developed and what comes next?
Prepare for a major rise, a new impulsive bullish wave.
The minimum target starts at 5,665. This is the resistance where the drop got started, this level needs to be tested based on TA. Depending on how this level is handled, we can extract how the market will continue to behave.
» I will make a prediction, the SPX will hit a new All-Time High in the coming months.
Thank you for reading.
Namaste.

Approaching the 200-Week SMA – AgainHistory doesn’t repeat… but it sure does rhyme.
If all you did was buy the S&P 500 every time it touched the 200-week moving average, you would’ve: ✔️ Bought 2011, 2016, 2018, 2020, 2022… 💰 Absolutely cleaned house.
Now in 2025, we’re approaching the same level again. That SMA has acted like a trampoline for the last 15 years — will it bounce once more?
🧠 Food for thought as fear builds and the market cools.
Let’s see if the buyers step in where they always have. 👀

S&P500 Index Intraday Trend Analysis for April 22, 2025Intraday Trend is Bullish with Resistance1 @ 5410 and Resistance2 @ 5507. Market Timing tool is bullish for the day and other indicators are in the green. Overall the S&P500 Index intraday trend is Bullish.
This is my view but not a recommendation to buy or sell. Traders are advised to do their own technical study before entering into the trade with proper risk management.

SP500 US500 update 21.04.2025 My vision until the end of AprilIf someone thinks that the bear market in the US indices has arrived, I want to show you a monthly chart that shows that the trend is still long. We got a reaction of the 0.5 Fibonacci zone. But we entered the monthly accumulation with a gradual test of the Last Structure FVG.
At this timeframe, the price has already broken the ascending structure, which means that in order to regain its ascending status, the structure needs to invert the weekly FVG, in other words, to consolidate above the 5554 level.
So far, there are no long positions, but if we look at the monthly FVG target test, we can try to find short positions when the price reaches 5554 and does not consolidate above this level
1. Trump’s Economic Vision in 2025
Introduced a 10% baseline global tariff starting April 5, 2025.
Over 25% tariffs were imposed on key trade partners like China and Mexico.
Objectives: reduce the $887B trade deficit, combat currency manipulation, and strengthen domestic industry.
Domestically, Trump extended the Tax Cuts & Jobs Act (risking a EUROTLX:4T budget deficit over 10 years) and prioritized deregulation, particularly in fossil fuels.
2. Trump’s Relationship with the Federal Reserve
Resurfaces criticism of Fed Chair Jerome Powell, calling for interest rate cuts.
Pushed a Supreme Court case challenging the Fed’s independence, aiming to give the President authority to remove the Fed Chair.
Analysts warn this threatens central bank credibility, potentially raising long-term inflation expectations.
3. Impact of Tariffs on Economic Stability
Long-term GDP projected to fall by 6%; wages by 5% (Wharton Model).
Households face up to $5,200 in additional annual costs due to price increases.
Investment and exports decline; EU exports could drop 8% to 66%.
While benefiting sectors like steel, tariffs risk broader job losses in supply-chain industries.
4. Federal Reserve’s Challenges
The Fed navigates inflationary pressure while maintaining economic stability.
Only one rate cut expected in 2025 despite political pressure.
Tariffs complicate monetary policy by fueling external inflation and supply disruptions.
5. S&P 500 and Market Outlook
S&P 500 dropped 7% after new tariffs were announced (stagflation fears).
Despite past growth during Trump’s first term (+68%), current policies increase volatility.
Risks include reduced capital inflow, weakened Fed independence, and ongoing global retaliation.
✅ Conclusion
Donald Trump’s 2025 economic strategy hinges on aggressive tariffs and pressure on the Federal Reserve to lower rates. While intended to stimulate domestic growth, these moves contribute to inflation, challenge institutional independence, and heighten market volatility. For investors and policymakers, the path forward demands careful navigation of an economic environment shaped by protectionism, policy conflict, and fragile monetary stability.
So far, everything does not look good. I am waiting for the approval of the BTC reserve for May (next month). This could positively affect the American economy in the SHORT TERM.
Best regards, EXCAVO
_____________________
Disclosure: I am part of Trade Nation's Influencer program and receive a monthly fee for using their TradingView charts in my analysis.

[D] SPX - 22.4.2025 (Scenario 1 & 2)To complement the earlier publish idea, I'm hereby adding another scenario as I'd feel dissatisfied with several candles being displaced. Both tell the same story as I'm fundamentally remain bearish over a prolonged period of time. I expect the things to get moving as soon as mid May for a major move. This year's summer time might hit different.

Arshitecture / 15 Min Long Position SP500Based on the 86.4% reliability of flag patterns and considering all of them within the context of intraday trading, this zone appears to be a favorable area for entering a long position.
