US500.4h chart pattern.US500 (S&P 500), here's a breakdown of the potential bearish targets you're pointing to:
---
📉 Market Overview:
Price has broken below the trendline and is currently hovering near the Ichimoku cloud support.
The bearish path is outlined on the chart with multiple target zones indicated by horizontal lines and a large blue arrow.
---
🎯 Bearish Targets (as shown on your chart):
1. First Target Zone: Around 5,920 – 5,930
Minor support area just below current range.
2. Second Target Zone: Around 5,860 – 5,870
A more solid prior demand zone.
3. Final Target Zone: Around 5,780 – 5,790
Major support zone, aligns with previous consolidation area.
---
🧭 Strategy Notes:
If price closes below 5,950 on the 4H or daily candle, it may confirm a stronger bearish continuation.
Keep an eye on volume and price reaction near 5,920, as this is likely the first bounce zone.
Would you like a marked-up version of this chart with exact price levels and arrows for clarity?
SPXM trade ideas

S&P 500 Index.4H CHART PATTERN.the S&P 500 Index (4H timeframe), it appears you're using a combination of Ichimoku Cloud, trend channels, and support/resistance zones to project downside targets. Here's the breakdown of your marked targets:
📉 Bearish Targets:
1. Target 1: Around 5,500
2. Target 2: Around 5,200
3. Target 3: Around 4,950–4,900
---
🔍 Technical Observations:
Price has broken below the upward trend channel.
It's entering the Ichimoku Cloud, signaling potential consolidation or bearish pressure.
The large blue downward arrow indicates a bearish expectation, possibly tied to macro/fundamental concerns or technical reversal patterns.
The grey resistance block near 5,960–6,000 suggests failed breakout/retest.
---
📌 Summary:
If current bearish momentum continues:
✅ Immediate Target: 5,500 (first major support)
⚠ Medium Target: 5,200
🔻 Final Target Zone: 4,900–4,950 (strong previous support and fib zone)
Let me know if you want stop-loss ideas, confluence indicators, or entry strategy breakdowns!

The Midyear Mindset Reset: Reboot Your Trading Before Q3Because nothing says "trader growth" like admitting you’ve been winging it for six months.
👋 Welcome to Halftime — How’s Your P&L Looking?
June’s closing bell isn’t just a date on the calendar — it’s that awkward moment where traders stare into the middle distance, coffee in hand, and quietly whisper: “Well… that went differently than I expected.”
Whether you’ve been racking up wins, nursing drawdowns, or simply surviving market whiplash, midyear is nature’s way of handing you a clean slate. Before Q3 throws its inevitable curveballs, now’s your chance to pause, reset, and actually look at what the heck you’ve been doing. And, of course, prepare for the next batch of earnings reports .
Spoiler: if your trading strategy this year has involved equal parts hope and caffeine, you’re not alone.
🔥 The Year So Far: Markets Kept It… Interesting
Let’s quickly recap 2025 so far (because trauma processing is healthy).
The Magnificent Seven? More like the Magnificent Two-And-A-Half. Meta NASDAQ:META and Microsoft NASDAQ:MSFT ran victory laps while everyone else tripped over AI headlines or regulatory landmines.
Nvidia NASDAQ:NVDA moonwalked into trillion-dollar territory, then stumbled after export bans — but somehow still has every fund manager whispering “Blackwell” like it’s a secret password.
Bitcoin BITSTAMP:BTCUSD set new highs north of $110K (who needs fiat when you can have memes?).
The Fed teased cuts, inflation teased persistence, and Trump teased… well, everyone.
And summer trading arrived with its usual low-volume traps, giving us breakouts that break hearts and liquidity that disappears faster than your broker’s customer support.
In short: volatility? Check. Opportunity? Absolutely. Discipline? That depends on whether you’re still following your rules or trading on vibes.
By June, most traders have crafted elaborate narratives in their heads. You know the type: "This breakout is different," "The Fed has to cut next month," and "There’s no way Nvidia can keep running like this."
The problem is, markets don’t care about your narrative. They care about price, volume, sentiment — and sometimes, absolute chaos. That beautifully clean chart setup? It’s not asking for your prediction. It’s begging you to respond with discipline, not bravado.
The traders who thrived in the first half didn’t win by forecasting every twist in the macro plotline. They won by following the tape. The breakout happened? They took it. The stop-loss hit? They respected it. That’s not luck — that’s execution.
🫶🏻 Emotional Capital: The Real Balance You Should Be Watching
P&L tells one story. Emotional capital tells another.
By June, a lot of traders aren’t out of money — they’re out of discipline. They’ve been revenge trading after a string of losses, chasing AI headlines that already ran, and convincing themselves they can “make it all back” on the next oversized position.
Do you know that feeling?
Resetting your trading mindset at midyear means recalibrating that emotional bankroll. Start by reviewing your trading journal (yes, you’re supposed to have one ). Revisit the trades that made sense and the ones that make you cringe. Recognize your patterns — your strengths, but also your weaknesses. Success leaves clues and there are lessons in failures.
💭 Clean Up the Clutter
There’s a special type of fatigue that sets in after six months of consuming too much trading content. You start layering on indicators like toppings at a frozen yogurt bar — RSI, MACD, Stochastics, VWAP, Fibonacci, Elliott Waves, Gann fans... until your charts light up like the billboards in Times Square.
The truth is, the best traders heading into Q3 are simplifying. They’re not chasing complexity; they’re chasing clarity. They know their setups, they trust their process, and they wait for clean signals.
Summer trading especially demands this discipline. Liquidity gets thinner, breakouts fail more often , and the tape gets choppy.
Complex systems may amplify the noise. Strip it down. Focus on price structure. Simplify your strategy so you can execute when real opportunities appear — not when your 12th oscillator blinks green.
⚾ You Don’t Need a Home Run
At this stage of the year, many traders fall into what we’ll call the desperate hero phase. They feel behind. They want to make up for drawdowns. They want “the trade” that fixes everything. If you’ve missed making bank over the first half of the year, chances are, you want to catch up — and fast.
Here’s a secret: The best traders aren’t always looking for grand slams. They’re playing small ball too — consistent singles, tight risk, controlled losses, steady gains.
Q3 isn’t about doubling your account. It’s about staying alive long enough for your edge to show up and play out. The traders who make it to year-end consistently profitable aren’t the ones chasing massive wins. They’re the ones compounding quiet, boring, disciplined trades.
Midyear Reset: Your Q3 Trading Checklist
Here’s your brutally simple plan for the back half:
✅ Journal your biggest mistakes from H1
✅ Cut your watchlist in half
✅ Size smaller than feels exciting
✅ Trust clean setups over crowded trades
✅ Stay curious — but stay selective
✅ Leave the FOMO trades to the TikTok influencers
So the real question heading into Q3 isn’t whether markets will go up or down. It’s whether you will trade better or keep winging it.
Happy midyear reset. Trade smarter, not harder.

Meta & Microsoft: How Two Tech Titans Outran a Sinking Mag 7Forget about the Magnificent Seven and say hello to M&M — the only two winners of the year so far.
If you blinked during the first half of 2025, you might’ve missed it: the mighty Magnificent Seven are starting to look more like a Scraggly Five. While Tesla NASDAQ:TSLA fumbled its autonomy narrative and Apple NASDAQ:AAPL spent more time designing slides for the WWDC than in keynotes, two names quietly did the thing — created shareholder value.
Meta NASDAQ:META and Microsoft NASDAQ:MSFT
Both are up more than 13% year-to-date each, sitting comfortably at the top of the gains leaderboard. For comparison: Nvidia managed just 3% (and that’s with all the AI hype), and everyone else? Down. Flat. Or just ghosted by Wall Street. The iPhone maker? How’s 20% to the downside?
Let’s break down how Meta and Microsoft dodged the selloff.
📞 Meta: Not About That Meta
Meta NASDAQ:META came into 2025 like it had something to prove. Zuck had long gone full avatar with the metaverse. But now? Now he wants to win AI — and he’s putting his money where his data is. Meta’s latest foray into AI is a $14.3 billion investment into Scale AI.
A 49% non-voting stake in the AI darling isn’t for fun — but for function. It’s a full-court press to close the Llama-size gap between Meta’s in-house models and the heavyweights like OpenAI and Anthropic.
Scale AI, already one of Meta’s biggest vendors, processes and labels the data that fuels Meta’s large language models. It was only a matter of time before Zuck decided, “Hey, let’s just own a piece of the pipeline.”
And in true tech soap opera fashion, Scale CEO Alexandr Wang last week confirmed in an internal memo he’s leaving to join Meta full-time. For those keeping score: Wang, born in 1997, became the youngest billionaire in 2021. Now, he’s headed into the belly of the Menlo Park beast.
Wall Street seems to dig that. The stock shot up when the news leaked , as investors rewarded Meta for looking less like a social media giant and more like a serious AI player — even if it still serves your aunt’s minion memes.
👾 Microsoft: The OS of Enterprise Still Runs Smooth
Meanwhile in Redmond, Satya Nadella was out here quietly running the table.
Microsoft NASDAQ:MSFT hit an all-time high of $480 on June 12, pushing its market cap to a record-breaking $3.5 trillion. For about a day or two before that, Nvidia NASDAQ:NVDA was on top — and then Microsoft did what Microsoft always does: calmly pressed Ctrl+Alt+Delete on its competition and reclaimed its spot as Earth’s most valuable company .
How did that happen? Certainly not overnight.
Azure continues to gobble cloud market share, Microsoft 365 is still the gold standard for digital productivity, and Teams — love it or hate it — is now basically corporate law.
But don’t sleep on its AI game. Microsoft isn’t just throwing money at OpenAI, it’s embedding AI into everything it touches. Outlook, Excel, Word — all getting their Copilot upgrades. Want to finish that quarterly report faster? Let AI do it. Want it rewritten in pirate-speak? AI’s got you.
Microsoft isn’t just building tools. It’s establishing an infrastructure for the new AI economy. And traders see that. They understand that while Nvidia sells the shovels, Microsoft owns the mine.
👩🏻💻 Why the Rest of the Mag 7 Didn’t Make the Cut
Quick vibe check:
Apple NASDAQ:AAPL Still chasing the AI breakthrough. No one talks about the Vision Pro headset anymore, and the annual WWDC event wasn’t anything special. The stock is down 20% on the year.
Tesla NASDAQ:TSLA Robotaxis are coming ( maybe even this week ). But earnings pressure and margin squeeze made investors wish for more than tweets and timelines. The shares are underwater by 14% YTD.
Amazon NASDAQ:AMZN E-commerce growth hit cruise control, and its AI presence still feels more like an R&D lab than a monetized machine. The stock is staring at a 3.7% loss, largely thanks to Amazon getting slapped in the face from Trump’s tariffs .
Alphabet NASDAQ:GOOGL Search is still dominant, but Gemini’s bumpy launch and questionable performance has traders waiting for Google to actually ship something great, and not just strip the results from the iconic blue links . The stock is down 8%.
Nvidia NASDAQ:NVDA Yes, still the king of chips. And yes, it’s still delivering. But with valuation stretched like Lululemons in a CrossFit class and export bans weighing heavy , it’s getting harder to maintain the pace.
🍻 Trading Lesson: Leadership Rotates
If you’re a trader who’s been glued to Nvidia’s every tick or still buying dips on Apple because it “has to come back,” let this be your mid-year reminder: the market doesn’t care what used to lead.
Leadership rotates. Fundamentals shift. And sometimes, the best trade is the one hiding behind less hype and more function.
Case in point: While Apple’s been trying to find a catalyst, Meta just found a whole new business partner. While Nvidia’s been spinning plates on export rules, Microsoft’s just printing money off the back of Office subscriptions and Azure servers.
👀 What Happens Next?
With the second half of the year approaching, all eyes are on:
Meta’s AI ambitions — can the Scale deal accelerate model performance fast enough to close the gap with rivals?
Microsoft’s cloud dominance — can Azure continue its double-digit growth without hitting the regulatory radar?
Earnings, earnings, earnings — it’s almost the season again! Earnings reports kick off in about a month and things will get cracking.
Whatever happens, don’t bet the farm on what used to work. Watch the rotation. Track the strategy shifts. And for the love of charts — keep one eye on the Earnings Calendar .
💬 Final Thought
If Meta and Microsoft can shine while their peers flounder, what does that say about the real winners in this new AI economy? Maybe it’s not about who builds the flashiest model — but who actually knows how to monetize it. What’s your thought?

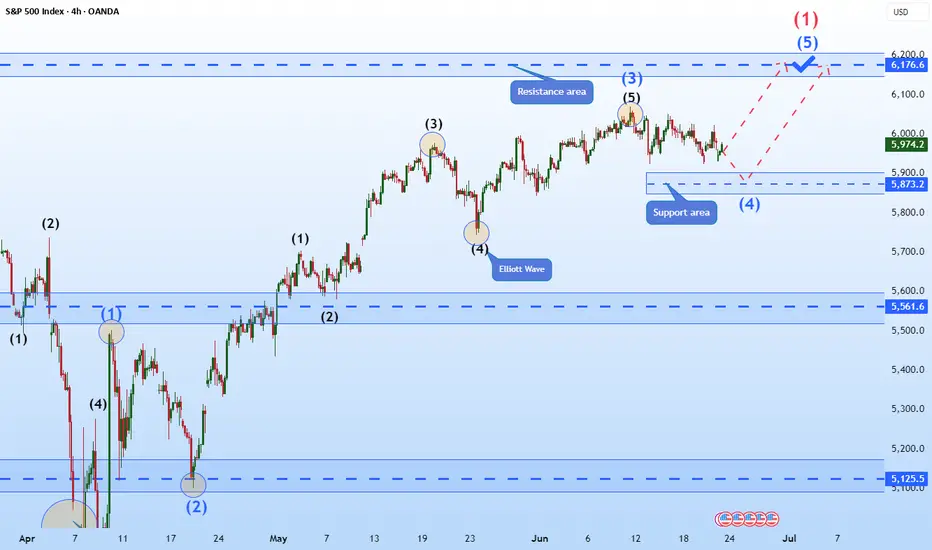
Hellena | SPX500 (4H): LONG resistance area of 6176 (Wave 1).Colleagues, the previous forecast remains essentially unchanged, and the target is still 6176, but I think the forecast can be updated because the price has been flat for quite some time.
I still expect the upward movement to continue in the large wave “1” and in the medium-order wave “5”.
A small correction to the support area of 5873 is possible.
Manage your capital correctly and competently! Only enter trades based on reliable patterns!
SPX Gap for BTC LongIf you want to long BTC, wait for SPX to fill its weekly gap :) as simple as that.


[06/16] Weekly GEX Roadmap - Diagonal Spreads or Put Hedges?📊 Weekly GEX Map (SPX)
This week’s GEX profile looks nearly identical to last week:
Positive bias above 6020 up to 6100
But a sticky chop zone remains from 5975 to 6020
Below 5950? That’s where things get interesting…
⚠️ What Happens If 5950 Fails?
In that case - welcome to negative gamma territory:
Delta becomes unstable → fast, erratic moves
Gamma loses influence → hedging effectiveness drops
Dealer hedging lags → market makers chase, not lead
Vega + theta distort readings → charm decay accelerates
Result:
GEX zones lose clarity.
Pinning breaks down.
Reactions become nonlinear and emotional.
If we drop below 5950, we might see acceleration instead of stabilization — despite the positive GEX profile.
💡 Trade Idea of the Week – With Caution
If not for Wednesday's macro risk (Fed rate decision), I'd suggest a bullish diagonal spread toward 6100–6150:
Limited downside
Defined risk
Covers the full squeeze zone
But with FOMC looming, I'd only hold this trade until Thursday and close once the debit doubles or earlier.
🧨 Macro + Geo Risks
Fed is priced for “no move” → any surprise = volatility spike
Rising tensions with Iran → oil and futures could react violently
Recommendation : Avoid OIL this week, especially futures and naked strategies
🛡️ Prefer Downside Protection?
If you expect weakness on SPX weekly:
Consider a put debit spread with the short leg at 5950, where the second strongest Put Support sits.
This type of structure can offer up to 6:1 reward-to-risk, making it one of the most efficient bearish hedges for this week.
If you enjoyed the above breakdown, feel free to check out my previous weekly analyses or explore my tools as well.
Until next time – Trade what you see, not what you hope,
– Greg @ TanukiTrade

How Financial Markets Are Reacting to Middle East EscalationHow Financial Markets Are Reacting to the Escalation in the Middle East
The exchange of strikes between Iran and Israel continues. However, judging by the behaviour of various assets, market participants do not appear to expect further escalation:
→ Oil prices are falling. Monday’s candlestick on the XBR/USD chart closed significantly below the opening level.
→ Safe-haven assets are also retreating: the Swiss franc weakened during Monday’s U.S. session, while a bearish candle formed on the daily XAU/USD chart.
Equity markets, too, have largely held their ground.
The S&P 500 index (US SPX 500 mini on FXOpen) climbed on Monday (A→B) following reports of potential talks between Iran and the U.S. However, it pulled back (B→C) after the U.S. President urged citizens to evacuate Tehran.
Technical Analysis of the S&P 500 Chart
News of Israeli strikes on targets inside Iran led to a bearish breakout from the rising channel (marked with a red arrow), though the downward move failed to gain traction.
At present, the S&P 500 chart (US SPX 500 mini on FXOpen) shows the formation of an ascending triangle — a signal of temporary balance between supply and demand.
Still, given the elevated geopolitical uncertainty, this balance remains fragile. It could be disrupted by:
→ Further developments in the Iran–Israel conflict (notably, Donald Trump left the G7 summit early due to the situation in the Middle East);
→ U.S. retail sales data , due today at 15:30 GMT+3.
It is possible that the S&P 500 may soon attempt to break out of the triangle , potentially triggering a new directional trend.
This article represents the opinion of the Companies operating under the FXOpen brand only. It is not to be construed as an offer, solicitation, or recommendation with respect to products and services provided by the Companies operating under the FXOpen brand, nor is it to be considered financial advice.

S&P500 Update: Break of Lower TrendlineIn this video, I updated the wave count for S&P500 and discussed 2 different ways of counting it but ended with a bias on a stronger wave 3 down as opposed to a wave 5 of 1 down.
The stop loss is above 6016, with 2 take profit targets:
1) 5940
2) 5923
Good luck!

Is SPX at a crucial point here.... inflection point?Until yesterday, it seemed that bulls were fully in control chugging along to make new ATH or go closer to previous ATH. Seemed like SPX was breaking from ascending triangle. Looked bulllish going into this Opex close, certainly propped by good data and good tariff comments.
Now with the recent war news, and the dip we had yesterday, seems like new pattern emerging (rising wedge) which is bearish. Also keep in mind the JPM hedge that expires end of month. The open interest shows that JPM hedge is still alive (they havent closed) and based on my calculations currently JPM has a loss of around $622M.
To stem losses market at minimum needs to be below 5900 by end of month (at 5900 JPM loses $59M but its chump change for them) and for them to be neutral or make money then SPX needs to be 5300 and below by end of month.
Currently around 5975, would mean a drop of 500-600 points in next 2 weeks... certainly can happen....
Appreciate your comments!

S&P500 Channel Up buy opportunity.The S&P500 index (SPX) has been trading within a Channel Up and is now on a count (5) pull-back, breaking below its 4H MA50 (blue trend-line). As long as the 4H MA100 (green trend-line) holds, we expect the index to resume the uptrend, similar to the previous Bullish Leg of the Channel Up.
That Leg almost reached the 1.5 Fibonacci extension and made a Higher High. Our Target is marginally below the new 1.5 Fib ext at 6130.
-------------------------------------------------------------------------------
** Please LIKE 👍, FOLLOW ✅, SHARE 🙌 and COMMENT ✍ if you enjoy this idea! Also share your ideas and charts in the comments section below! This is best way to keep it relevant, support us, keep the content here free and allow the idea to reach as many people as possible. **
-------------------------------------------------------------------------------
Disclosure: I am part of Trade Nation's Influencer program and receive a monthly fee for using their TradingView charts in my analysis.
💸💸💸💸💸💸
👇 👇 👇 👇 👇 👇

Another drop for SPX500USDHi traders,
Last week SPX500USD broke the low of the previous week just as I've said in my outlook. After that it went up again. This pair is still in a bigger correction down.
So next week it could drop again into the direction of the bullish Weekly FVG.
Let's see what the market does and react.
Trade idea: Wait for a small correction up on a lower timeframe to trade short term shorts to the previous Weekly lows.
If you want to learn more about trading FVG's & liquidity sweeps with Wave analysis, then please make sure to follow me.
This shared post is only my point of view on what could be the next move in this pair based on my technical analysis.
Don't be emotional, just trade your plan!
Eduwave

S&P 500: The Wedge, the Oil, and the Yen
The S&P 500 SP:SPX OANDA:SPX500USD CME_MINI:ES1! AMEX:SPY appears to have completed a rising ending diagonal — a classic reversal structure.
The 6050 zone stands out as strong resistance — notably, no monthly candle has ever closed above this level.
🧭 Minimum correction targets:
filling the weekly FVG
a retest of the 20-week moving average
retracement to the 0.382–0.5 Fibonacci zone from the recent leg
📌 Fundamentals support the downside:
Iran–Israel tensions are pushing oil prices higher → which fuels inflation expectations
Rising CPI in Japan may accelerate the carry trade unwind and lead to a stronger yen OANDA:USDJPY
Seasonality also leans bearish during the summer months
⚠️ Bottom line: momentum is fading. A cooling phase is likely next — time to focus on risk management.

S&P500: 1D Golden Cross incoming. 6,300 sighted.S&P500 is on an excellent bullish technical outlook on 1D (RSI = 60.006, MACD = 86.860, ADX = 23.325), extending a May 23rd rebound on its 1D MA200. Soon the market will form a 1D Golden Cross, drawing valid comparisons with the 2020 COVID recovery. That pattern, following its 1D MA200 rebound, extended the uptrend all the way to the 1.136 Fibonacci extension before pulling back to the 1D MA50 again. Buy, TP = 6,300.
## If you like our free content follow our profile to get more daily ideas. ##
## Comments and likes are greatly appreciated. ##

Position Sizing 101: How Not to Blow Up Your Account OvernightWelcome to the trading equivalent of wearing a seatbelt. Not really exciting but entirely recommended for its lifesaving properties. When the market crashes into your stop-loss at 3:47 a.m., you’ll wish you’d taken this lesson seriously.
Let’s talk position sizing — the least flashy but most essential tool in your trading kit. This is your friendly reminder that no matter how perfect your chart setup looks, if you’re risking 50% of your capital on a single trade, you’re not trading. You’re gambling. And also — if you lose 50% of your account, you have to gain 100% to get even.
✋ “Sir, This Isn’t a Casino”
Let’s start with a story.
New trader. Fresh demo account turned real. He sees a clean breakout. He YOLOs half his account into Tesla ( TSLA ). "This is it," he thinks, "the trade that changes everything."
News flash: it did change everything — his $10,000 account turned into $2,147 in 48 hours.
The lesson? Position sizing isn’t just about managing capital. It’s about managing ego. Because the market doesn’t care how convinced you are.
🌊 Risk of Ruin: The More You Know
There’s a lovely concept in trading called “risk of ruin.” Sounds dramatic — and it is. It refers to the likelihood of your account going to zero if you keep trading the way you do.
If you risk 10% of your account on every trade, you only need to be wrong a few times in a row to go from “pro trader” to “Hey, ChatGPT, is trading a scam?”
Risking 1–2% per trade, however? Now we’re talking sustainability. Now you can be wrong ten times in a row and still live to click another chart.
🎯 The Math That Saves You
Let’s illustrate the equation:
Position size = Account size × % risk / (Entry – Stop Loss)
Example: $10,000 account, risking 1%, with a 50-point stop loss on a futures trade.
$10,000 × 0.01 = $100
$100 / 50 = 2 contracts
That’s it. No Fibonacci razzle-dazzle or astrology needed. Just basic arithmetic and a willingness to not be a hero.
🤔 The Myth of Conviction
Every trader has a moment where they say: “I know this is going to work.”
Spoiler alert: You don’t. And the moment you convince yourself otherwise, you start increasing position size based on emotion, not logic. That’s where accounts go to die.
Even the greats keep it tight. Paul Tudor Jones, the legend himself, once said: “Don't focus on making money; focus on protecting what you have.” Translation: size down, cowboy.
🔔 Position Size ≠ Trade Size
A common mistake: confusing position size with trade size.
Trade size is how big your order is. Position size is how much of your total capital is being risked. You could be trading 10 lots — but if your stop loss is tight, your position size might still be conservative.
So yes, trade big. But only if your risk is small. You’ll do better at this once you figure out how asymmetric risk reward works.
🌦️ Losses Happen. Don’t Let Them Compound
Let’s say you lose 5% on a trade. No big deal, right? Until you try to “make it back” by doubling down on the next one. And then again. And suddenly, you’re caught in a death spiral of revenge trading .
This is not theoretical. It’s Tuesday morning for many traders.
Proper position sizing cushions the blow. It turns what would be a catastrophe into a lesson — maybe even a mildly annoying Tuesday.
🌳 It’s Not Just About Risk — It’s About Freedom
Smart sizing gives you flexibility (and a good night’s sleep).
Want to hold through some noise? You can. Want to scale in? You’re allowed. Want to sleep at night without hugging your laptop? Welcome to emotional freedom.
Jesse Livermore, arguably the most successful trader of all time, said it best: “If you can’t sleep at night because of your stock market position, then you have gone too far. If this is the case, then sell your position down to the sleeping level.”
⛳ What the Pros Actually Do
Here’s a dirty little secret: pros rarely go all-in without handling the risk part first (that is, calibrating the position size).
If they’re not allocating small portions of capital across uncorrelated trades, they’ll go big on a trade that has an insanely-well controlled risk level. That way, if the trade turns against them, they’ll only lose what they can afford to lose and stay in the game.
Another great one, Stanley Druckenmiller, who operated one of the best-returning hedge funds (now a family office) said: “I believe the best way to manage risk is to be bullish when you have a compelling risk/reward.”
🏖️ The Summer of FOMO
Let’s address the seasonal vibes.
Summer’s here. Volume’s thin. Liquidity’s weird. Breakouts don’t follow through. Every false move looks like the real deal until it isn’t. And every poolside Instagram story from your trader friend makes you want to hit that buy button harder.
This is where position sizing saves you from yourself. Small trades, wide stops, chill mindset. Or big trades, tight stops, a bit of excitement in your day.
No matter what you choose, make sure to get your dose of daily news every morning, keep your eye on the economic calendar , and stay sharp on any upcoming earnings reports (GameStop NYSE:GME is right around the corner, delivering Tuesday).
☝️ Final Thoughts: The Indicator You Control
In a world of lagging indicators, misleading news headlines, and “experts” selling you dreams, position sizing is one of the few things you have total control over.
And that makes it powerful.
So next time you feel the rush — the urge to go big — take a breath. Remember the math. Remember the odds. And remember: the fastest way to blow up isn’t a bad trade — it’s a good trade sized wrong.
Off to you: How are you handling your trading positions? Are you the type to go all-in and then think about the downside? Or you’re the one to think about the risk first and then the reward? Let us know in the comments!

SPX/USDI've been calling for a crash for a while.
The closer to the top you are, the more hatred that you'll get for calling one.
It's a difficult position being contrary to the crowd. I think that's why Peter denied Jesus.
In any case, positive sentiment must end and as overdue as it is, I'm expecting a bang, after a final wave of FOMO.

SPX vs VIX: Is this a sign of a bullish market?VIX has seen a strong decline in the past 2 months following the massive surge of Feb-March due to the Tariff War. In contrast, the S&P500 rose massively to almost its ATH, which is a natural response as the two assets are negatively correlated. This VIX pattern has been seen during every major market bottom in the past 15 years, the strongest of which was the 2020 COVID crash. This is a sign of a very bullish market, TP = 6,800 by the end of the year.
## If you like our free content follow our profile to get more daily ideas. ##
## Comments and likes are greatly appreciated. ##

Big CorrectionThe S&P index.
The chart shows the potential end of the final rally from the 2009 low.
Currently, with this rally from the recent 4,800 low, we are still in a correction period that will end in late October (highs and lows are irrelevant), & We have a date coming up in August so let's see what happens there.
After this period, we will have a rally combined with uncertainty and unjustified speculative movements (bubble) that could take us to the final peak, which I expect in 2026.
This remains a possibility, but don't base your trades on it. However, caution is often good.

MAJOR TOP IS NOW IN PLACE 5th wave up from 4835 has ended 6059The chart posted is that of the sp 500 and I now have counted 5 waves up as ending based on this wave structure I will look for two things to happen a rather deep ABC if there is a bull market intact and it should decline in 3 waves back to .236/382 area from 6059 - 4835 The 4th wave or A low This MUST HOLD at .382 or The cycle has ended the 5 wave sup from march 23 low 2020 I sold longs this morning based on NAAII exposure and Now have moved to a 100 % long VERY DEEP IN THE MONEY PUTS 2027 Best of trades The WAVETIMER

SPX: geopolitics shaping sentiment Although the previous week on US equity markets started with a positive sentiment, still the newly emerged tensions in the Middle East turned the sentiment to the negative side. The S&P 500 was looking for higher grounds, after recently reaching the 6K level again, however, turning 1,13% to the negative territory on Friday, after the news regarding the Middle East tensions. The index is back below the 6K, closing the week at 5.976. While investors were digesting the risks from the Middle East tensions, tech companies were the ones that were mostly driving the index to the down side. NVDA dropped by 2,09%, AAPL was down by 1,38%. On the opposite side was TSLA, with a Fridays gain of 1,94%.
On the other hand, the macro fundamentals were relatively positive for the US economy. The inflation is clearly calming down, with the US inflation in May at 0,1%, which was better from market estimate. Also the University of Michigan Consumer sentiment preliminary for June showed decreased inflation expectation by US consumers, at 5,1% for this year, from 6,6% posted previously.
The most important event during the week ahead would be the FOMC meeting, scheduled for Wednesday, June 18th. The Fed will also discuss the economic projections. This would be a day to watch on financial markets as it can bring some higher volatility.

The market still has ample room to grow!Society isn't crumbling yet.... We'll get there sure enough, but as for now, there is still plenty of spoils to be had.

SPX500 Technical Outlook: Balancing Risk and RewardPost Content:
🔍 SPX500 Analysis - 4H Timeframe
Our latest technical analysis showcases a detailed approach to the S&P 500 Index using Smart Money Concepts, Fibonacci tools, and volume dynamics. Here's the breakdown:
1️⃣ Trend Structure
The price has formed a wedge within the premium zone, indicating potential exhaustion.
BOS and ChOCH markers highlight key pivots, emphasizing a weak high and strong low.
2️⃣ Fibonacci Insights
We're observing equilibrium near 5,668.57, a critical area where price may consolidate or pivot.
Higher Fibonacci extensions suggest an upside target near 6,580.38, should momentum hold.
3️⃣ Risk-Adjusted Strategy
Short Opportunity: Bearish retracement expected toward equilibrium; target around 5,668.57.
Long Opportunity: Look for confirmations to buy at the discount zone or post-retracement breakout above the weak high.
4️⃣ Volume Dynamics
Spikes at key pivot points signal institutional activity, strengthening the validity of liquidity zones.
📊 Trade Setup Overview
Entry: Short near premium zone OR Long near equilibrium/discount zone.
Stop-Loss: Place below the strong low for longs or above weak highs for shorts.
Target: Extensions at 6,580.38 align with the broader bullish sentiment.
🎯 Key Takeaway: This model emphasizes patience, precision, and risk management. Be sure to monitor upcoming macro events and confirm entry triggers before committing to any position.
🌟 Follow WaverVanir International LLC for more actionable insights, technical breakdowns, and AI-driven strategies!
📈 Trade Safe,
Team WaverVanir International LLC
