Us500:What is going to happen?hello friends👋
This time we are here with the analysis of us500, an important and vital index in the market that is being talked about a lot these days.
Well, let's go to the analysis, you will see that with the drop we had, a lower floor was made and the price was quickly supported and pumped by buyers.
Now it is clear that an ascending pattern has been formed, which is a very strong support in the specified area and a good buying point that you can enter into a transaction with capital and risk management.
Note that if the floor is broken and the stop loss is placed, our bullish pattern becomes invalid and we have to wait for lower floors.
🔥Follow us for more signals🔥
*Trade safely with us*
SPXM trade ideas

S&P500 INTRADAY support retest The Israel-Iran conflict has now entered its fourth day, with no signs of de-escalation. Iran launched more missile attacks, while Israel struck back, targeting a major gas field and a key military figure. Notably, Israeli strikes damaged Iran’s uranium facility in Isfahan, and an Iranian missile caused minor damage near the U.S. consulate in Tel Aviv.
While these developments added geopolitical stress, markets showed some resilience:
Oil prices pulled back after initial gains but remain volatile as the risk of supply disruption in the Middle East — a region supplying ~1/3 of global crude — persists.
S&P 500 futures edged higher, indicating investors are not fully in risk-off mode, but remain cautious.
On the political front, Donald Trump reportedly blocked an Israeli plan to assassinate Iran’s Supreme Leader. He mentioned the possibility of a future agreement between the two sides but said more conflict may come first. Trump is attending the G7 summit in Canada today, where leaders will discuss how to manage the Middle East crisis and navigate diplomacy with Trump.
For S&P 500 traders:
Monitor oil prices — a sharp spike on new escalation could weigh on risk sentiment.
Headlines from the G7 and any sign of U.S. involvement or de-escalation efforts could shift markets.
Geopolitical risk remains elevated, but the market is currently pricing in a contained conflict.
Key Support and Resistance Levels
Resistance Level 1: 6,058
Resistance Level 2: 6,138
Resistance Level 3: 6,200
Support Level 1: 5,953
Support Level 2: 5,913
Support Level 3: 5,845
This communication is for informational purposes only and should not be viewed as any form of recommendation as to a particular course of action or as investment advice. It is not intended as an offer or solicitation for the purchase or sale of any financial instrument or as an official confirmation of any transaction. Opinions, estimates and assumptions expressed herein are made as of the date of this communication and are subject to change without notice. This communication has been prepared based upon information, including market prices, data and other information, believed to be reliable; however, Trade Nation does not warrant its completeness or accuracy. All market prices and market data contained in or attached to this communication are indicative and subject to change without notice.

Markets Watch: Caution Ahead? U.S. stock index futures rose Monday, buoyed by easing oil prices, even as geopolitical tensions between Israel and Iran simmer in the background. All eyes are now on the upcoming Federal Reserve meeting. 👀💼
But here’s the catch on the S&P 500 👇
🔹 Price is stalling at a resistance line, tracing back to March highs
🔹 Daily RSI shows major divergence, signalling a loss of momentum
🔹 Rally is slowing just as it approaches the Feb all-time high at 6147
📉 If the index fails to hold and breaks below:
🔻 The 200-day MA at 5808
🔻 Key pivot levels at 5773 (Jan low) and 5787 (March peak)
…then we could see real downside pressure emerge.
🛑 For now, the market is showing red flags at a critical level. Stay alert — this could get interesting.
Disclaimer:
The information posted on Trading View is for informative purposes and is not intended to constitute advice in any form, including but not limited to investment, accounting, tax, legal or regulatory advice. The information therefore has no regard to the specific investment objectives, financial situation or particular needs of any specific recipient. Opinions expressed are our current opinions as of the date appearing on Trading View only. All illustrations, forecasts or hypothetical data are for illustrative purposes only. The Society of Technical Analysts Ltd does not make representation that the information provided is appropriate for use in all jurisdictions or by all Investors or other potential Investors. Parties are therefore responsible for compliance with applicable local laws and regulations. The Society of Technical Analysts will not be held liable for any loss or damage resulting directly or indirectly from the use of any information on this site.

Bull market for growth stocks (vs yields) ending...The Stock Market vs Yields is below the 10 year moving average.
Gold, silver, uranium, copper, oil & friends thrived in similar past setups.

Is SPX at a crucial point here.... inflection point?Until yesterday, it seemed that bulls were fully in control chugging along to make new ATH or go closer to previous ATH. Seemed like SPX was breaking from ascending triangle. Looked bulllish going into this Opex close, certainly propped by good data and good tariff comments.
Now with the recent war news, and the dip we had yesterday, seems like new pattern emerging (rising wedge) which is bearish. Also keep in mind the JPM hedge that expires end of month. The open interest shows that JPM hedge is still alive (they havent closed) and based on my calculations currently JPM has a loss of around $622M.
To stem losses market at minimum needs to be below 5900 by end of month (at 5900 JPM loses $59M but its chump change for them) and for them to be neutral or make money then SPX needs to be 5300 and below by end of month.
Currently around 5975, would mean a drop of 500-600 points in next 2 weeks... certainly can happen....
Appreciate your comments!


SPX: geopolitics shaping sentiment Although the previous week on US equity markets started with a positive sentiment, still the newly emerged tensions in the Middle East turned the sentiment to the negative side. The S&P 500 was looking for higher grounds, after recently reaching the 6K level again, however, turning 1,13% to the negative territory on Friday, after the news regarding the Middle East tensions. The index is back below the 6K, closing the week at 5.976. While investors were digesting the risks from the Middle East tensions, tech companies were the ones that were mostly driving the index to the down side. NVDA dropped by 2,09%, AAPL was down by 1,38%. On the opposite side was TSLA, with a Fridays gain of 1,94%.
On the other hand, the macro fundamentals were relatively positive for the US economy. The inflation is clearly calming down, with the US inflation in May at 0,1%, which was better from market estimate. Also the University of Michigan Consumer sentiment preliminary for June showed decreased inflation expectation by US consumers, at 5,1% for this year, from 6,6% posted previously.
The most important event during the week ahead would be the FOMC meeting, scheduled for Wednesday, June 18th. The Fed will also discuss the economic projections. This would be a day to watch on financial markets as it can bring some higher volatility.

post market ideasSPX rallied into resistance today, so far it's being held back there. Gold looks like a bounce is coming but I don't think it lasts. NG is looking more and more bullish. USOIL found support under 70 and should test the highs from Friday. BTC looks like it could come down a bit here.

SPX500 Under Pressure Amid Renewed Israel-Iran TensionsSPX500 Overview
Israel-Iran Truce Hopes Collapse
Investor hopes for a swift de-escalation between Israel and Iran were quickly shattered as both sides resumed hostilities. The situation intensified further after U.S. President Donald Trump urged Iranian civilians to evacuate Tehran and abruptly ended his participation at the G7 summit, reportedly convening the U.S. National Security Council.
These developments have fueled broad risk-off sentiment across markets.
Technical Outlook:
SPX500 remains under bearish pressure as long as the price trades below 6010. A continued drop toward the key support at 5966 is likely, with a break below this level potentially opening the path to 5938 and 5902.
However, if the price stabilizes above 5966 without breaking it, we may see a rebound attempt toward 6010 and 6041.
Any signs of negotiation or de-escalation in the conflict could trigger a strong bullish reversal.
Support: 5966, 5938, 5902
Resistance: 6041, 6098, 6143

SPX500 – Cautious Optimism as Market Eyes Fed DecisionSPX500 – Cautious Optimism as Market Eyes Fed Decision
Futures tied to the S&P 500 are slightly higher as traders appear to be shrugging off Middle East tensions, viewing the situation as contained for now. However, geopolitical uncertainty remains a risk, and attention is shifting toward upcoming Fed commentary and policy direction.
Technical Outlook:
The index may pull back toward 5989 and 5966. A break below 5966 opens the path toward 5938, with an extended target at 5902.
However, a 1H close above 6010 would signal renewed bullish momentum toward 6041.
Key Levels:
• Resistance: 6041, 6098, 6143
• Support: 5966, 5938, 5902

Geopolitics vs. Fed: SPX500 Trading Below Key Pivot at 5966SPX500 – Overview
Geopolitical Tensions & Rate Decisions Keep Markets on Edge
Investor focus has shifted from monetary policy to geopolitics, as speculation grows over a potential U.S. military strike on Iran.
According to Bloomberg, senior U.S. officials are reportedly preparing for possible action in the coming days. This comes as global markets remain cautious ahead of key central bank meetings that are expected to provide updated guidance on growth and inflation.
Technical Outlook:
SPX500 remains under bearish pressure as long as the price trades below 5966.
A break and hold below 5966 targets 5938, with further downside toward 5902 and 5885
For a shift to bullish momentum, price must stabilize above 6010
• Support: 5938 / 5902 / 5885
• Resistance: 5989 / 6010 / 6041

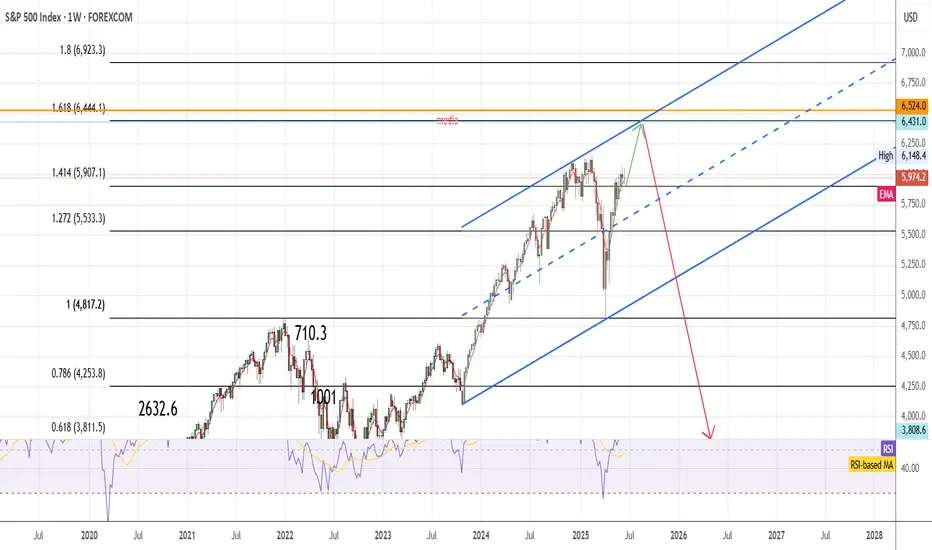
SPX tp 6440 then 3800In my view next month will be bullish for SPX, I expect a test of 6444 area (1.6 fibonacci extension from bullish trend started in 2020) then bearish market will start and push SPX to 3800 area.
Where will the market goes from here ?Gap or hole to be filled up reminds me of looking at your own wallet. How many times did you realise that you were low on cash (yes in SG, we still use a lot of physical cash) and needs to go to the ATM machine to withdraw money to fill it up.
Logically, from the chart, it appears that option 2 is more likely to happen first before we think a rally picks up thereafter, right ? Nobody can tells you for certain where the market is going and that is why it is easier to REACT to the market moves and follows the trend rather than oppose it and predicts how it should moves.
At any time, there can be short sellers, institutional buyers, government agencies, algo traders, etc that are in the market with tons of cash to move the market. How can you possibly knows as a retail trader ? That is why it is wiser and financially prudent to follow the market trend and not go against it.
If it breaks up to 6126 resistance level, I will add more for the 2nd leg bullish run. However, if it falls to the support at 5741 level, I will buy slightly more as it has becomes cheaper.
Either way, I am long term bullish on the market

The Market Sways and Trump sets a deadline ‼️ Hey hey, hope all is well, don't have too much time so just gonna keep this short and get at what we need right now, thanks for tuning in.
‼️ If you've been following the news then you understand that tensions are pretty high, the conflict in the Middle East is progressively getting worse and worse by the day with The United States now looking to play peacemaker between Iran and Israel.
‼️ Trump himself has given a two week deadline for him to decide on whether or not the United States will join the fight and bomb Iran which notably has the market shaken. Below I've added a link with a reference to an article which highlights the recent news and trumps deadline.
www.npr.org
‼️ Historically, we've seen trump do this before, he's no stranger to setting deadlines, especially when it comes to global conflicts. As the article also references, trump has done this before, take April 24th for example when a reporter asked Trump on his position with continuing military assistance for Ukraine: "You can ask that question in two weeks, and we'll see" responded Trump. It's become a tactic that Trump has used often throughout his term's prompting the question of whether or not we will really see him take action by the end of the two weeks or not. So we should take that understanding and take everything with a grain of salt.
‼️ The market itself is already use to the idea of war or joining a fight like we had to deal with when fighting started between Ukraine and Russia which shook the market before things ultimately got back to routine and the market was able to price in the war. I do have to note though that the global conflicts in Ukraine are much more different than those in the Middle East so that should be taken into consideration as well.
‼️ That being said on Saturday Trump made the announcement that the U.S had launched an attack on three of Iran's main nuclear sites signifying the U.S may be ready to join the fray. That or they have taken advantage of the high tensions to launch an attack of their own to beat at Iran's nuclear progress in order to delay, prevent them from acquiring a nuclear capability understandably.
‼️ I have to go but for technical analysis we'll be watching that 200 EMA for our bullish and bearish convergences, as well as news which will give us an idea of what way the market will head. Definitely one of those times to sit and watch how things play out, we've already come relatively close to retesting our all time high breaking above 6,000 so the market's definitely got some energy. We've dealt with this before but should the U.S really get itself involved with the war and bomb Iran then I would expect the global markets to react heavily. We've seen the U.S offer aid to countries such as Ukraine but when speaking about joining war that's a different matter entirely.
‼️ Definitely be mindful of the news the next few weeks as things progress and don't be to rash with your decision and choices, stick to what's worked and let's focus on what's worked. Paying mind to our indicators and strategies alongside much patience.
‼️ Thank you for tuning in with me as always, appreciate the constant support and wishing all the best. Feel free to keep tuned for more and thanks again.
Best regards,
~ Rock '

Bullish continuation?S&P500 (US500) is falling towards the pivot which has been identiifed as ab overlap support and could bounce to the 1st resistance.
Pivot: 5,796.40
1st Support: 5,555.95
1st Resistance: 6,091.55
Risk Warning:
Trading Forex and CFDs carries a high level of risk to your capital and you should only trade with money you can afford to lose. Trading Forex and CFDs may not be suitable for all investors, so please ensure that you fully understand the risks involved and seek independent advice if necessary.
Disclaimer:
The above opinions given constitute general market commentary, and do not constitute the opinion or advice of IC Markets or any form of personal or investment advice.
Any opinions, news, research, analyses, prices, other information, or links to third-party sites contained on this website are provided on an "as-is" basis, are intended only to be informative, is not an advice nor a recommendation, nor research, or a record of our trading prices, or an offer of, or solicitation for a transaction in any financial instrument and thus should not be treated as such. The information provided does not involve any specific investment objectives, financial situation and needs of any specific person who may receive it. Please be aware, that past performance is not a reliable indicator of future performance and/or results. Past Performance or Forward-looking scenarios based upon the reasonable beliefs of the third-party provider are not a guarantee of future performance. Actual results may differ materially from those anticipated in forward-looking or past performance statements. IC Markets makes no representation or warranty and assumes no liability as to the accuracy or completeness of the information provided, nor any loss arising from any investment based on a recommendation, forecast or any information supplied by any third-party.

SPY where are we going into OPEX and last week of June tradingYesterday was almost an indecision candle on daily. Markets cheered the jobs data earlier in day with a nice green candle, however the pump faded going into FOMC, where AMEX:SPY and SP:SPX were around 600/ 6000 at 2pm. FOMC event mostly turned out to be a "non-event". While the no rate cut and 2 for 2025 were largely expected, Powell spooked the markets commenting that he expects higher inflation in months ahead due to tariffs. Off course this set of a set of comments from Trump which was expected as well.
While markets are closed today (Juneteenth) futures are open, and in after hours and now we have drifted downwards... as of this writing SPX is around 5950. Bulls lost the 9 sma yesterday and now are trying to defend the 20 sma. Tomorrow is OPEX so expect some volatility and movement to where big money is positioned.
Certainly bulls can show up and reclaim 9 ma at 6003 or if we lose 5950, the next level down is below 5800. Meanwhile JPM collar is intact... Do we go down from here. Tomorrow will be key as we will know if we have lost 20 sma or regained 9 sma and how this week candle looks like.
Bulls can charge but is there enough gas in tank to make meaningful upside move? Maybe possible pump to open next week (around 6060 was recent high), but bears are now lurking to take us down towards that 5800 level next week.
As I said earlier tomorrow will be telling and I will update over the weekend.

SPX short analysisLike I wrote in my EUR/USD analysis you never know what could happened.
USA bombed Iran!
This could have huge impact on the US market next week.
My guess is temporarily short... At least to close this gap in spot price of SPX.
Since we're still in bearish market, until we see new highs, and this could be catalyst for another sell off. So the jump could be even bigger and we could see new ATH this year.
For now, I'm seeking a position to short tomorrow after market is open.
This is my entry mark.
There will be higher volatility. However, I expect US market to open in the red, close the gap and to sell off again.
We shall see!
Trade safe this one :)

SPX/USD Has A Double Top Pattern On The 1Hr Hey Traders and following gang!
Hope all are raking in profits on all your trades.
I spotted this double top setup on the 1hr SPX/USD.
A break below 5980.6 triggers a short down to target-1 5926.3
A break below 5943.8 triggers a short down to target-2 5842.1
A little scuffle in the Mid East helps this market fall so, short the ticker .
Best of luck in all your trades my friends and stay profitable $$$

$SPX // June 17 2025 // CPI Analysis & Targets for Day TradersSP:SPX // June 17 2025 // CPI Analysis & Targets for Day Traders

Weekly Red Candles Signal Potential PullbackOn the weekly chart, two clean red candles have formed. The price is struggling to move higher — every attempt to break above is being sold off.
An additional factor is geopolitical tension, which puts extra pressure on bullish momentum.
After such an exponential rally, I expect at least a pullback .
Could there be a new high and breakout above resistance? Yes, it's possible.
But the current setup offers a clear stop-loss just 1.60% below the current price — a small and comfortable risk.
This is not a quick trade. I plan to hold the position anywhere from 1 week to 1 month, depending on how the market develops. Therefore, I choose an optimal position size for my account, knowing that margin will be frozen.

Spy chart for 6/25/25This and patience, it can change based on how we open for New York session but we will see

Market at 10amSome quick notes. Everything looks choppy. Gold looks promising for an upmove. Natural gas maybe breaking out.

What do we need to know before investing?If you are thinking about investing money for the potential returns it offers, you should know that it may go well, but that there are always risks. That’s why we are going to give you some basic tips to bear in mind before making any investment decision.
How much money are you going to invest?
First of all, you need to decide how much money you want to put towards your financial investments.
The markets are subject to change
The financial markets are constantly fluctuating. The term volatility is the most commonused term to describe and measure the uncertainty provided by changes to theprices of financial assets.
Additionally, there are times in the market when the prices are more pronounced and every now and then there are crisis periods and asset prices fall dramatically.
Investing in financial markets means that we have to assume that our investments will always be subject to these types of fluctuations. If you are going to invest in the financial markets the money that you invest must be money that you will not need during the investment term.
That’s why, investing in order to obtain short term gains is inevitably associated with high risk. Furthermore, the larger our intended gains, the larger the associated risk. Always bear in mind that the greater the expected returns, the greater the assumed risk. Once again, be sure that you do not need the money that you are going to invest, as it may have losses.
The opposite can be said of long term investments, where the capacity to wait and overcome falls in the market means that you can assume more risk with your investments. With a long term vision you will avoid having to experience any possible losses with your investment period due to any eventual liquidity needs.
How much risk are you willing to take on?
Before investing it is important to know the risk you can assume. Every investor has their own risk tolerance level that they need to be aware of. Risks and returns go hand in hand, because for more returns you also need to take on more risk, and vice versa.
It is also good to know that just as with normal market conditions, those assets with a higher risk tend to suffer more fluctuations with their prices than those assets with less risk.
Therefore, in general terms:
When the forecasts for the financial markets are favourable and the market goes up, those assets with higher expected returns generally perform excellently.
Whenever the financial markets are going through uncertain times, those assets with higher expected returns, and therefore more risk, tend to perform worse.
You must start from a strong financial position
To invest you need to be at a point where your accounts are well under control, including your debts. We do not mean to say that if you have any outstanding credit you cannot invest, but it is essential that everything is in order and that you are in a situation where you can fulfil your financial obligations.
On the other hand, to build long term wealth, it is important that you assign part of your income to your savings, meaning that you have to invest with the money left over after making your payments while also saving part of what you earn.
It is important to keep a composed outlook
Now we know that investing bears its own risks and that the market is subject to change, it is essential to be composed when investing. When investing it is important to think positively, as if you don’t really believe that things will work out, why invest?
It is one thing to be cautious, and to know how much money to invest and what level of risk tolerance to assume, and another to think negatively each time there is a drop in the market. In reality, investing is a combination of caution and composure.
Diversification is the key to success
Somebody with less investment experience may make the mistake of putting all of their investment budget into just one thing. However, it is much better to have diverse investments, as while some investments may not quite work out as you would have liked them to, some do even better.
Losses are normal, and so are returns
We previously said that when investing it is important to stay calm, and that is true. In this regard, you also have to bear in mind that it is normal for some investments in your portfolio to not perform as well as you had expected.
We cannot predict the behaviour of the financial markets or of certain assets. We can also unexpectedly find ourselves with some assets that don’t perform as well as we had hoped. That is why we recommend, in addition to not risking more than you can invest, to diversify your investments well.
We have already said that investment involves risk, which is why it is good to know that if you are willing to invest, you are also willing to take on risks. If you are prepared to take on this risk, you can be successful in your investments.
Did you like it? Share with your friends
by HollyMontt
