Bullish continuation?S&P500 has bounced off the support level which is a pullback support that aligns with the 23.6% Fibonacci retracement and could potentially rise from this level to our take profit.
Entry: 5,784.04
Why we like it:
There is a pullback support level that lines up with the 23.6% Fibonacci retracement.
Stop loss: 5,689.40
Why we lik eit:
There is a pullback support level that is slightly above the 38.2% Fibonacci retracement.
Take profit: 6,003.35
Why we like it:
There is a pullback resistance level.
Enjoying your TradingView experience? Review us!
Please be advised that the information presented on TradingView is provided to Vantage (‘Vantage Global Limited’, ‘we’) by a third-party provider (‘Everest Fortune Group’). Please be reminded that you are solely responsible for the trading decisions on your account. There is a very high degree of risk involved in trading. Any information and/or content is intended entirely for research, educational and informational purposes only and does not constitute investment or consultation advice or investment strategy. The information is not tailored to the investment needs of any specific person and therefore does not involve a consideration of any of the investment objectives, financial situation or needs of any viewer that may receive it. Kindly also note that past performance is not a reliable indicator of future results. Actual results may differ materially from those anticipated in forward-looking or past performance statements. We assume no liability as to the accuracy or completeness of any of the information and/or content provided herein and the Company cannot be held responsible for any omission, mistake nor for any loss or damage including without limitation to any loss of profit which may arise from reliance on any information supplied by Everest Fortune Group.
SPXM trade ideas

BearishThe market has tapped into our orderblock and filling the imbalance,break of the trend will confirm our way to the downside.

SP500 Ready to Continue it's Bullish MoveI just bought SP500 for it's bullish move continuation.
Monthly structure is bullish.
Weekly is bullish.
Daily is also bullish.
I entered for a long buy on the daily time frame retracement.

Hellena | SPX500 (4H): SHORT to 38.2% - 50% Fibo lvl 5489.Colleagues, I have reviewed the waves a bit and I believe that when the strong psychological level of 6000 is reached, a reaction and correction in wave “2” is possible.
I propose to consider this movement as a strong five-wave movement. Wave “1” will be over soon.
I consider the 38.2% - 50% Fibonacci levels of 5489 to be the main target of the correction.
Manage your capital correctly and competently! Only enter trades based on reliable patterns!

SPY Moving UpWe can look for price to continue up We are starting to see some selling pressure. The RSI on the one hour still has to grow.

SPX: tariffs, againPrevious week was relatively calm when macro data were in question, however, the peace was interrupted with a new narrative regarding trade tariffs. The US Administration plans to set trade tariffs with the European Union at 50%. The US President recently noted that these tariffs are currently not negotiable. Such a narrative imposed a drop in the value of the US equity markets. The S&P 500 was traded with a negative sentiment during the week, dropping from 5.962 down to 5.802 at Friday's trading session.
Another news hit Apple shares, when the US President commented that this company has to pay 25% on all IPhones which are not produced in the US. After this post, shares of Apple dropped by 3% on Friday. Analysts involved in a matter are commenting that the transfer of IPhones production from China to the US would increase the price of IPhones by 25%. On the other hand, the company United States Steel surged by 21% after the US President's announcement of a deal and “partnership” with Japanese Nippon Steel.
At this moment analysts are in agreement that the market is set for a sell-off in case of any news related to trade tariffs. The positive sentiment is extremely fragile and this might continue for some time in the future.

Monday Bounce from 4H Demand ZoneAfter taking a controlled loss on Friday, I came into Monday focused and clear-minded. Price tapped into a clean 4H demand zone and printed a strong bullish engulfing candle — a textbook rejection from imbalance. I waited for the 4H candle close before entering long.
Risk was tight below the demand zone, with a clear target above — offering a high RR setup. This trade wasn’t about the day of the week; it was about respecting structure, imbalance, and confirmation.
Pair: US500
Timeframe: 4H
Setup: Bullish engulfing off 4H demand zone + imbalance fill
Entry: After 4H candle close
Stop Loss: Below demand wick
Take Profit: Major clean high above imbalance
Risk-to-Reward: Over 3R
This is why I trade the 4H. One clean move. No stress. No noise. Just structure + patience.
– THE 4H TRADER

SPX500 H1 | Overlap resistance at 61.8% Fibonacci retracementSPX500 is rising towards an overlap resistance and could potentially reverse off this level to drop lower.
Sell entry is at 5,881.33 which is an overlap resistance that aligns close to the 61.8% Fibonacci retracement.
Stop loss is at 5,945.00 which is a level that sits above the 78.6% Fibonacci retracement and a swing-high resistance.
Take profit is at 5,823.81 which is an overlap support.
High Risk Investment Warning
Trading Forex/CFDs on margin carries a high level of risk and may not be suitable for all investors. Leverage can work against you.
Stratos Markets Limited (tradu.com ):
CFDs are complex instruments and come with a high risk of losing money rapidly due to leverage. 63% of retail investor accounts lose money when trading CFDs with this provider. You should consider whether you understand how CFDs work and whether you can afford to take the high risk of losing your money.
Stratos Europe Ltd (tradu.com ):
CFDs are complex instruments and come with a high risk of losing money rapidly due to leverage. 63% of retail investor accounts lose money when trading CFDs with this provider. You should consider whether you understand how CFDs work and whether you can afford to take the high risk of losing your money.
Stratos Global LLC (tradu.com ):
Losses can exceed deposits.
Please be advised that the information presented on TradingView is provided to Tradu (‘Company’, ‘we’) by a third-party provider (‘TFA Global Pte Ltd’). Please be reminded that you are solely responsible for the trading decisions on your account. There is a very high degree of risk involved in trading. Any information and/or content is intended entirely for research, educational and informational purposes only and does not constitute investment or consultation advice or investment strategy. The information is not tailored to the investment needs of any specific person and therefore does not involve a consideration of any of the investment objectives, financial situation or needs of any viewer that may receive it. Kindly also note that past performance is not a reliable indicator of future results. Actual results may differ materially from those anticipated in forward-looking or past performance statements. We assume no liability as to the accuracy or completeness of any of the information and/or content provided herein and the Company cannot be held responsible for any omission, mistake nor for any loss or damage including without limitation to any loss of profit which may arise from reliance on any information supplied by TFA Global Pte Ltd.
The speaker(s) is neither an employee, agent nor representative of Tradu and is therefore acting independently. The opinions given are their own, constitute general market commentary, and do not constitute the opinion or advice of Tradu or any form of personal or investment advice. Tradu neither endorses nor guarantees offerings of third-party speakers, nor is Tradu responsible for the content, veracity or opinions of third-party speakers, presenters or participants.

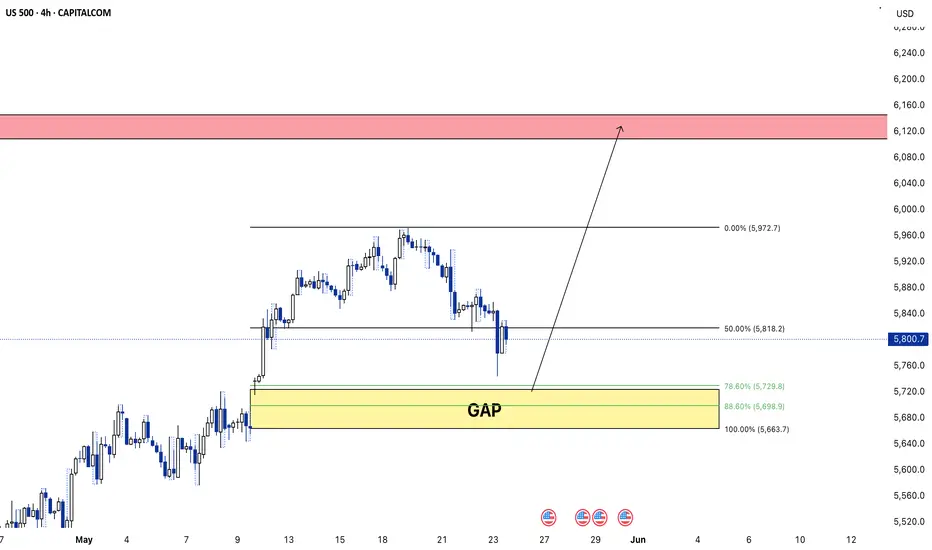
SPX - LONGWait for price to fill the gap. Once in the zone wait for bullish confirmation on the higher time frames for bulls to take over. TP set at previous highs.
Looking at Examples of 4.23 Breaks If markets continue to make shallow dips and rally higher, or even if there's a big sell off and false break of the lows that makes a V recovery then we're seeing a whole lot of things up-trending above massive inflection points. In this post I want to show you some different examples of what has happened on 4.23 breaks.
The 4.23 level is a very high probability level to trade off. Even on an intra day basis this will most often have at least reactions and can have full reversals off it. You can see in the SPX chart that the 2022 top came off the 4.23. When a 4.23 is going to be a reversal level it will often react to the 4.23 spike it out. Come back under and hold a retest. Forming a head and shoulders pattern with 4.23 as the shoulders. That setup when successful is a fatal setup for the trend. When inside the 4.23 head fake you're inside the end of the trend.
Interestingly, not only is SPX at this 4.23 level but so are lots of other things. Bitcoin is, for example.
BTC is often a good proxy for risk on/off so it's interesting this is at this big decision level along with SPX is interesting.
In the 4.23 reversal the rejection of rallies can be so strong and abrupt there's not a chance to do anything during it. You really have to think about it in advance.
But if the 4.23 break it's extremely easy to the upside for the foreseeable future.
Let's start with looking at the different 4.23 decisions in AAPL over the years.
This first one shows how the head fakes can be the end of rallies. This correcting relatively shallow compared to the full risk. Holding the 2.61.
From this pullback and 4.23 break AAPL went up 200% without any sizable pullbacks.
Advancing to the further swing.
In this one AAPL began to go parabolic in the run to the 4.23. Got a bit above it. Crashed back to it. Held retests and then went into a big boom move.
Almost every week closed higher in this period which continued until over 100% above the 4.23.
We advance the swing again and ... what's the chances?
AAPL last top is 4.23 and now we're retesting the 4.23.
Now ... there are different things that can happen. But if you were to assume the 4.23 pattern in AAPL continues it'd have to do this.
And if you believe that is possible (and it's possible) then the SPX chart in the OP makes a lot of sense, right?
Expecting BTC would do this would be obvious if indices made that move.
Look at NVDA.
To overlook the risks of rejection would be fatal if wrong (this could be a simple head and shoulders like pattern) but viewed through the lens of a 4.23 pullback this would have a hyper bullish forecast to it.
Over and over again you can make this case for things doubling without any major pullbacks. Candle after candle up-trends.
It would not be a time to be a bear!
Here's a look left on NVDA. If you had fibs from the crash range here was the 4.23 decision.
We could be somewhere like here in NVDA.
These are things you certainly have to respect the risk of as an active shorter of things. It'd not be good. And they're such massive outsized opportunities if they form like this that it'd be insane to not prep for what to do in this. If week after week after week is closing green and we never trade under the last week - a smart trader can build a massive position in that.
Think about the positions you could build in these periods where the market never crosses your entry again.
And then wait and start to trail stops when it goes parabolic. During this period there will be 10% jumps up and the trend of shallow pullbacks will continue.
Carrying a bear bias into this would be bad because although the trend never breaks there a enough pullbacks to mean you can easily end up bearish in the worst rally zones. If betting on things like bull traps/spike outs.
These moves above the 4.23 are very common. A sharp doubling of the trend happens above the 4.23 a lot!
If SPX is going to break it and have the common reaction - everything is going vertical. There are lots of things that are at the 4.23 zones now and you can add 100% onto the 4.23 and think it's probable it will get to there and head fake over it a bit. 100% should be a fairly "Safe" target for the 4.23 break.
More speculative ideas would be to look for things that are currently down a lot and draw a fib from the high to the low of those. If we enter into a mania condition where indices are up every week then we might see mania in the hyper speculative things that were in favour previously.
Example;
Not think this sort of thing works on doge?
We have a current 4.23 top and a drop to the 1.27. That's the full predicted correction off a 4.23. It's not always the bottom - but this is the target for a 4.23 drop. Doge may have completed a full 4.23 cycle and be heading into the next. Absolutely possible. If that were true, this would be set to begin to trend very hard.
The consideration has to be what if SPX is here.
It'd be fair to say the odds of this are low but how high would they have to be to make it worth considering?
People act as if the idea of considering massive downside risk means you're scared to take upside risk. Which isn't the case. If anything, I am advocating for more aggressive upside risk betting on the solid trend continuation with tight trailing stops if the breakout is made. Inside the area where we have most chance of a pullback in an uptrend and a wipe out top in a reversal I'm extremely aware of what those risks might look like, but I won't be "Side lined" in a breakout. It means I don't want to broke if the extreme risk thing happens.
Indices could more than double or more than half off the 4.23 decision. We're in a really interesting time.
If we break I plan to trade as if we're going to be up and up every week. Only take long setups. Maybe have a few macro short levels along the way but be mainly a perma bull. If we get the consistent buying weeks I'll expect all dips will be bought and the uptrend will turn into a parabolic run, I'll act accordingly.
And if we start to get massive 10 - 20% weekly candles somewhere over 10,000, I'll suspect that may be blow off action and start to think about fading. By this time we'll be at the next set of important fib levels and I'll use a very similar form of analysis.
If you use any half decent trend strategy with a stop loss you really can't lose money in a typical 4.23 breakout. Even those mindlessly buying with no downside control can run up a lot (although it's questionable if they get to keep it or not).
The fact this is a possible outcome for bears if the resistances fail at this level is something I think macro bears should consider, deeply. Because you don't have to "Be wrong" for this to happen. If your thesis this is all a big stinking bubble - your biggest risk isn't you're wrong, it's you're right! And we're inside the bubble. Not at the end of it. Bubbles FREQUENTLY double into their end points.
This would be a major opportunity for any who embraced it. I do think seeing this happen would be warning things were going to get ugly later but the money to be made in the 5000 - 10,000 run would be exceptional. Accumulating intra day/week with trailing stops would probably see you hit trailing stops about three times most of them you getting in lower and you could end up making 1.000% for the 100% the market went up - and do this while keeping risk capped low since you're always trailing stops to lock in profit.
The opportunity isn't in the price forecast/% as such. It's more in the fact that if it is right it should be evidenced by those periods of extremely consistent trend. These will go on for a long time. Be interrupted. Chop / drop and then resume. The amount you can make in those types of trends if you expect them is off the page. And it'd be easy. There's a few times it'd be tricky and these can be deal with by simply waiting - because later it will be easy.
What makes this all the more important to consider for bears I think is the fact that we could say the highest probability way that SPX makes this move is by dumping under the last low to retest the 4.23 first.
Which would feel very bearish. Very "I should sell the rip" ish. The move that this would make is one I already have marked in as a warning that we could end up going significantly lower. I have to understand all those conditions could fill and even although it all looks exactly like a bear setup, it's actually a 4.23 retest. Very different things for the next swing.
Every major high and low in SPX during the last decade has interacted with the fibs from the 2008 low. They've marked out the highs/lows better than anything else.
We're now at the most important one of those. It hit in 2022 and since then we've been inside the suspense period of it. The 4.23 reaction didn't tell us all that much. A 4.23 spike out doesn't tell us all that much. Both of these things happen in the bull and bear moves. But the actual decision after the attempt to break 4.23 matters a lot.
Whatever happens here is likely to be the most pivotal decision point so far.

S&P 500 Weekly PotentialVolatility, expressed through standard deviation, quantifies market elasticity and presents a level of probability and precision that humbles us all.
This week with SP:SPX bi-weekly trends have risen to just below our monthly values and are currently expansive over the markets IV prediction. Right now as I see it, HV10 is going resonate alongside our monthly values showing continued strength over IV. We could full regression to quarterly means as we move our of corrective territory then see consolidation to cool the markets down.
BOOST the post, drop a follow and comment, BUT don't circle back at the end of the week to revisit and observe how our trending markets preformed!

Up again for SPX500USDHi traders,
Last week SPX500USD retested the 4H FVG once more and made a (corrective) move down into the Daily BPR. This was exactly the move I've predicted and I hope you took some value from it.
Now price rejected from the Daily BPR so next week we could see this pair go up again to the higher Daily FVG.
Let's see what the market does and react.
Trade idea: Wait for a bullish change in orderflow and a small correction down on a lower timeframe to trade longs.
If you want to learn more about trading FVG's & liquidity sweeps with Wave analysis, then please make sure to follow me.
This shared post is only my point of view on what could be the next move in this pair based on my technical analysis.
Don't be emotional, just trade your plan!
Eduwave

S&P 500 Daily Chart Analysis For Week of May 23, 2025Technical Analysis and Outlook:
The S&P 500 Index demonstrated a consistent downward trend during this week's trading session, reaching a significant target at the Mean Support level 5828. The index is currently trending lower, targeting the Inner Index Dip at 5730, with additional marks identified at the Mean Support levels of 5660 and 5600. Conversely, the index has the potential to rebound from its present position, advancing toward the Mean Resistance level of 5860 and retesting the previously completed Outer Index Rally at 5955.

Is Trump Triggering a Mini Market Crack to Drive Capital into Tr📉 Is Trump Triggering a Mini Market Crack to Drive Capital into Treasuries?
Recent remarks by former President Donald Trump — including threats of 50% tariffs on EU goods and pressure on Apple to manufacture domestically — have sparked sharp red moves across the U.S. markets.
Which leads to a serious question:
👉 Could this be a deliberate strategy to induce fear in the stock market and push both institutional and retail money toward U.S. Treasury bonds?
In a context where the U.S. government needs to issue and absorb massive debt, and where yields are rising to attract buyers, a sell-off in equities might:
💰 Boost demand for Treasuries
🔥 Justify aggressive fiscal or monetary actions
🎯 Reposition political actors as “economic saviors”
I’m not making claims — just thinking out loud...
Are we witnessing a calculated move to reroute capital from equities into U.S. debt, using fear as the vehicle?
What do you think — coincidence… or strategy?

SPY ready to continue its up-trend?!?Now that price has pulled back, we’ve seen a reaction from the daily 20 EMA, forming what resembles a hammer candlestick. This could signal that the uptrend may be ready to resume.
That said, Monday will be key. If the market continues to show strength, it may confirm a continuation to the upside. But if price drops instead, we could be in for a deeper pullback.
⚠️ Remember: just because we’re in an uptrend doesn’t mean the market can’t reverse. The market is unpredictable, and that’s why reacting to price behavior at each point of interest (POI) is so important.
Stay flexible, manage your risk, and trade what the market shows you, not what you expect.

Bear Case Requires Downtrend Action. Strong Bull Bias Otherwise.With the recent breaks the odds are strongly towards 5500 hitting and if that breaks the odds are greatly for far lower hitting but I want to take some time to make sure I am clear on the binary nature of where we are.
The market is in a "Might go up, might go down" spot. Probably won't go sideways for long. I think we're probably going to see strong trends coming out of whatever decision is made here.
First thing I want to really drill in for my bear friends is a sell off from the 86 means nothing at all. Most of the time this is a bear trap. We have broken the first level it may have bottomed so the bias is strongly towards the next ones hitting but having a strong bear bias at this point in historic SPX setup would have led you into a lot of trouble most of the time.
If you fade trends the thing you always have to be worrying about is you've got this "pretty much" right but you're actually one swing too early. Because when that happens, the last swing is always exceptionally strong.
Fading trends is hard because if you're wrong it trends against you and if you're 95% right it spikes against you in the most ruthless of ways. What makes this all the worse is that comes off a correction in the trend so you end up with a bigger zone in which you're wrong. For example if we began to rally here there's now about 4% extra you could be wrong while saying we're still inside the last high.
Any time you're fading a trend and it's going well you should think of this risk. You have to map in the risk of a 161 head fake. These happen a lot. A common thing in blow offs. If you're right about the reversal after this move the short will be easy - but it's not easy to take if you're short bias into it.
Given the broader context of everything, I don't think I favour the 1.61 head-fake being the outcome if we rally. If we rally again then we're seeing prolonged big chart trending action above the macro 4.23 and I've only ever seen trends getting stronger when they can break a 4.23.
If the 1.61 breaks we can end up at the 4.23 - which would be a monster move.
The instance of a 4.23 hitting from a 50% crash are extremely rare. Every instance of it there has been in indices has led to a massive trend decision. All instances of bubbles tend to have clear changes in their momentum when breaking 4.23 fibs.
SPX is already above the 4.23 fib. The bear thesis has it this is a head-fake of that. It needs to be evidenced by a strong rejection of the head-fake.
Earlier I mentioned the tendency of 1.61 head-fakes. This was the most recurring big obvious topping signal I found when looking at crashes. We'd usually dummy drop and then make a 1.61 spike out. This is the rule I use to tell a pending false breakout from a breakout. If it breaks the 1.61, I expect it will get at least very close to the 2.20. If it can not break the 1.61, then there's a strong chance it may be topping.
Our current top is on the 1.61 hit and we're now into a retest of that.
The 1.61 sell off is interesting because if it's a 4.23 reversal we have to be in a head fake above it and if it's a head fake we are looking for a 1.61 spike. These things make the speculative bets into the retest compelling and the pragmatic "What if" planning for a break worth covering. A 1.61 reversal would be expected to be a nasty event.
A 1.61 reversal would take out the last low (by definition, it's just a bit pullback otherwise) and it would do this in a strong consistent selling manner.
Which would be crash like on this timeframe.
But the 1.61 reaction is not in any way prescriptive of a crash at this point. A common pattern is a big pullback from the 1.61 and then when it has been broken again it goes into a strong rally to the following fibs. This can top on a few of the fibs but full extensions in strong trends spike out 4.23.
Inside the context of the overall building of the trend what is happening now would be insignificant overall. Even if dropping all the way to 5500. A full expansion of this would agree with the other fibs we had around the 10,000 level. Furthermore, a doubling period off the breakout of a 4.23 I'd consider to be a highly probable outcome.
If the bear thesis is wrong here it can be wrong in a way that is irrecoverable. A persist bear will get you slaughtered.
The case for a potential bear move here is extremely strong but that does also tend to mean the failure of it would be all the more spectacular. It makes a lot of sense to bet in these zones because there's a high chance you can at least break even on short term reactions and can perhaps make a lot in bigger reversals.
It's pragmatic to be aware of what the larger risks of a reversal would be and how the swings in that would likely form. You have to think about these things ahead of time because otherwise it all happens too fast to really have time to think. Impulse decisions are usually bad.
I have a high degree of confidence in the fibs being able to map out the important levels. My ability to know what that means ... not so much. I may or may not get it right.
What is highly likely to be right based on 100 yrs of swings in SPX is the next major swing will relate to a previous swing in such a way that fib levels make it possible to get a good idea of the major highs/lows of the move. All the ways we can do that from here imply massive moves. If it's not 50% off the high it's 100% from the 4.23 break.
How all this relates to where we are at this moment in time is we have to accept the potential of the bear bet being so wrong that even if there's a crash later it comes back to this price - meaning if it doesn't work here- entirely drop it and aggressively trend follow. If the bear bet is right we have to be inside of a 1.61 head fake of a 4.23.
If we're inside of a head fake is has to sell off very consistently. We crash back to the break level. Price "Isn't meant" to be above that level and when the brief flurry is over it's nothing but selling.
The consistency with which this style of rejection has is uncommon so it was really weird seeing it off the first 1.61 reaction. For the rejection thesis to be valid now the pullback in is we should be in the second trend leg which will complete the return to 4.23. If it's the second trend leg it can't be weaker than the first. The first was extremely consistent.
From my perspective that's the bear bet. It's really specific for me at this point. If the bear thesis is going to be good we're inside a 1.61 head fake. The 1.61 is retesting and when it is rejected for a second time we're into a strong downmove to where the false breakout started.
What it would take from the prices we currently are to turn me into a hyper raving bull that was discussing different bubble moves that may be about to build up is not a lot at this point. It would take very little to convince me to start to buy all the dips with tight stops and it'd not take all that much longer of that working for me to say it was extremely likely all the implied bear risk was behind us and it's all rockets and emojis for the next two years.
I think when it comes to what the next big swings will be in markets it's important to be very objective because it's wild just how easily juxtaposed ideas can make sense. For example, AI. One could make a bulletproof case that we should expect a productivity boom based on AI. Lots of people can do much more. But you can make the inverse forecast that AI will be deflationary. Bringing prices down. Creating job losses. As jobs are lost, less money is spent - especially if things are deflationary because you can buy it cheaper later. Less money being spent is less business income and more jobs lost. Companies that survived would likely main use AI and it's easy to see how all that could end up being bad for markets.
There are a lot of things like could go either way like that and have polarised reactions in the market but something related to AI is almost certainly going to happen. If AI advancements don't stall out rapidly they're going to start making real changes in the things happening in the world - this could easily justify a bubble or it could put prices into a race to zero.
Then there's weird things like what happens when AIs become more and more of the trading volume - surely that's coming ... right? What will they do? It's something you can again make binary extreme cases for. You could make a case that the AIs would notice patterns of a topping market and start to trade in a way that brought about a crash. Or you could argue AIs might start to engage in some form of reward hacking and the way to optimise success is to drive the market vertical.
I don't really see the point in narrative based analysis but if you do a thought experiment where you imagine the market either has crashed or has doubled rapidly it's now easier than it ever has been to find different viable ways you could work backwards to how events complimented that.
It's wise to be agnostic and evidence based while we're at such a big decision level because the potential to be wrong big is so great and the likelihood you'll be bluffed into thinking you're right just at the worst moment is so high. Maybe bulls have had that now. But even if we sell and make a new low, this may turn out to be a second leg of a bear trap and be the low- being wrong from there as a bear would be even worse. Runs to new highs could come before a crash.
If and when the decision is made it should be easy to make money. The 4.23 break would be far better to make money. The trend lasting over a year. A bear break would be trickier with the ups and downs of a bear market but lucrative for the correct strategies. The important thing is being equally acceptant of either outcome - and also accept the reality that neither of the implied outcomes may happen. Which would be a huge anti-climax for me. Really would. If whatever happens next is vanilla, I'd feel a bit cheated.
The 4.23 rejection off a 1.61 spike out would be a very exceptional thing. It should be evidenced by exceptional action.
If the bear trend is not persistent, there's a good chance it's not working. Up-trending through the resistance levels would make the bear case indefensible in my opinion and in the event of a typical 4.23 break make being bear bias into the future certain to fail no matter how good you are at it.
The down move has a lot of proving it to do yet before it crosses from an expected move in a bullish pullback to a real threat of a trend break.
At this point both would look exactly the same - what we see in the coming week is likely to be more telling.

SPX500 Quick Market Outlook – May 23, 2025 | 15m ChartPosted by Wavervanir_International_LLC
Today's session shows bearish continuation patterns despite a temporary bounce. We're currently trading just below the equilibrium level, with price rejecting from the 0.5 and 0.618 retracement zone. The bearish OB (Order Block) above continues to act as a ceiling.
🔍 Key Observations:
Price action is forming lower highs under resistance.
Volume profile and Smart Money Concepts (SMC) suggest distribution near the 5787–5794 zone.
Break below 5766.41 (daily ORB low) could open the path to 5721.75 – 1.618 extension.
Bullish invalidation only above 5793.80, where price would regain control above the mid-FVG and EMA cluster.
⚠️ Watch List:
Key levels: 5787.44 (pivot), 5761.17 (support), 5721.75 (target)
Bias: Bearish unless price reclaims 5795+ with volume
Trigger: Confirmation via 15m candle close below 5766 and breakdown in volume structure
Stay adaptive. The market structure is still forming, and liquidity sweeps can occur.

Full Bear Break PlansToday we took out our second important support level and have sold off strong under it. We're in a rally as I write this but it's still inside the expected corrective range.
We still have not net where I'd expect critical supports to be around 5500 but at this point KI feel we do have enough info to make a forecast of what a crash would probably look like.
People always think crash forecasts are hard to make. Top forecasts are hard to make. Accurate forecasts on when a crash break will or will not happen are hard to make. When it comes to the actual swings of a crash when they happen - historically always been very simple to make. If the bull trap low and high is known, the crash levels have always been foreseeable.
For example, when this low and high was known in 2007, all the important levels and the low of the 2008 / 2009 move could be mapped out.
This isn't an isolated case. It's happened in all previous crashes. If you follow my work you'll have seen me trade important levels in drops / lows many times and it's always based on some derivative of this.
If we know the high/low of the bull trap then we can identify the important break level and map out all the levels to the downside that would typically hit.
We can know the zones where there's the risk of this and also know early if the bear setup is failing.
If SPX was going to make a classic break it'd be quite easy to approximate the classic swings we'd have now.
The first continent for this is a wick rejection on the monthly chart, and ideally in the last part of the month. This may be underway now. The selling has to stick with us either going lower or at least holding down - but if things keep going as they have recently we'll have the wick candle.
I recently showed how we tend to have the failure of bullish wick candles before a trend break. In that setup we usually see a big bullish wick candle. Often an attempt to rally and rejection so we have opposing wick candles (bull wick is usually bigger) and after this comes a bearish engulfing candle which is bigger than all the candles around it and takes out the wick low.
That move would take us to about 4500. And almost certainly be news driven.
From here we usually enter into a period of choppy action. It feels bullish and bearish but it's really just going sideways. Often this will end with two big bluffs. First a bluff at being about to break to the downside and then a big spike out of the recent highs.
This choppy action would likely go on for a few months in total with a high somewhere around 5000.
That'd be the last major bull trap and from there we'd start to head into the crash section. During this section we'd travel as much as the full bear swing from high to the current low had taken but we'd do it in a fraction of the time. Over the space of a couple months we'd make a massive news supported capitulation to under the 2022 low.
That'd then complete a 50% drop from the high. Even in extremely bearish setups we tend to get a bounce from around the 50% off the high level and we also tend to get a bounce when we spike out an obvious support zone - so whatever the overall move would be, if and when the 2022 low was spiked out this is around where I'd expect an important low.
This is a step continent trade plan. We can define a marker and if it hits then the bias is towards the next marker.
The first marker was there would be a monthly wick candle.
The following marker would be there is a rejection and close down end of month.
Third marker would be a massive bear candle taking out the wick low.
Fourth marker would be the "Recovery" being muted and stalling out around 500.
If all of those things happen, then the risk of a following breakout becoming a crash event would be high.
In theory, we could be about 6 months from a major crash and we could put in a series of specific markers as warning signs along the way.
First warning sign is there being no V recovery to this selling and the monthly candle closing with a wick.
This post touches on various things that have been explained in far more detail in recent posts. It'd be recommended to read those for full context.

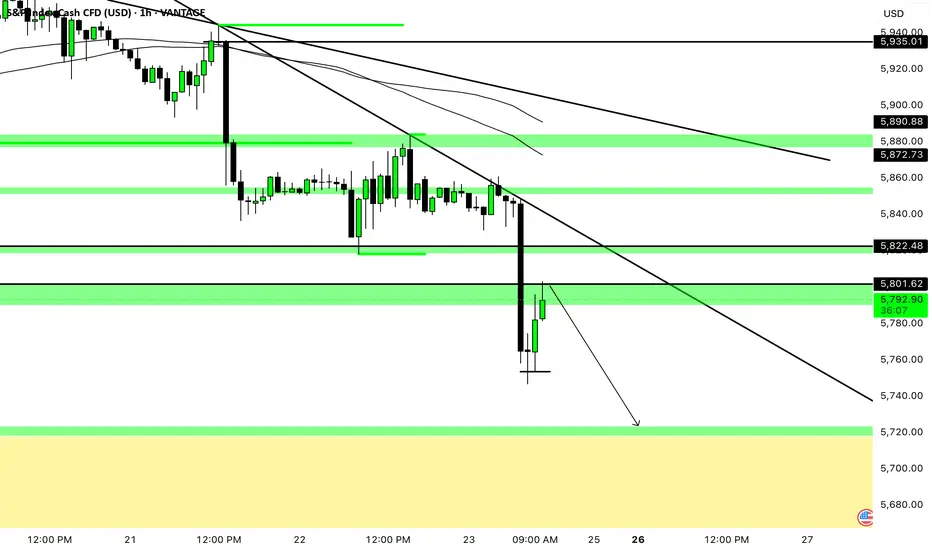
SPX - SELLPrice broke key support levels. Aiming for SPX to continue the sell side momentum and fill the gap.
SPX Down/Gold UpWIth the move down on SP500 overnight, gold rallied. Both look like they may be nearing the end of the move down so caution is necessary.

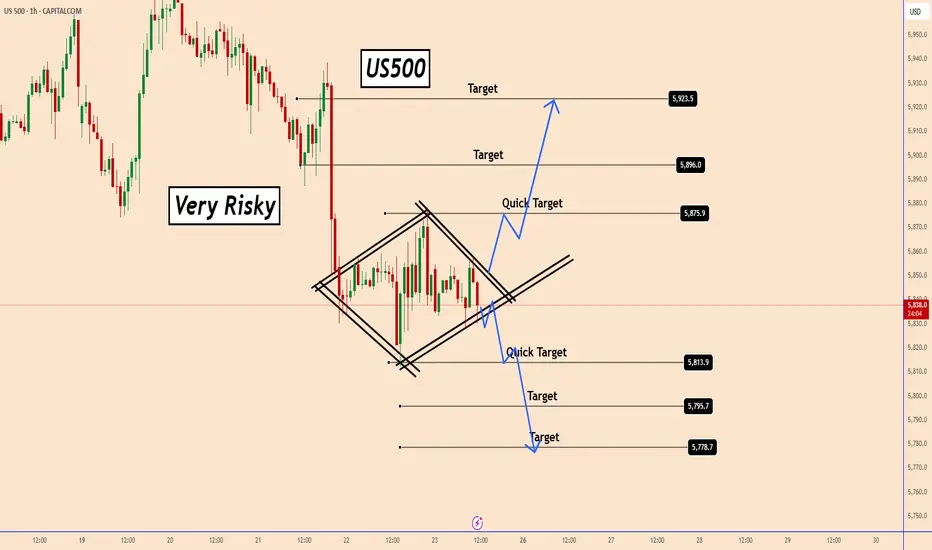
US500 at a Crossroads: Diamond Pattern in PlayUS500 at a Crossroads: Diamond Pattern in Play
US500 is forming a small diamond pattern, but the risk is high since the pattern is still developing and could evolve further.
The price shows signs of a decline, but a strong breakout is needed to confirm the movement.
Diamond patterns are typically trend continuation setups, but the final direction depends on where the breakout happens.
Both scenarios are well explained on the chart
PS: The best approach is to wait for the breakout before taking action.
THIS SETUP IS VALID ONLY FOR TODAY
You may find more details in the chart!
Thank you and Good Luck!
❤️PS: Please support with a like or comment if you find this analysis useful for your trading day❤️
GAP to Fill in RectangleThe S&P 500 (SPX) is poised to fill its recent gap, having re-entered the prior consolidation range and now challenging the 200-day moving average. With the Relative Strength Index (RSI) sitting near overbought territory, the market may need a brief cooldown before resuming its trend. At the same time, rising bond yields are casting a shadow on equities, as investors weigh the impact of higher borrowing costs on corporate profits. Until yields stabilize, we’re likely to see heightened volatility around key technical levels.

SPX (S&P 500) – Double Top Rejection or Fakeout? Major BreakdownThe S&P 500 just got REJECTED at the key supply zone near 5,842, a level we’ve tested multiple times since Q1. This looks like a potential double top, and the rejection wick is no joke!
Here’s what’s cooking:
1. Strong Supply Rejection:
Price failed to break and hold above the 5,842 level – this zone has now acted as a wall for weeks. Clear signs of exhaustion from the bulls.
2. Bearish Setup in Play:
If price fails to reclaim 5,842 fast, there’s room to fall toward:
5,044.09 – Previous breakout zone
4,091.47 – Major demand (high volume node & previous consolidation base)
3. Clean Risk-to-Reward Bearish Play:
Short entries from the supply zone with stops above recent highs could offer great R:R down to the 4,000 zone.
4. Macro Context:
This rejection comes at a time when economic uncertainty is rising – a correction may already be in motion. Watch for institutional exits.
Trade Plan:
Bias: Bearish below 5,842
Confirmation: Break and close below 5,700 for momentum
Target Zones: 5,044 and 4,091
Invalidation: Daily close above 5,900
Is SPX done pumping or will bulls defend?
Drop your thoughts – Short or Long?
Like & follow for real-time updates!
