5700 reachedWe are floating up on little volume. I believe qqq is a better chart for fibs and structure - so I show what I see there. VIX likely fills it's gap at 21.80 by the end of today. The close will probably stay bullish, but I think next week will be the start of a move down.
SPXM trade ideas

S&P 500 ChartSupport, Resistance, Trendlines.
Not a recommendation to buy or sell the market. For informational purposes only.

April 25 crypto and stock market results📈 April portfolio recap: $2,293 in profit despite market decline
Each month, I publish performance reports to stay accountable and track the real results of my trading strategies across both stock and crypto markets.
In this post, I’ll break down my April 2025 performance — where my portfolio grew, even as the broader market declined.
🏛️ Stock market results: $1,144 profit
Despite a red month for the broader market, my equity portfolio performed well:
• Monthly return: just above 1%
• S&P 500 performance: -44 basis points (−0.44%)
Outperforming the S&P 500 in a down month is never easy, but my holdings managed to stay in the green.
🪙 Crypto portfolio: $1,139 recovery
My crypto allocation also showed strength in April, largely thanks to my liquidity pool strategy, which is finally beginning to yield real results.
• Monthly crypto return: just over 6%
• By comparison, simply holding BTC would have yielded around 14%
While my strategy didn’t beat Bitcoin in raw percentage terms, it offered recovery after previous drawdowns.
📊 Portfolio Overview
• Cumulative profit: $10,000+
• Average portfolio return since inception: ~11.5%
I began investing in 2020, and have steadily built a portfolio that balances growth with risk control. My approach involves both active management (via options and selective equities) and passive yield strategies in DeFi.
🔍 What’s Next?
I’ll continue to post live trade updates, monthly recaps, and strategy breakdowns. If you’re interested in real portfolio transparency and real-time insights — follow along.

Bias still up but....Watch for a bear trap into the close today as a C wave. Vix could reverse before filling it's gap. Chances are we reach the Bollinger Band at 5710 but they could have another down move on the SPX before that occurs.

S&P500 INTRADAY ahead of NFP, resistance at 5670The bulls are firmly in control as the S&P 500 heads for its ninth straight daily gain—the longest winning streak since 2004. Optimism is fuelled by:
Expectations of Fed rate cuts due to soft economic data
Hopes for renewed US-China trade talks, easing geopolitical risk
Strong risk appetite, with Bitcoin nearing $100,000 and equity momentum building
Key Risk Today – US Jobs Report:
April Nonfarm Payrolls expected at +138K, down from March’s strong beat
This is the first major labor data since new US tariffs, and could shift market expectations for Fed policy
Conclusion for S&P 500 Traders:
Momentum is bullish, but today’s NFP report is a key risk event. A weaker-than-expected jobs number could reinforce rate cut bets and extend the rally. A surprise beat may trigger profit-taking.
Key Support and Resistance Levels
Resistance Level 1: 5670
Resistance Level 2: 5740
Resistance Level 3: 5820
Support Level 1: 5440
Support Level 2: 5385
Support Level 3: 5316
This communication is for informational purposes only and should not be viewed as any form of recommendation as to a particular course of action or as investment advice. It is not intended as an offer or solicitation for the purchase or sale of any financial instrument or as an official confirmation of any transaction. Opinions, estimates and assumptions expressed herein are made as of the date of this communication and are subject to change without notice. This communication has been prepared based upon information, including market prices, data and other information, believed to be reliable; however, Trade Nation does not warrant its completeness or accuracy. All market prices and market data contained in or attached to this communication are indicative and subject to change without notice.

S&P500 1st 4H Golden Cross since Jan could be a TRAP!S&P500 (SPX) completed yearly today its first Golden Cross on the 4H time-frame since January 23. That formation issued an immediate pull-back but technically it's not very similar to the today's as that was formed after an All Time High (ATH) while now we are on the recovery phase after March's massive Trade War fueled correction.
The 4H Golden Cross however that looks more similar to the current is the one before January's, the August 21 2024. That was formed after a substantial market pull-back, though again not as strong as March's. Still, the 1D RSI patterns are also more similar and that again should keep us on high alert as 2 weeks later the index pulled back to the 0.5 Fibonacci retracement level from its previous High Resistance.
As a result, if we see the price now turning sideways for a week or so, we will give higher probabilities for a short-term pull-back, maybe not as low as the 0.5 Fib but at least to the 5450 region, before the market takes off to 6000.
-------------------------------------------------------------------------------
** Please LIKE 👍, FOLLOW ✅, SHARE 🙌 and COMMENT ✍ if you enjoy this idea! Also share your ideas and charts in the comments section below! This is best way to keep it relevant, support us, keep the content here free and allow the idea to reach as many people as possible. **
-------------------------------------------------------------------------------
Disclosure: I am part of Trade Nation's Influencer program and receive a monthly fee for using their TradingView charts in my analysis.
💸💸💸💸💸💸
👇 👇 👇 👇 👇 👇

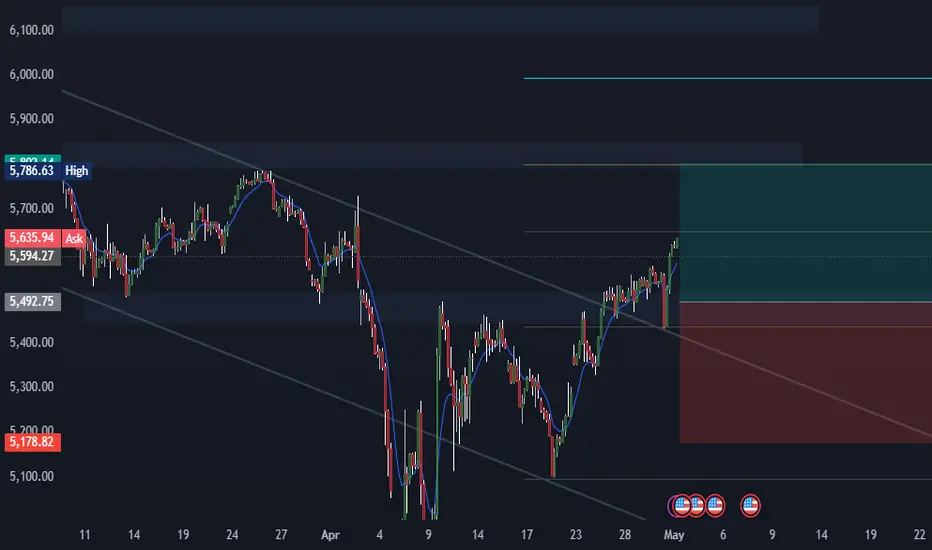
US500 Reversal Zone? My Thought Process Explained 🎯 📉 Earlier today I posted an analysis on the US500, highlighting how price has traded into a weekly bearish order block 🧱 — a key distribution zone where I believe smart money could look to unwind positions. The market is currently overextended and sitting at a premium, which raises the risk of a potential aggressive retrace 🔄, especially heading into the weekend. ⚠️
💭 Here's a video where I break down that exact setup and walk you through my full thought process, including why I’m exercising extreme caution at these levels and what I’m looking for in terms of confirmation.
📚 As always, this is for educational purposes only — not financial advice. 🚫💼

Major shift on the S&P 500: Is the bull market really over ?
After three years of almost uninterrupted gains, the U.S. market has finally shifted gears.
In early March, following a sharp escalation in trade tensions between China and the United States, the S&P 500 officially entered a bear market.
The tariff shock acted as a catalyst: buyers failed to defend critical levels, and the bullish momentum broke down.
Today, my scenario is clear:
I believe we are entering a wide range similar to what we saw in 2022, between 4700 and 5500 points.
In this controlled volatility environment, both investing and trading strategies must adapt.
💰 For long-term investing:
I'm staying fully in cash.
I prefer to wait until my personal indicator flashes green again before re-entering the market.
Patience is my best weapon in uncertain environments.
🎯 For swing trading:
The approach here is more active.
Each touch of the lower boundary (around 4700) will be considered a tactical buy, aiming to resell around 5500 points at the top of the range.
No rushing, no chasing moves: I only act at the extremes.

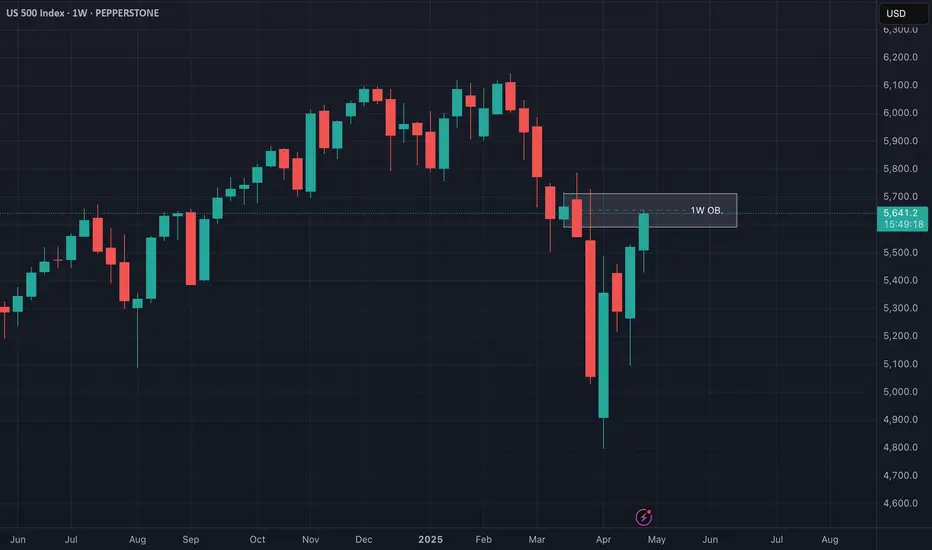
US500 at Critical Resistance - Weekly Chart Breakdown📊 US500 Weekly Chart Analysis
Taking a close look at the US500 on the weekly timeframe, we can see price has now traded directly into a bearish weekly order block 🧱 — a key distribution zone where smart money activity often emerges. At this level, the market is trading at a premium 💰 and appears to be overextended 📈.
⚠️ From a risk management standpoint, I’d advise extreme caution — the current conditions could set the stage for a sharp retracement, especially as we approach week’s end. This level aligns with areas where institutional players may look to offload risk or reverse exposure.
🔁 A potential pullback from here would not be surprising, given the elevated context and technical structure.
📚 This breakdown is for educational purposes only and should not be considered financial advice.
ChartChart of the SP 500. This is not a recommendation to buy or sell the market. Only for educational purposes.

Mixed signals in the MarketBoth the market and VIX are showing bullish and bearish signals. I try to explain what the possibilities are if we - rally higher, or sell down below 5550. Good luck

Today is oct 14th 1929 I have moved back to Long puts at 105%The chart posted was in the forecast written dec 8th 2024 We have now reached my targets of 5669 area I have been buying the dips in calls and made $ I am now 105 % long in the money puts and I do Not see a bottom until july once we break and a second bottom mid oct The market should see a drop of 38 % into july and form a small double bottom in oct at 41 % off the highs . I will move to 125 % long puts on a sell stop at 5300 even the math at 5334 is key Best of trades WAVETIMER

$SPX Resistance and Downward Momentum Resistance and Downward Momentum at the Top of the Gap, which is also the top of Friday’s Implied move.
I took 5645/5675 0dte bear call spreads, 1/4 width to start and so far so good.
Let’s see if we get the downward pull of todays trading range here.

US Markets on the Edge – Heavy Bloodshed Ahead!The charts are screaming caution!
SPX, Nasdaq, and major tech stocks are showing clear signs of exhaustion. We could be entering a heavy correction phase.
This is not the time to be greedy — protect your capital, manage risk, and tighten those stop losses.
Stay alert. Stay smart.
Massive moves are coming, and not everyone will survive them.

Short Pullback Bigger RallySPX Daily Chart
SPX has made two island reversals and gapped up.
There are two resistances near 5500 and 5700. Some short pull backs in this region.
Thereafter, a rally up to the earlier high of 6200.

Mechanical Over Mood. AlwaysWell, this week really wanted to test both my trading discipline… and my tech patience.
My laptop decided to kick the bucket mid-session.
But honestly? Not even mad.
Because it reminded me of something traders forget too often:
Simple is better. Mechanical is best.
No charts? No problem.
Noisy bias? Ignore it.
Just follow the system and let the setups do the work.
And right now?
The market gave us a Tag off the lower Bollinger Band…
Then a Turn with some clean bullish pulse bars…
Now we’re tagging the upper band again.
Textbook mechanical structure.
No predictions. No overlays. Just rules.
Yes, compression still lingers – the bands are squeezed tighter than my laptop battery casing.
But until something breaks out (or explodes), I’m trading it simple.
---
SPX Market View
Some days the market whispers.
Some days it screams.
And then… there are days like this – where it quietly tags, turns, and retags like a kid playing solo hide and seek.
Welcome to compression.
Welcome to Tag ‘n Turn 2: Return to the Band.
Yesterday gave us exactly what we needed:
Tag off the lower Bollinger Band
Bullish pulse bars firing in sequence
Now back to the upper BB as of this morning
It’s a full mechanical cycle playing out in slow motion.
The band width? Still squeezed.
So unless we get a confirmed breakout – no compounding, no fireworks, no fast lane.
That’s not a problem.
It’s a feature.
Why?
Because in environments like this, the strategy doesn’t just work – it filters the noise.
No guesswork. No hoping. No “is this the one?”
Just a defined setup, and a playbook that responds only when the price earns it.
I’m staying bullish as long as this range holds.
Pulse bars off the highs or lows? I’m in.
Breakout confirmed? Let’s ride it.
Dip to mid-band? Still valid.
The structure is intact.
The setup is valid.
And even if my laptop’s dying breath is a warning beep, I’ll still be trading off what matters.
Trade the system. Trust the sequence. Let the rest break down.
---
Expert Insights:
Mistake #1: Overcomplicating compressed conditions.
Compression doesn’t mean “do more” – it means “do less, better.”
Fix: Let the pulse bar do the talking. Keep your setup clean.
Mistake #2: Ignoring band re-tags as valid setups.
Returning to the upper or lower band doesn’t invalidate the prior move.
Fix: Use structure. Re-tags can still deliver if pulse bars confirm.
Mistake #3: Letting tech failures bleed into trading decisions.
Just because your screen flickers doesn’t mean your system broke.
Fix: Stay mechanical. Even from a mobile. It’s not the gear – it’s the method.
---
Rumour Has It…
Wall Street insiders are reporting that Apple’s next product will be the MacBook Trader, a laptop designed specifically to fail whenever Bollinger Bands compress.
Features include:
An auto-dimming screen whenever pulse bars form
A built-in “Hope Mode” that deletes your rulebook
And a random error that whispers “maybe just this once…”
Traders are advised to plug directly into their mechanical setups or, failing that, scribble strategies on a coffee-stained napkin like it’s 2002.
Rumour has it that a squirrel from Central Park is currently outperforming several hedge funds using nothing but broken Fibonacci tools and pure optimism.
This is entirely made-up satire. Probably!
Breaking scoops courtesy of the Financial Nuts Newswire-because who needs sanity?
---
Fun Fact – Did You Know?
The term “Frankenstein” originally came from Mary Shelley’s story of a scientist trying to control something he didn’t fully understand…
Which is what most traders do with indicators.
They bolt on RSI here, MACD there, sprinkle in some Fibonacci dust, and hope it walks.
But the real monsters aren’t the tools – they’re discretionary trades pretending to be mechanical.
Moral of the story?
You don’t need a stitched-together algo monster.
You just need a clean pulse bar, a set of rules, and the ability to sit still.

Bulls and Bears zone for 05-01-2025S&P 500 is going to have a gap up Open and finally closing gap from early last month.
Also traders could be taking profit after yesterday's big UP move.
Level to watch: 5643 ---5645
Reports to watch:
US : PMI Manufacturing Final 945am
US : ISM Manufacturing Index 1000am
US : Construction Spending 1000am

A pullback is expectedA pullback is expected but a rally into the open first looks probable. If the pullback looks strong, it could be a C wave down with another move to 5700+ after.

S&P500 INTRADAY resistance at 5670Tech Surge Lifts Markets:
Strong earnings from Microsoft (+7.8%) and Meta (+6.2%) are driving early market optimism. Both beat revenue expectations, easing concerns about trade war impacts.
→ S&P 500 futures up over 1%.
Trade Deal Hopes:
Sentiment is boosted by signs that President Trump may soon announce initial trade agreements, reducing geopolitical risk.
Bank of Japan Dovish Shift:
The BoJ cut its growth forecast and delayed its inflation target, signaling caution.
Yen fell as much as 1.2%.
US-Ukraine Investment Deal:
The US secured privileged access to Ukraine’s natural resources, potentially helping ease tensions as part of broader efforts to end the war.
Earnings Watch:
Before Open: Mastercard, Estee Lauder, Eli Lilly, Moderna, McDonald’s
After Close: Apple, Amazon, Amgen, Airbnb, Reddit
Key Support and Resistance Levels
Resistance Level 1: 5670
Resistance Level 2: 5740
Resistance Level 3: 5820
Support Level 1: 5440
Support Level 2: 5385
Support Level 3: 5316
This communication is for informational purposes only and should not be viewed as any form of recommendation as to a particular course of action or as investment advice. It is not intended as an offer or solicitation for the purchase or sale of any financial instrument or as an official confirmation of any transaction. Opinions, estimates and assumptions expressed herein are made as of the date of this communication and are subject to change without notice. This communication has been prepared based upon information, including market prices, data and other information, believed to be reliable; however, Trade Nation does not warrant its completeness or accuracy. All market prices and market data contained in or attached to this communication are indicative and subject to change without notice.

SPX Play-by-Play: From Trap to Trend and Back AgainJust price, structure, and volume — tracked in real time.
🧠 Chart Breakdown:
✅ Early Short Trap / Failed Breakdown — Sellers tried to press lower early, but price held key levels and reversed. That shift became the foundation for the entire move that followed.
✅ Breakout Long Trigger — After reclaiming structure, price drove into new highs with strong follow-through. Volume confirmed the breakout.
⛔ Top Rejection — Price pushed into resistance but couldn’t hold. Momentum faded, candles hesitated, and sellers stepped in.
✅ Fib-Based Bounce — After the pullback, price responded cleanly off fib-based support. The bounce was sharp, and volume backed it.
✅ Steady Uptrend Structure — Price moved in an orderly fashion. Small pullbacks held structure, and volume stayed supportive — a textbook controlled climb.
⛔ Range Resistance — Price returned to a previously rejected zone. Wicks and hesitation reappeared.
👀 Current Breakout Watch — Price is testing that resistance again. A reclaim with strength signals continuation. Another fade? Let it go.
Always happy to be helpful.

S&P 500 - Sell in May, return anther day. The truth - 2025No doubt everyone has heard a variation of the phrase:
“Sell in May, return another day.”
In Wikipedia it is written:
“Sell in May and go away is an investment strategy for stocks based on a theory (sometimes known as the Halloween indicator) that the period from November to April inclusive has significantly stronger stock market growth on average than the other months. In such strategies, stock holdings are sold or minimised at about the start of May and the proceeds held in cash”
A public comment from last year:
“Over 100 years ago, the (practical) reason to sell in May and September, was to pay seasonal workers to seed the field (May) and to harvest (September). Caravans of landlords and farm owners went to New York to sell stocks and withdrew money from the banks to do payrolls
so for people without agricultural business, i'll say it's okay to hold in May”
If we are to take all this at face value then we should be unwinding our long term positions until the Autumn?
What does the chart say?
On the above monthly chart of the S&P 500 each vertical line marks the month of May going back to 2012. That is a dataset of 13 points.
The facts:
1) From the month of May onwards, 11 from 13 periods returned positive price action of not less than 10%. Selling in May was a bad choice.
2) 2015 and 2022 saw corrections of 15% from May onwards. However in both examples the correction was erased within 12 months as the index continued the uptrend.
In summary, 86% of the time a minimum return of 10% was seen before the year end. Amazing odds.
Furthermore, corrections up and until the end of April (like we’re now seeing) represented some of the best long opportunities.
Sell in May go away? I suggest it should be: Buy in June and watch it boom!
Ww

SPX ready for the correctionhi traders,
This is probably not what most traders want to see but we must be realistic.
The monthly close is upon us and it's not gonna be a bullish close.
A lot of selling pressure and it may be just the beginning.
A 13 % correction on SPX is more than likely in my opinion.
If the price loses the upsloping support, we will see the mark-down pretty soon.
Stoch RSI suggests that the bears are taking control.
My target for SPX is between 5200 and 5000.
Get ready to buy cheap stocks and cheap crypto!

SPX long ideaBreakout of descending channel price retested and rejected most previous structure and aligns with 38. fib level on daily.
Targeting 27.2 level first.
Opinions?