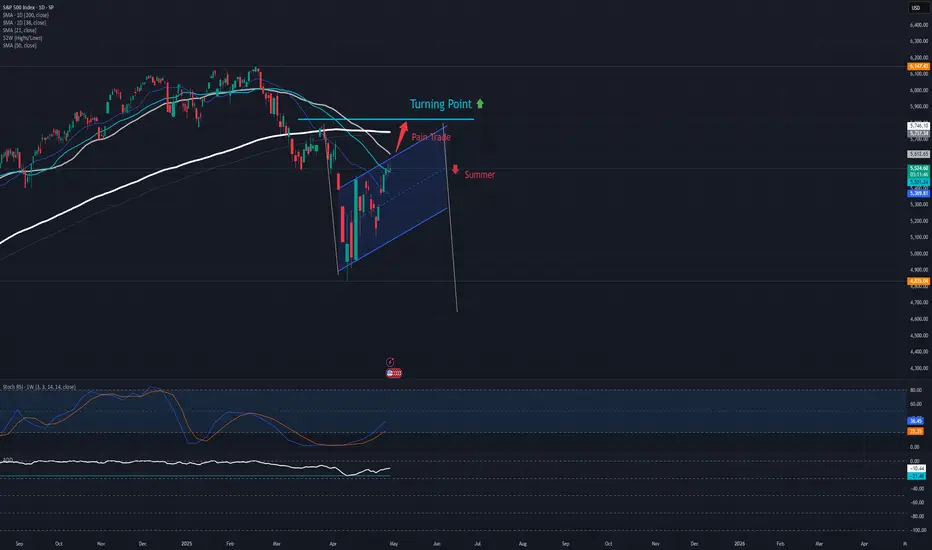
S&P 500 unlikely to return to up trendThe implemented tariff policy of the Trump Administration is expected to hit its fallout on the market by Q3 2025, consequentially the earnings of companies. If the SPX is to have a chance to return to the uptrend this year, it has to confirm two days closings above the turning point before summer.
The inverse effect of tariffs is that it soars with the price: any attempt to adapt on the net price point levers the total price; it's not a fixed number. This leverage applies also to inflation, resulting in consumer sentiment to sour. There is a natural time gap between the implementation of tariffs and the return of industry expected by the Trump Administration - the tariffs have been falling like a chainsaw on international business and supply relations, but rebuilding factories requires time and investment. In this gap the required investments will add pressure to companies' earnings...
These news and outlook brings out funds managers to sell America 'bigly' and to re-evaluate their diversification, bringing down stock prices eventually. The tariff-rebuild-gap is expected to set in by summer, but it is unclear when it would end: so far it is uncertain how much of the industry would return to America to produce and circumvent tariffs. A few big companies announced to build manufactories in the USA, but mostly they plan for only one factory and it still requires building. The Midterm Elections could set the Republican super-majority in both houses to fall and, by extension, have Congress retake the right to set and lift tariffs from the White House. However, it is unclear whether they would use their retaken privilege, as one truth about tariffs, like about all taxes: they're easily introduced, but can take generations to go away again.
All this forms a painstaking 2H scenario for 2025, its rock-bottom too early to call.
SPXM trade ideas
MACD says a little higher for a little longerAs per the individual stocks I cover that have not yet reached their ideal retracement areas I am looking for the SPX to get higher into my target box. In any event it's reasonable for me to say we're in a B wave and therefore our pattern can develop into something more complex. Nonetheless, I am mainly looking for MACD to reach the zero line at the very minimum.
The take-a-way from this update is I am looking slightly higher in the markets for slightly longer...before our minor C wave takes hold of the market.
Best to all.
Chris

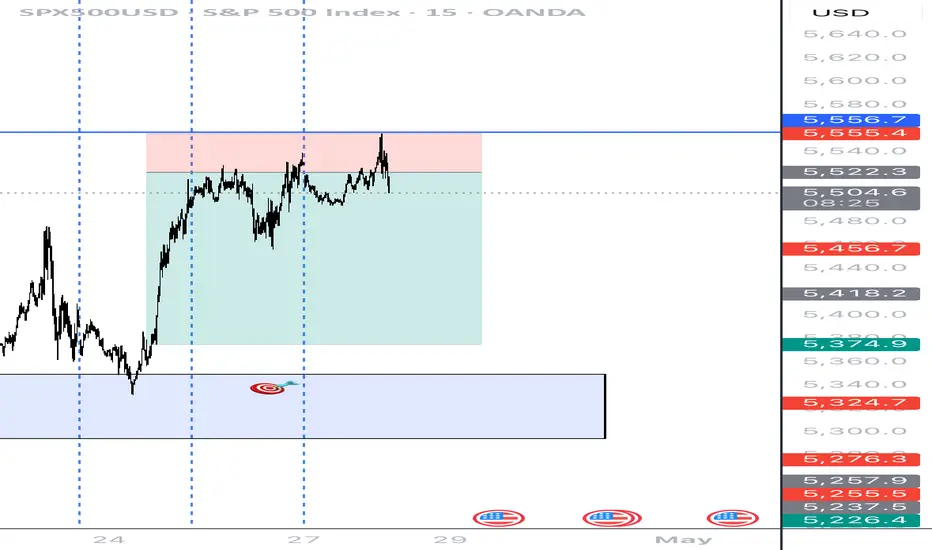
Grab Some Points To Upside In SPX/USD $$$Hey fellow traders and followers!
How go's the profits so far? Market movin & groovin to the beat of the Orange drum.
I'm here to help if you are having any troubles or confusion with SPX. Let's have a quick look.
We have a V pattern in the 1hr chart so let's trade this baby!
Breakline is 5530.3 so we wait to see a break above before getting long. Pattern support is around 5510, a break below that price area would likely cancel out the bullishness of this pattern so keep eyes on that. Daily low support sits around 5484.9. A break below that support spells a short down for 29 points. A break above the breakline is a long good for around 29 points. RSI is 55.77 (Bulla). Easy money if the V gets flyin $$$.
Don't listen to any news or rumors, listen to your charts. Wait! Did you hear that? Your 1hr chart is whispering something about easy money if you pay close attention to the numbers and the rules laid out within.
Hey! best of luck in all your trades people ! Wishing all of you prosperous trades. $$$

Believe or Not- Blue SeasonBefore Donald Trump gets credit based on tariff's or anything like that I wanted to share the future of SPX 500 with everyone. It's definitely about to explode to a new all time high. Watch and learn. Market 101- Let's go USA!

Getting closeWe're getting close to a top, but I still think 5600 will likely be attempted today or tomorrow. I will change my mind if they start getting under 5450. Vix broke out of a wedge, which is bullish for the vix but I don't think it runs up right away. I will change my mind if they get the vix over 28 again.

S&P500 repeating the 2019 recovery-Can hit 7000.The S&P500 index (SPX) is making a remarkable recovery as it completed yet another strong 1W green candle last week following the rebound on its Higher Lows Zone, near the 1W MA200 (orange trend-line).
This is a mirror price action with the last 1W MA200 rebound of the 2016 - 2019 Bullish Megaphone pattern, which not only recovered its previous All Time High (ATH) but also peaked on the 1.618 Fibonacci extension before the eventual 2020 COVID crash.
As a result, we believe that a 7000 Target is a very plausible one on the long-term.
-------------------------------------------------------------------------------
** Please LIKE 👍, FOLLOW ✅, SHARE 🙌 and COMMENT ✍ if you enjoy this idea! Also share your ideas and charts in the comments section below! This is best way to keep it relevant, support us, keep the content here free and allow the idea to reach as many people as possible. **
-------------------------------------------------------------------------------
Disclosure: I am part of Trade Nation's Influencer program and receive a monthly fee for using their TradingView charts in my analysis.
💸💸💸💸💸💸
👇 👇 👇 👇 👇 👇

SPX500: Short Setup Brewing!SPX500 is currently consolidating above the key volume node at 5,480.85, showing resilience after a sharp pullback last week. Price action remains inside a rising channel, but the steeper trendline has been broken, hinting at possible loss of momentum.
🔹 Key Observations:
Price is testing the lower trendline support—a breakdown here could trigger a move toward 5,400.
Volume profile shows heavy interest at 5,480, with a potential volume gap below that could accelerate downside.
VWAP support is intact for now, supporting a neutral-to-bullish bias.
A breakout above 5,530 would confirm bullish continuation and likely test 5,560+.
📈 Bias: Neutral to Bullish
📉 Breakdown Trigger: Below 5,480
📊 Probability Estimates:
Bullish breakout: 55%
Bearish breakdown: 45%
Watching closely for resolution at this inflection point. Patience until direction confirms.
💬 What’s your bias—bulls or bears?
#SPX500 #ES1 #S&P500 #VolumeProfile #TechnicalAnalysis #FOMC #VWAP #TrendlineBreak

S&P500 INTRADAY resistance at 5510Earnings season heats up with major companies like Visa, Coca-Cola, Starbucks, UPS, and Pfizer reporting results. In Europe, HSBC announced a $3 billion share buyback, while BP shares dropped due to weaker cash flow.
In Canada, the Liberal Party is set to win a fourth term, but likely without a majority, which could lead to a coalition-style government.
Meanwhile, the Trump administration plans to ease auto tariffs on foreign parts used in U.S.-made vehicles, boosting Ford and GM shares in premarket trading.
Market Impact:
Watch for shifts in trade-sensitive sectors, supply chain plays (especially in tech), and defense stocks as geopolitical risk evolves.
Key Support and Resistance Levels
Resistance Level 1: 5670
Resistance Level 2: 5740
Resistance Level 3: 5820
Support Level 1: 5380
Support Level 2: 5310
Support Level 3: 5236
This communication is for informational purposes only and should not be viewed as any form of recommendation as to a particular course of action or as investment advice. It is not intended as an offer or solicitation for the purchase or sale of any financial instrument or as an official confirmation of any transaction. Opinions, estimates and assumptions expressed herein are made as of the date of this communication and are subject to change without notice. This communication has been prepared based upon information, including market prices, data and other information, believed to be reliable; however, Trade Nation does not warrant its completeness or accuracy. All market prices and market data contained in or attached to this communication are indicative and subject to change without notice.

SPX500 (4H) LONG POSITIONGreeting there traders this is my idea on SP500 and it is Long.
We can clearly see a recovery from the “Support Area” (yellow zone), after a wave formation (probably a completed Elliott Wave correction).
You are currently in a very impulsive uptrend.
Momentum looks strong, with no major retracements — meaning that buyers would currently be in a dominating position.
Key Levels
Support Level (red): 5.019 – 5.091
This is the “ultima ratio” zone where the price made a strong rebound.
Softer Support: 5.276 – 5.282 (where you are now)
This is the zone of possible correction, as you marked.
Resistance/Target: 6.150 – 6.156
If the current trend holds and there is no major retracement below 5,250, it is very likely that we will test the 6,000–6,150 level in the coming days.
The price is currently in a “blast-off” phase — if volume remains strong, you can hit the TP as early as late April or early May.
I predict that we have started an uptrend towards a new ATH. I believe that the market will start to "fly" already on Monday or Tuesday. Possible catalysts: Trump strikes a deal with China, announces a pause in the trade war, or Powell responds with an emergency rate cut.
My goal is mid $6,000 to low $7,000 by July 4th (maybe sooner). After that I expect a 60-70% drop.

SPX500 H4 | Potential bullish bounceSPX500 could fall towards an overlap support and potentially bounce off this level to climb higher.
Buy entry is at 5,546.94 which is an overlap support.
Stop loss is at 5,440.00 which is a level that lies underneath an overlap support.
Take profit is at 5,789.71 which is a swing-high resistance.
High Risk Investment Warning
Trading Forex/CFDs on margin carries a high level of risk and may not be suitable for all investors. Leverage can work against you.
Stratos Markets Limited (tradu.com):
CFDs are complex instruments and come with a high risk of losing money rapidly due to leverage. 63% of retail investor accounts lose money when trading CFDs with this provider. You should consider whether you understand how CFDs work and whether you can afford to take the high risk of losing your money.
Stratos Europe Ltd (tradu.com):
CFDs are complex instruments and come with a high risk of losing money rapidly due to leverage. 63% of retail investor accounts lose money when trading CFDs with this provider. You should consider whether you understand how CFDs work and whether you can afford to take the high risk of losing your money.
Stratos Global LLC (tradu.com):
Losses can exceed deposits.
Please be advised that the information presented on TradingView is provided to Tradu (‘Company’, ‘we’) by a third-party provider (‘TFA Global Pte Ltd’). Please be reminded that you are solely responsible for the trading decisions on your account. There is a very high degree of risk involved in trading. Any information and/or content is intended entirely for research, educational and informational purposes only and does not constitute investment or consultation advice or investment strategy. The information is not tailored to the investment needs of any specific person and therefore does not involve a consideration of any of the investment objectives, financial situation or needs of any viewer that may receive it. Kindly also note that past performance is not a reliable indicator of future results. Actual results may differ materially from those anticipated in forward-looking or past performance statements. We assume no liability as to the accuracy or completeness of any of the information and/or content provided herein and the Company cannot be held responsible for any omission, mistake nor for any loss or damage including without limitation to any loss of profit which may arise from reliance on any information supplied by TFA Global Pte Ltd.
The speaker(s) is neither an employee, agent nor representative of Tradu and is therefore acting independently. The opinions given are their own, constitute general market commentary, and do not constitute the opinion or advice of Tradu or any form of personal or investment advice. Tradu neither endorses nor guarantees offerings of third-party speakers, nor is Tradu responsible for the content, veracity or opinions of third-party speakers, presenters or participants.

Trading the Impulse Rally Retracement — Price and Time Symmetry Fundamental —
Trend is observed from an impulse run’s lowest/highest point and projected outwards in symmetrical fibonacci retracement via price/time from the first reversal candle to the end of the rally, creating crosshairs. These ‘crosshairs’ visually represent the trending ‘price distribution projection’ in price/time symmetry.
Using this concept, I draw a ‘projection trend line’ from the bottom or top of the impulse run thru the projected 78.6% price/time retracement value, to identify the price distribution structure in a linear form.
Now to introduce my STOP LOSS TRIANGLE.
This is a concept of decaying price and time as an underlying move towards our theoretical projection, where if the underlying enters our built faded cross-section, the SL is triggered to avoid sideways consolidation and decaying contract premiums.
This ‘right’ triangle that is ‘sclene’ by nature is created by taking the furthest projection in price/time symmetry (78.6%) and drawing a vertically placed straight line to the highest/lowest point in the rally previously identified. Here, I create a ‘right triangle’ by turning 90 degrees towards my final point, which is made by the nearest projection in price/time symmetry (38.2%). In its entirety, this forms the stop loss triangle

Bull in a China Shop. The S&P 500 Index After 100 Days of TrumpPresident Donald Trump's first 100 days in office were the worst for the stock market in any postwar four-year U.S. presidential cycle since the 1970s.
The S&P 500's 7.9% drop from Trump's inauguration on Jan. 20 to the close on April 25 is the second-worst first 100 days since President Richard Nixon's second term.
Nixon, after taking office as President of the United States (for the second time) on January 20, 1973, witnessed the S&P 500 index fall by 9.9% in his first 100 days in office, due to the unsuccessful economic measures he took to combat inflation, which led to the recession of 1973-1975 when the S&P 500 index losses of nearly to 50 percent.
It all started in January 1973 in the best soap opera traditions of Wall Street, at the historical peaks of the S&P 500 index..
..But less than two years later it quickly grew into a Western with a good dose of Horror, because the scenario of a 2-fold reduction of the S&P 500 index was unheard those times for financial tycoons and ordinary onlookers on the street, since the Great Depression of the 1930s, that is, for the entire post-war time span since World War II ended, or almost for forty years.
Nixon later resigned in 1974 amid the Watergate scandal.
On average, the S&P 500 rises 2.1% in the first 100 days of any president's term, according to CFRA, based on data from election years 1944 through 2020.
The severity of the stock market slide early in Trump's presidency stands in stark contrast to the initial "The Future is Bright as Never" euphoria following his election victory in November, when the S&P 500 jumped to all-time highs on the belief that Mr. Trump would shake off the clouds, end the war in Ukraine overnight, and deliver long-awaited tax cuts and deregulation.
Growth slowed and then, alas, plummeted as Trump used his first days in office to push other campaign promises that investors took less seriously, notably an aggressive approach to trade that many fear will fuel inflation and push the U.S. into recession.
The S&P 500 fell sharply in April, losing 10% in just two days and briefly entering a bear market after Trump announced “reciprocal” tariffs, amid a national emergency that gave him free rein to push through tariffs without congressional oversight.
Then Trump began yanking the tariff switch back and forth, reversing part of that tariff decision and giving countries a 90-day window to renegotiate, calming some investor fears.
Many fear more downside is ahead.
Everyone is looking for a bottom. But it could just be a bear market rally, a short-term bounce of sorts.
And it's not certain that we're out of the woods yet, given the lack of clarity and ongoing uncertainty in Washington.
Time will tell only...
--
Best 'China shop' wishes,
@PandorraResearch Team

Economy - Moving ForwardWhat's expected of the economy?
For 2025, the stock market started strong, the three major U.S. indexes soared to its all-time highs, putting confidence in retail investors.
End of Q1, we've seen a shift in the market due to tariffs and the start of a trade war. Why are the tariffs bad for the U.S. economy?
The biggest problem with tariffs is that it could drive higher prices in consumer goods through "taxes" in imported goods. It also causes disruption in supply chain, slower economic growth, retaliation from foreign countries, etc. The economic data also shows signs of a possible recession.
Not everything is lost.
Asian countries such as Japan, Korea, and Indian are taking in the lead in trade talks with Donald Trump. China has given exemptions to certain U.S. goods in order to ease the trade war, leading to a potential trade talks with the economy giants, the U.S. The 90 day reciprocal tariffs are also an opening for talks.
Let's see how it goes.

S&P500: Buying accelerating as the bottom is confirmed.S&P500 is neutral on its 1D technical outlook (RSI = 52.628, MACD = -41.490, ADX = 32.588) as it has been volatile during the day but on the long-term, it has resumed the bullish trend, making a strong recovery last week. The bottom is now confirmed (above the 1W MA200) and as the oversold 1W RSI was bought, the index eyes a +28.50% rise on the medium term, same as in early 2024. This falls practically on the previous ATH level (TP = 6,150).
## If you like our free content follow our profile to get more daily ideas. ##
## Comments and likes are greatly appreciated. ##

Bearish drop?S&P500 is reacting off the resistance level which is an overlap resistance and could drop from this level to our take profit.
Entry: 5,510.94
Why we like it:
There is an overlap resistance level.
Stop loss: 5,665.52
Why we like it:
There is a pullback resistance.
Take profit: 5,324.97
Why we like it:
There is an overlap support level that lines up with the 50% Fibonacci retracement.
Enjoying your TradingView experience? Review us!
Please be advised that the information presented on TradingView is provided to Vantage (‘Vantage Global Limited’, ‘we’) by a third-party provider (‘Everest Fortune Group’). Please be reminded that you are solely responsible for the trading decisions on your account. There is a very high degree of risk involved in trading. Any information and/or content is intended entirely for research, educational and informational purposes only and does not constitute investment or consultation advice or investment strategy. The information is not tailored to the investment needs of any specific person and therefore does not involve a consideration of any of the investment objectives, financial situation or needs of any viewer that may receive it. Kindly also note that past performance is not a reliable indicator of future results. Actual results may differ materially from those anticipated in forward-looking or past performance statements. We assume no liability as to the accuracy or completeness of any of the information and/or content provided herein and the Company cannot be held responsible for any omission, mistake nor for any loss or damage including without limitation to any loss of profit which may arise from reliance on any information supplied by Everest Fortune Group.

S&P 500 Rips Into Resistance- Bulls on NoticeThe S&P 500 has rallied more than 15.6% off the lows with the bull now testing confluent resistance at 5531/43 - a region defined by the 78.6% retracement of the monthly range and the April high-day close. Note that a three-point resistance slope converges on this threshold and the immediate advance may be vulnerable while below.
Initial support rests with the 4/22 reversal close at 5285 - losses below this threshold would threaten another bout of selling towards the yearly low-day close (LDC) near 5061 .
A topside breach / close above this hurdle exposes the monthly open at 5600 and the 61.8% retracement of the decline off the record highs at 5634 - look for a larger reaction there IF reached.
Bottom line : The index is testing resistance here- losses would need to be limited to 5285 IF price is heading higher on this stretch with a close above 5434 needed to clear the way for the next leg of the advance.
-MB

Long @ 5400Today price pushed to SR zone and rejected. Potential daily chart trendline + smaller set of daily fibs show that price could pullback to around 5400 before making another attempt at todays high.

SPX 500 turns lower ahead of busy weekAhead of a busy week, the S&P 500 has found resistance at a key area of resistance near 5550. The Index had rallied in the previous three sessions, but with trade and economic uncertainty still at the forefront, investors are not rushing to chase this rally - and rightly so. May be they will still buy the dip as we head deeper into the week, though, given Trump's change of tone and optimism surrounding trade deals. For me the key support area to watch is around 5,300, but other areas of support including 5840 and 5400.
Beyond trade negotiations and trade concerns, a flood of traditional economic data is set to be released this week. Key highlights include PMI surveys from China and the US, first-quarter US GDP, the Bank of Japan’s policy meeting on Thursday, and the critical US nonfarm payrolls report on Friday. On top of all that, it’s the biggest week of earnings season, featuring results from Microsoft and Meta after Wednesday’s close, and from Apple and Amazon—four members of the so-called “Magnificent Seven”—reporting on Thursday.
By Fawad Razaqzada, market analyst with FOREX.com

S&P 500 correction before the global fall.S&P 500 correction before the global fall of the usa stock market.
Hey traders! I’m sure many of you have noticed that after the introduction of retaliatory tariffs, the markets started getting pretty choppy.
The S&P 500 took a serious dive.
• On the weekly chart, I’ve marked a support level + the 161.8% Fibonacci level, where we might see a bounce back to the $5680–$5800 range.
• But from there, I think we could see the start of a major crash—both in equities and crypto—that could last 1–2 years.
• Based on my estimates, the S&P 500 could drop back to 2020–2021 levels, a wide range of 2200–3000.
• For Bitcoin, we’re talking around $5000; for Ethereum, $100–$300; and for Solana, $2–$12.
3D Chart:
3W Chart:
Real-world events that could tank the stock market this hard:
Global Recession: If major economies (US, China, EU) slide into a recession at the same time—think trade wars, rampant inflation, or a debt crisis—investors will dump risky assets like hot potatoes.
Trade War Escalation: Harsher tariffs between the US and China/EU could wreck supply chains, crush corporate earnings, and spark a full-on market panic.
Geopolitical Conflict: A big blow-up—like a full-scale war or crisis (say, Taiwan or the Middle East)—could send capital fleeing to safe havens (gold, bonds), while stocks and crypto get slaughtered.
Collapse of a Major Financial Player: If a big bank or hedge fund goes bust (Lehman Brothers 2.0-style) due to an overheated market or bad debt, it could trigger a domino effect.
Energy Crisis: A spike in oil/gas prices (from sanctions or conflicts, for example) could kneecap the economy and drag risk assets down with it.
Market Bubble Burst: If the current rally turns out to be a massive bubble (and plenty of folks think it is), its pop could pull indexes down all on its own.
Looming Wars: A potential Russia-Europe war starting as early as 2025, or an Iran-Israel conflict that drags in multiple nations, could destabilize global markets, spike energy prices, and send investors running for the exits.

Bears entering the market Bulls met a lot of resistance today. On the day chart we filled a big FVG. My guess is that bears would try to take this to down to fill the gap around 5345.
S&P 500 ,,, Update chartTrending possibility
As I mentioned in a previous analysis, the chart reacted to a strong support zone with a significant bullish candle, indicating an emotional response. This was followed by a small correction. One encouraging sign suggesting a potential move into the green zone is the considerable buying volume observed at the support level, potentially signaling the end of this correction.
According to my strategy, identifying a new uptrend involves breaking a descending trend line and moving decisively above a major level, such as 5500 on this chart. Therefore, if a strong bullish candle forms and closes above this key level, I will consider initiating new long positions.
It's crucial to remember that consistent success in this market relies on having a clear strategy and adhering to it diligently.
Good luck.

April 28, 2025 - Broken Supply Chains, and the DC CircusHello everyone, it’s April 28, 2025. The week ahead promises to be spectacular (or a complete disaster) depending on which way the wind blows out of Washington. So far, the futures are down about 0.6% this morning, as everyone’s trying to cut risk ahead of a week crammed with Big Tech earnings ( NASDAQ:AAPL , NASDAQ:MSFT , NASDAQ:AMZN , NASDAQ:META ), a mountain of macro data (PCE, GDP, ISM, jobs), and of course, the never-ending Trump tariff soap opera.
On the US politics front, Trump stayed uncharacteristically quiet over the weekend, no new bombshells. But whispers about “talks” with China surfaced, without any real confirmation. Meanwhile, several countries are supposedly rushing to negotiate tariff deals with the US. Expect headlines (and chaos) throughout the week.
Supply chains are starting to crack. Container traffic from China to the US has plunged 60%, and if deals aren’t made by mid-May, we could be staring down empty shelves and layoffs in transport and retail sectors. Think “Black Friday” without anything to buy.
Meanwhile, the drama at the Fed continues. Kevin Warsh, still salty about not replacing Powell, attacked the Fed’s “media circus” style, blaming it for post-Covid inflation. Warsh wants the Fed to go old-school: shut up, protect the dollar, and stop playing superhero. No forecasts, no endless press conferences. Just cigars and silence.
On the macro side, this week’s economic data could turn into a horror show: weak jobs numbers, soft GDP, slowing PCE, all raising the probability of recession. If that happens, expect markets to start begging the Fed to cut rates sooner rather than later.
Assets snapshot:
• BLACKBULL:WTI : $63.36
• OANDA:XAUUSD : $3,307
• INDEX:BTCUSD : $94,000
In short: expect maximum volatility, endless surprises from DC, and a market that could spin on a dime. Stay sharp, stay skeptical, and brace for anything.

sp500A strong entry of buyers into the area. We will wait for it to return to the area we specified. Therefore, we are waiting for the price to come to an area, but if it does not come, we are not surprised because we expected a rise without a correction.
