SPX: hard way upThe S&P 500 index tried very hard to sustain a bit of market optimism, however, it ended the trading week at almost the same level, where it started it. Monday was a positive day, where the index managed to open higher from Friday's close, reaching 5.450, however, through the rest of the week, it was traded with a negative sentiment. Thursday closed at the level of 5.282. Friday was a non-working day on Western markets, due to the Easter holiday. It will be closed also on Monday, which might be treated as a positive, considering current sentiment.
Regardless of a drop in the value of the index, the stocks were traded in a mixed manner. Market favourite Nvidia gained almost 3%, supported by its business plan for the next period, increasing their projections for exports to China. This was positive, considering the uncertainties related to trade tariffs between the US and China. Elly-Lilly, a drug maker, gained almost 14%, after posting positive results on a trial of its weight-loss drug.
Generally, US companies continue to provide relatively positive results, considering the ongoing uncertainties related to trade tariffs. The another topic which is bringing uncertainty in investors is a pressure from the US Administration on Fed to cut interest rates. Fed Chair Powell, noted during a speech that tariffs implemented by the US Administration could drive up inflation higher, which is certainly something that the market is not at all happy to hear at these sensitive moments. Increased inflation would imply that the Fed will not be in the position to cut interest rates, as planned, during the course of this year. So, regardless of positive results that US companies are still managing to post, still, the inflation fears are the most critical moment for investors, which continues to drive their sentiment for investments.
SPXM trade ideas

Big Tech Lines Up for Earnings Season: What Traders Should KnowPeak earnings season is right around the corner — the next two weeks are for the geeks with tech giants slated to report their quarterly financials all the while traders and investors weigh concerns over tariffs, trade wars, and export controls.
On tap to offload first-quarter earnings updates this week are Tesla NASDAQ:TSLA (Tuesday) and Google parent Alphabet NASDAQ:GOOGL (Thursday).
We’ll get more of the tech elite next week — Meta NASDAQ:META and Microsoft NASDAQ:MSFT deliver next Wednesday and Amazon NASDAQ:AMZN and Apple NASDAQ:AAPL report Thursday. Nvidia NASDAQ:NVDA reports late in May.
Let’s talk about that.
Welcome to earnings season, aka that rush hour of the quarter when traders hit refresh on the earnings calendar , their watchlists, and cortisol levels.
Once again, it's Big Tech in the spotlight — specifically the Magnificent Seven club, a pack of tech heavy hitters who spent the past year building the future of artificial intelligence only to be the first out the door this year when investors dumped risk in the face of looming global uncertainty.
Now, with Tesla and Alphabet kicking off what could be a market-moving series of updates, the real question isn’t just who beat the numbers — but who can still tell a good story in the face of tariffs, competition, and AI-fueled capex that’s starting to look like Monopoly money.
👜 The Setup: Seven Stocks, Seven Bags to Hold
The Magnificent Seven — Tesla, Apple, Amazon, Microsoft, Meta, Alphabet, and Nvidia — aren’t just the tech elite. They’ve been the main engine of the market for the last few years. But in 2025, the wheels have come off.
These technology mainstays, towering over the growth sector, have shed hundreds of billions and are now nursing double-digit percentage losses. Each. One. Of. Them. The growth space, valued more on prospects of bright performance rather than current showing, has been hit hard this year. How hard? That hard:
Tesla NASDAQ:TSLA is down 36%
Nvidia NASDAQ:NVDA is down 27%
Amazon NASDAQ:AMZN is down 21%
Alphabet NASDAQ:GOOGL is down 20%
Apple NASDAQ:AAPL is down 19%
Meta NASDAQ:META is down 16%
Microsoft NASDAQ:MSFT is down 12%
On the outside, we all know what’s dragging stocks — it’s the widespread tariff jitters fanning recession fears and triggering waves of capital outflows. But on the inside, these tech giants are deep into a spending spree, and paring back that guidance might be too late.
AI spending is now at fever pitch, having gone from “impressive” to “uh… should we be concerned?” And that’s what investors will be watching when these masters of technology report quarterly numbers.
Besides the usual revenue figures, earnings per share and (likely timid) guidance, capital expenditures will draw a ton of attention. Capital expenditures, or capex, is the amount of money a company allocates for investments in new stuff like hardware and software and that may include beefing up existing infrastructure.
Injecting AI into systems and operations is top focus right now and Big Tech has decided to be generous and pony up some big money for it. Here’s what this year’s capex looks like, as per prior guidance:
Microsoft has allocated $80 billion
Alphabet has set aside $75 billion
Amazon? $100 billion ready to roll
Zuck’s Meta is in with up to $65 billion
The rest of the Mag 7 haven’t put out official capex projections but no one is sleeping on the opportunity.
Let’s go around the room and see what each of these is dealing with right now.
🚗 Tesla: A Look Under the Hood
Tesla reports first, and traders are bracing for either redemption — or another reason to panic sell.
On the surface, it’s not pretty: EV demand is sagging, especially in China and Europe. Musk’s political disruption and proximity to Trump aren’t helping the optics. And with shares already down 36% this year, the company enters this earnings call with bruises and baggage.
Revenue is expected to come in at $21.2 billion, down 1%, while earnings are projected to drop 8% to $0.42. Tesla delivered 336,681 cars in Q4 , a 14% drop from the same time a year ago.
🌎 Alphabet: Quiet Strength, But Still on Watch
Alphabet is expected to deliver solid results — $89.2 billion in revenue, up 11%, and $2.01 in earnings per share, up 6.3% from last year. Among the Mag 7, it’s one of the best-positioned players to weather trade volatility, thanks to its size, diverse revenue streams, and sheer dominance in advertising and cloud computing.
Its Gemini AI model is heating up the race against ChatGPT and Copilot, and its cloud division is quietly chipping away at AWS and Azure’s lead.
That said, traders will still be watching for any signs of slowdown in digital ad spending—a canary in the coal mine if the economy starts to sputter under tariffs and tightening global conditions.
💻 Amazon and Apple: The Slow Burners
Amazon, with its big-ticket spending on AI, is playing the long game — mostly through AWS, the company’s main driver of profitability. It's aggressive, even by Big Tech standards. The problem? AWS margins are under pressure, and retail is facing the squeeze from cautious consumers.
Amazon needs to prove it can turn AI into revenue, not just headlines. Amazon’s sales and earnings per share are projected to grow 8.16% and 38.7% respectively.
Apple, meanwhile, is in the risky position of relying a bit too much on China for its products — it ships about 90% of its iPhone from Asia’s biggest economy.
And while that may be irrelevant for first-quarter results, it may weigh on the company’s outlook, considering Trump’s flip-flopping on Chinese tariffs (is tech in or is tech out?) .
The iPhone maker is expected to report $93.9 billion in revenue and $1.61 in earnings per share.
🔍 Meta and Microsoft: AI Darlings With Something to Prove
Meta reports next Wednesday, and the pressure’s on. Zuck has gone full steam into AI, pushing for everything from AI chatbots in WhatsApp to personalized content generation across Facebook and Instagram.
But here’s the kicker: Meta still makes its money from ads. And if ad budgets start shrinking in response to tariffs or a slower economy, AI investments may not save the day — at least not right away.
Meta is expected to pull in $41.3 billion in revenue and $5.24 in earnings per share.
Microsoft, on the other hand, has positioned itself as the white-collar AI whisperer. Copilot is everywhere — Office, Teams, Edge, Windows — and its $80 billion in AI infrastructure spending is squarely aimed at enterprise dominance.
It still holds a 49% stake in OpenAI, and Azure is growing, albeit slower than expected. If Microsoft can show AI adoption translating into real revenue, traders may get the breakout they’ve been waiting for.
Microsoft is expected to pick up revenue of $68.5 billion and $3.23 in earnings per share.
🤖 Nvidia: The Final Boss
Nvidia won’t report until late May, but it’s already looming over the entire earnings season. Every other tech company is spending billions on Nvidia’s chips — so when the chipmaker finally updates investors, it could swing sentiment across the entire sector.
The market wants to see that demand is real and growing, especially from hyperscalers like Microsoft, Amazon, and Google. If Nvidia disappoints, the fallout might be like watching a domino go down.
Nvidia is expected to bring home $43.1 billion in revenue and $0.90 in earnings per share.
⚙️ Final Thoughts: Big Bets, Big Risks
This isn’t just another earnings season — it’s a stress test for the Magnificent Seven amid times of big market shifts. The group that once carried the market now faces a reality check: AI is expensive, global trade is messy, and Wall Street is no longer giving out free passes for “vision.”
But where there’s risk, there’s also opportunity. Traders who can sift through the noise, spot the change in tone, and ride the next narrative — whether it’s autonomous Teslas, AI-powered spreadsheets, or ad-supported Metaverse avatars — will have the edge.
What’s your take? Which Big Tech name are you watching most closely — and are you betting on a rebound or bracing for more pain? Let’s hear it from you.

S&P 500: Defensive Plays Dominate as Growth Sectors Falter- Key Insights: The S&P 500, currently priced at **5275.7**, reflects cautious
investor sentiment, with defensive sectors like **utilities**, **consumer
staples**, and **real estate** outperforming amid market volatility.
Elevated uncertainty is evident from higher VIX levels, driven by
geopolitical tensions, weak forward earnings guidance, and concerns about
growth sectors such as **technology** and **semiconductors**. Institutional
flows into safe-haven assets like **gold** signal limited risk appetite,
suggesting near-term weakness in equity markets.
- Price Targets: For the upcoming week, a cautious long position is suggested,
given support scenarios and stabilization prospects.
- **Target 1 (T1): $5380** (short-term resistance)
- **Target 2 (T2): $5450** (psychological level)
- **Stop Level 1 (S1): $5180**
- **Stop Level 2 (S2): $5135**
- Recent Performance: The S&P 500 displayed mixed performance, with defensive
sectors outperforming while growth sectors like technology lagged due to
pressures from macroeconomic factors. The broader equity landscape remains
volatile, as indicated by the elevated VIX readings and constrained trading
ranges in major indices such as the Russell 2000.
- Expert Analysis: Analysts recommend defensive positioning, favoring sectors
like **utilities** and real estate, as investors grapple with recessionary
risks and inflation concerns. Technology and semiconductor stocks,
particularly **Nvidia** and **AMD**, face headwinds from regulatory
restrictions and trade tensions with China. Federal Reserve statements
suggest potential rate cuts later in the year, but near-term hawkishness
persists, given inflationary pressures.
- News Impact: Key earnings reports from **Tesla**, **Google**, **Intel**, and
**Boeing** could drive sentiment shifts. Tesla's results may influence
market trends heavily, reinforcing key technical levels. Additionally,
renewed U.S.-China trade concerns over semiconductor tariffs add
uncertainty. A weakening U.S. dollar favors safe-haven assets such as
**gold**, while geopolitical risks and economic softness point to limited
upside for risk assets in the near term.

What If Trump’s Tariffs Are Actually Bullish for SPX ?Hello Traders 🐺
In this idea, I want to take a closer look at SPX and break down why the new U.S. tariffs and Trump’s economic policies could either boost or damage the U.S. economy in the coming months. So make sure to stay with me until the very end.
🔍 Let’s start with the chart:
As you can see, SPX is currently holding above a weekly support level, marked by the orange ascending trendline. So far, so good. However, we’re also seeing a massive bearish divergence on the RSI — and in my opinion, this was one of the key reasons behind the recent Black Monday-style selloff.
⚠️ But here’s the deal: If SPX breaks below this orange trendline, the next strong support is around 3375 — aligned with the 0.5 Fibonacci level and the monthly blue trendline inside our green support zone.
🤔 Should we be bearish on SPX and the U.S. economy?
That’s the big question… and it’s tricky to answer right now. Let’s break it down.
🔧 1. Tariffs and Trump: What’s really going on?
We’re currently in a pause phase of the ongoing tariff war — with countries negotiating to avoid escalation. But here’s the catch: markets hate uncertainty, and that’s why we saw panic selling recently.
Still, most people miss the bigger picture here.
The U.S. has long been a consumer-driven economy, importing heavily from other nations. Meanwhile, U.S. producers have struggled to compete — both domestically and internationally — due to low tariffs at home and high tariffs abroad.
So what do Trump’s new tariffs do?
✅ They level the playing field for U.S. companies at home
✅ They push other countries to lower their tariffs through negotiation
✅ They reduce dependency on foreign imports and support domestic production
In short, if combined with smart monetary policy, these moves could actually help revive U.S. manufacturing and strengthen the economy in the mid-to-long term.
📉 Final thoughts on SPX:
I personally don’t believe the bearish breakdown is coming — but as a trader, I focus on reality, not preference. Right now, we’re still holding above major support, and unless that breaks, the bullish scenario remains in play.
Let me know what you think about this macro setup in the comments.
And as always remember:
🐺 Discipline is rarely enjoyable, but almost always profitable 🐺
🐺 KIU_COIN 🐺

SPX500 H1 | Approaching a multi-swing-low supportSPX500 is falling towards a multi-swing-low support and could potentially bounce off this level to climb higher.
Buy entry is at 5,206.22 which is a multi-swing-low support.
Stop loss is at 5,045.00 which is a level that lies underneath a swing-low support and the 61.8% Fibonacci retracement.
Take profit is at 5,490.31 which is a swing-high resistance.
High Risk Investment Warning
Trading Forex/CFDs on margin carries a high level of risk and may not be suitable for all investors. Leverage can work against you.
Stratos Markets Limited (tradu.com):
CFDs are complex instruments and come with a high risk of losing money rapidly due to leverage. 63% of retail investor accounts lose money when trading CFDs with this provider. You should consider whether you understand how CFDs work and whether you can afford to take the high risk of losing your money.
Stratos Europe Ltd (tradu.com):
CFDs are complex instruments and come with a high risk of losing money rapidly due to leverage. 63% of retail investor accounts lose money when trading CFDs with this provider. You should consider whether you understand how CFDs work and whether you can afford to take the high risk of losing your money.
Stratos Global LLC (tradu.com):
Losses can exceed deposits.
Please be advised that the information presented on TradingView is provided to Tradu (‘Company’, ‘we’) by a third-party provider (‘TFA Global Pte Ltd’). Please be reminded that you are solely responsible for the trading decisions on your account. There is a very high degree of risk involved in trading. Any information and/or content is intended entirely for research, educational and informational purposes only and does not constitute investment or consultation advice or investment strategy. The information is not tailored to the investment needs of any specific person and therefore does not involve a consideration of any of the investment objectives, financial situation or needs of any viewer that may receive it. Kindly also note that past performance is not a reliable indicator of future results. Actual results may differ materially from those anticipated in forward-looking or past performance statements. We assume no liability as to the accuracy or completeness of any of the information and/or content provided herein and the Company cannot be held responsible for any omission, mistake nor for any loss or damage including without limitation to any loss of profit which may arise from reliance on any information supplied by TFA Global Pte Ltd.
The speaker(s) is neither an employee, agent nor representative of Tradu and is therefore acting independently. The opinions given are their own, constitute general market commentary, and do not constitute the opinion or advice of Tradu or any form of personal or investment advice. Tradu neither endorses nor guarantees offerings of third-party speakers, nor is Tradu responsible for the content, veracity or opinions of third-party speakers, presenters or participants.

$SPX - Recap of Last Week April 14-17
Last week we had a shortened Trading week because of Good Friday.
We opened the week with a gap up and got a rejection at the 30min 200MA.
++ You typically don’t want to go long at a downward facing moving average. ++
And this did play out all week. We got rejected at the downward facing 200MA on Monday, again on Tuesday.
On Wednesday we gapped down (UHC weighed on the market). Wednesday we had a big down day - closing about 2.25%
And then on Thursday we came back up but stayed underneath the 35EMA.
Thursday was the last day of the trading week, and look tat the setup we started the day with. Red 35EMA trading under the Blue 30min 200 (That was bearish)
30min 200 pointing down - that was bearish. And bear gap at the top of the implied move.

A Broader Market Review...As we have all seen within the last month or so, the U.S. equity markets have been getting the worst ass whooping since 2020. And as much as we'd like to forget that absolute disaster, it does bring to thought the idea of buying general market funds (such as AMEX:SPY , NASDAQ:QQQ , or AMEX:DIA ) to gain a nice entry into the next bull market, whenever that may be. However, not everything is all smooth sailing. The unfortunate part of this market downturn is that no amount of technical astrology fortune-telling analysis could have predicted the market's reaction to the tariffs being levied on foreign nations. So we need to put our big-boy pants on and look at the market as if it isn't some automatic wealth generating pattern that points north-east all day long.
Let's start with the tariffs. Firstly, we know there has been a 90 day pause on all conforming countries most notably leaving out China. It's not like that's anything special, just almost all our crap is made there. Unfortunately, we are observing what may be the greatest economic error of our lifetimes.
For those who are lost, foreign governments DO NOT pay for the tariffs in the way we are told. The U.S. Government levies the tariffs on the exporter (Chinese companies in this case), who then pass it on to the buyer of the goods (think Walmart, Target, Apple, etc.), who then pass those charges onto YOU... Enjoy!
So with an attempt at a full blown trade war, which the U.S. cannot win nor even has the industrial strength or infrastructure to compete, we can expect the markets to completely do a Bald Eagle courtship nosedive into new lows as observed a few weeks ago. But what will the Creature from Jekyll Island think of this?
Well miraculously, Fed chairman Jerome Powell claimed that the Fed will NOT allow the tariffs to exacerbate inflation into new highs. Get that, the Federal Reserve will not allow economic movements that raise prices on an importing nation ( that's the United States by the way), to raise prices anymore. While he's at it, how about we just get no inflation ever since it's just that simple?
And as if that wasn't enough, Donald Trump called for Jerome Powell to lower rates for some reason, saying that Powell was too late on his economic movement at the Fed. As it turns out, our plan for strengthening the economy is to.... weaken the dollar? Not sure why that's the case but at least we will be able to borrow more money at a cheaper price, as if the United States doesn't already have a debt problem. The Fed lowering rates would of course open the possibility of getting yet another wave of quantitative easing which will most likely be observed further down the road. Another round of QE, along with rate cuts, will of course send the equity markets to new highs on top of a weaker dollar.
Speaking of a weaker dollar, we should lastly talk about the TVC:DXY which measures the comparative strength of the U.S. Dollar to other currencies. As it turns out in this scenario, the dollar is getting weaker and weaker every day, meaning that people are running from U.S. Debt like it's the plague. If we were going to get a weaker dollar, at least could we have a higher market to offset our inevitable losses? I guess not...
Here is the TVC:DXY 1D looking back into late 2024.
Lastly for what to expect out of the market. If the trade situation will all the tariffs and this neo-cold war cool down, we might see some tariff pauses or lowering which will of course fire the market into new highs. However, if the situation doesn't cool, our debt yields rise, the market is going to go south faster than a Canadian in December. On a positive note, macroeconomic events move slowly, so it should be clear when a turnaround is coming...

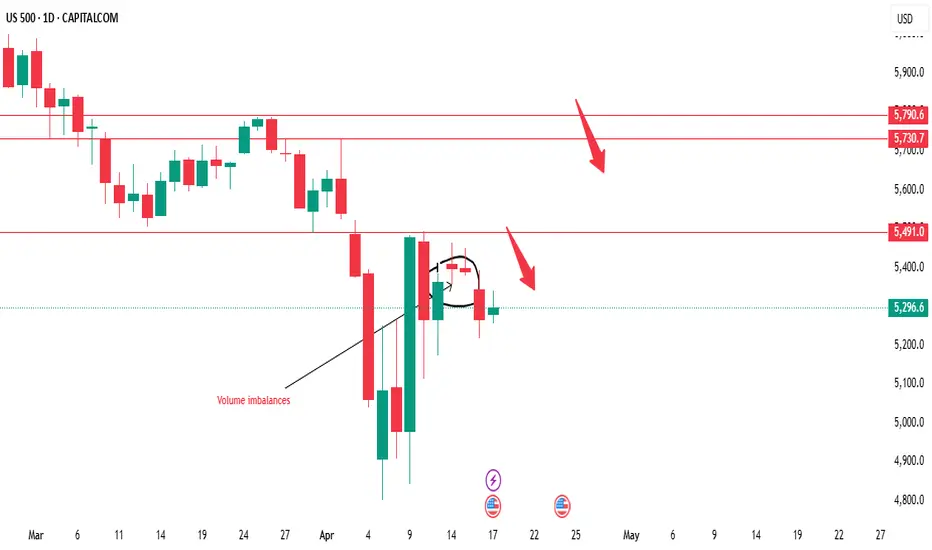
US500's performance this week will be crucial in determiningUS500 Weekly Analysis
The US500 index is currently exhibiting bearish tendencies, but a crucial level to monitor is $5491. This level has the potential to act as a resistance point, and we're looking for a possible selling opportunity around this area. However, if the market breaks above $5491, it could signal a shift in bias towards bullish territory, potentially leading to a significant upward move.
Key Levels to Watch:
1. Sell Zone: $5491 - This level is critical in determining the next move. We'll be watching for confirmation to sell, such as bearish candlestick patterns or trend indicators.
2. Resistance Area: $5730 - $5790 - A strong resistance zone that could potentially cap upward movements.
Trading Strategy:
1. Wait for Confirmation: We'll wait for the market to reach the $5491 level and look for confirmation to sell. This could include bearish candlestick patterns, trend indicators, or other technical signals.
2. Breakout Scenario: If the market breaks above $5491, we'll reassess the bullish potential and look for opportunities to buy.
3. Risk Management: It's essential to manage risk effectively, setting stop-losses and take-profits according to our trading plan.
Market Outlook:
The US500's performance this week will be crucial in determining the next direction. We'll be monitoring the market closely, analyzing price action, and providing updates on any developments. Stay tuned for our analysis and guidance on potential trading opportunities.
By keeping a close eye on these key levels and waiting for confirmation, we can make more informed trading decisions and navigate the markets effectively.

S&P Outlook for the Coming WeekS&P 500 Update – April 20, 2025
We’re still in a confirmed weekly downtrend (though we have paused our decline), and the daily chart is showing signs of indecision. The sharp bounce on April 9 created a large green candle, and price action since then has been stuck inside that day’s range, forming inside bars and signaling continued indecision.
Key Points:
Trendlines: We remain under multiple downtrend lines (drawn from both the weekly and daily timeframes), as well as all major moving averages.
Resistance: The April 9 high around 5458 has now been rejected twice.
Support: We’re currently holding above the short-term uptrend line off the April 7 pivot near 5265. Buyers have defended this level for several days in a row.
Neutral Zone: Until we break below this rising trendline or reclaim the EMAs and downtrend lines, this remains a choppy, sideways range.
This is a tough environment for swing traders. There’s opportunity on lower timeframes, but without clear direction, larger trades carry more risk. Stay patient, watch for a break in either direction, and keep size light if you choose to participate.

Would be interesting to see the market bottom during summerIt would be interesting to see the market bottom at the cross section of the 200 week moving average with the 2022 highs some time by June/July. Markets aren't cheap now however they are above the 200 week.
My framework:
Markets above 200dma go 100% long with base equity allocation (decrease to 90% if RSI is overheated)
Markets below 200dma but above 200 week go 70% long with defensive bias
Markets below 200 week go 25% long with defensive bias, change to high risk with 70% allocation once cross above 200 week.
Saves me from the large drawdowns and shaves off some percentage point off performance however having buying power when all hell breaks loose can result in decade+ alpha opportunities.
The only sector currently above its 200dma is the equal weight utilities which I like in this environments all other sectors are below the 200dma. In such an environment markets are likely to be biased to the downside.

A Tolled BellThe first bell has rung. A bridge is being paved across the $6000 range.
IF it blows up, it likely won't happen until the bridge is constructed and sentiment improves. Expect a few heartfelt endeavors to shoot above $6,660. Base case is long term crab market.

Low Risk SPX opportunitiesLetting the Market decide if it would care to continue Bullish or hold below trendline and daily zone to create New Low.

How Gann’s Square of 9 Reveals Hidden Time Cycles in the US500In today’s fast-moving markets, most traders are stuck reacting, chasing signals, hunting for breakouts, and trying to make sense of noise. But what if you could predict where the market might turn, not just based on price, but on time itself?
That’s exactly what W.D. Gann mastered. His tools, like the Square of 9, weren’t just about charts, they were about timing the rhythm of the market. Today, I’ll walk you through a real-world example on the US500, using Gann’s time technique on the 5-minute chart. This isn't theory. This is how you can bring Gann’s legacy to life in real-time trading.
Step 1: Don’t Start on the 5-Minute—Zoom Out First
The first thing to understand is that not every swing high or low is meaningful. To apply Gann’s time analysis correctly, you must choose swing points that matter—and that means looking at the higher timeframes.
Before diving into the 5-minute chart, I always analyze the 15-minute, 1-hour, and 4-hour charts. If a swing high or low on the 5-minute lines up with a key support or resistance zone from those larger timeframes, that’s your signal. These are levels where institutions and big players act, and that gives your analysis a real edge.
So, once I identified a swing high and low on the 5-minute chart that aligned perfectly with a 1-hour resistance zone and a 4-hour support level, I knew I had something solid.
Step 2: Counting Bars – The Foundation of Time Analysis
From the chosen swing low to the swing high, the market took 9 bars to complete the move. That number isn’t just a count—it becomes our anchor in time.
Using my custom-built Gann Square of 9 spreadsheet, I plugged in this value. The spreadsheet then calculated future bar counts where the 45-degree time angle repeats, based on Gann’s time rotation principle.
The output gave us these key numbers: 16, 25, 36, 49, 64, 81
These are not arbitrary. They are time-based vibration points derived from Gann’s spiral math—each one representing a future window where the market is likely to shift.
Step 3: Letting Time Lead the Trade
Let’s walk through what happened at each of these time windows:
Bar 16: The market attempted to push higher—a classic manipulation move. Then came a sharp reversal. The 45-degree vibration was in effect. This was a textbook Gann-style turning point.
Bar 25: No sharp reversal, but momentum slowed and price started consolidating. This was a structural pause—just as important as a reversal for those watching intraday shifts.
Bar 36: This one was dramatic. The market had been falling, but as we approached the 36th bar, rejection candles started appearing. Selling pressure dried up, and buyers stepped in. Soon after, a bullish breakout followed. The time vibration had called it again.
Bar 49: After a strong bullish run, the price stalled and reversed almost precisely at this time point. This marked a shift back to bearish sentiment.
Bar 64: The downtrend lost steam. Price began forming a new swing low, and as we passed the 64-bar mark, bullish momentum returned. Another clean reversal.
Bar 81: The final vibration in this sequence. The bullish move slowed, candles shrunk, and volume faded. Then came a breakdown. A bearish turn right on time.
What This Means for You as a Trader
This sequence—from bar 16 to 81—is a masterclass in how time drives the market. It shows that price action is not random. It's governed by hidden cycles that most traders overlook. But when you apply Gann’s methods with precision, the market reveals its rhythm.
All we did was:
Identify a meaningful swing (validated by higher timeframes)
Count the bars between the swing low and high
Let the Square of 9 calculate the future time vibrations
From there, we simply watched and waited. And the market played out almost to the bar.
Conclusion: From Reactive to Predictive Trading
The real power of Gann’s techniques lies not in magic, but in mathematical and astrological precision. When you understand how time and price interact, you stop reacting—you start forecasting.
You stop chasing trades—you start anticipating reversals.
Gann’s Square of 9 isn’t just an old-school tool. With the right application, it becomes a modern forecasting machine. And with the help of tools like my custom spreadsheet, the entire process becomes simple, streamlined, and incredibly effective.
So the next time you’re about to take a trade, ask yourself:
Are you following price? Or are you following time?
Because when time is on your side, the market moves in your direction—not the other way around.

SPX path forwardThe SPX appears to be transitioning out of Wave 4 and initiating Wave 5 of the current Elliott Wave cycle. This breakout from Wave 4 suggests the final leg of the broader impulsive structure is underway, typically characterized by renewed momentum and trader interest.
At this stage, we can expect a pullback or bounce near the previous Wave 3 low, which often acts as a key support level during the early stages of Wave 5 development. Should this level hold, price action is likely to resume downward, completing Wave 5 within the projected target zone.
Downside targets for Wave 5 completion are currently in the 4,700 to 4,600 range, aligning with a typical Fibonacci extension (0.618–1.0 of Wave 1 through Wave 3) and previous structure zones that may offer confluence.


Yeah I know, everybody wants to be a "contrarian" bull..Yeah I know, everybody wants to be a "contrarian" stock market bull.
But I would get really scared once the current rally ends.
It can get really skiddish after that.

US500 BULLISH SYMMETRICAL TRIANGLEhi
Fundamental view
The **US500 index** dropped due to several key factors affecting the U.S. stock market:
📉 **Tech Stock Decline** – Technology stocks faced heavy pressure, especially after **Nvidia** plunged **6.9%** due to U.S. restrictions on AI chip exports to China. Other stocks like **AMD (-7.3%)** and **Micron Technology (-2.4%)** also fell.
💰 **Federal Reserve Uncertainty** – Remarks from **Fed Chair Jerome Powell** raised concerns in the market. Powell warned that new tariffs could trigger higher inflation and slow economic growth, making investors uncertain about interest rate policies.
🛍️ **Surge in Retail Sales** – Retail sales jumped **1.4%** in March as consumers rushed to buy before new tariffs took effect. This highlights economic uncertainty, pushing investors to sell their stocks.
Overall, a mix of trade tensions, uncertain monetary policy, and a tech stock sell-off caused the **US500 index to drop 120.93 points (-2.24%)** on **April 16, 2025**.
Technical view
Yes, the **bullish symmetrical triangle** pattern is often a strong signal for upward price movement. When the price moves within this pattern, it usually indicates a **tightening volatility** before a **breakout**, which can present a good market entry opportunity.
🔍 **Breakout Confirmation**
1️⃣ Increased trading volume when price breaks above the **upper trendline**.
2️⃣ A closing candle above the **triangle resistance** for a valid signal.
3️⃣ Price targets can be measured using the pattern’s initial height as a projection.
📈 **Potential Price Movement**
If the breakout happens, the price could surge toward the next **resistance level**. However, if the breakout fails and price moves below support, the pattern could turn **bearish**.
Warren Buffett famously said, “Be greedy when others are fearful.”
good luck
**My trading strategy is not intended to be a signal. It's a process of learning about market structure and sharpening my trading my skills also for my trade journal**
Thanks a lot for your support

ETH LONG, BEARS are Losing controlETH/SPX showing weakening pattern forming around a top formation, that is bullish for ETH
ETH is about to break a pattern that is here since January 2025.

ETHEREUM BULLS regaining control, descending Triangle Descending Triangle, inversely proportional to ETH price,
ETH LONG TRADE
07 may PECTRA Upgrade is a major milestone

$SPX Monthly MACD Cross – Reset or Breakdown?The monthly MACD for the S&P 500 ( SP:SPX ) just crossed to the downside 📉 — a signal we’ve only seen a few times in the past decade.
Looking at the chart, this indicator also triggered during:
📉 2018 (Quick pullback)
🦠 2020 (COVID crash)
🐻 2022 (Extended bear market)
Now in 2025, we’re facing another sharp decline — but the question is:
👉 Is this just another quick reset like '18 & '20... or are we about to grind lower like 2022?
The MACD histogram is already in negative territory, and the price action is following the same pattern we saw before extended drawdowns.
What do you think: is this the beginning of something deeper? Or are we prepping for a snapback rally?
Drop your thoughts below 👇

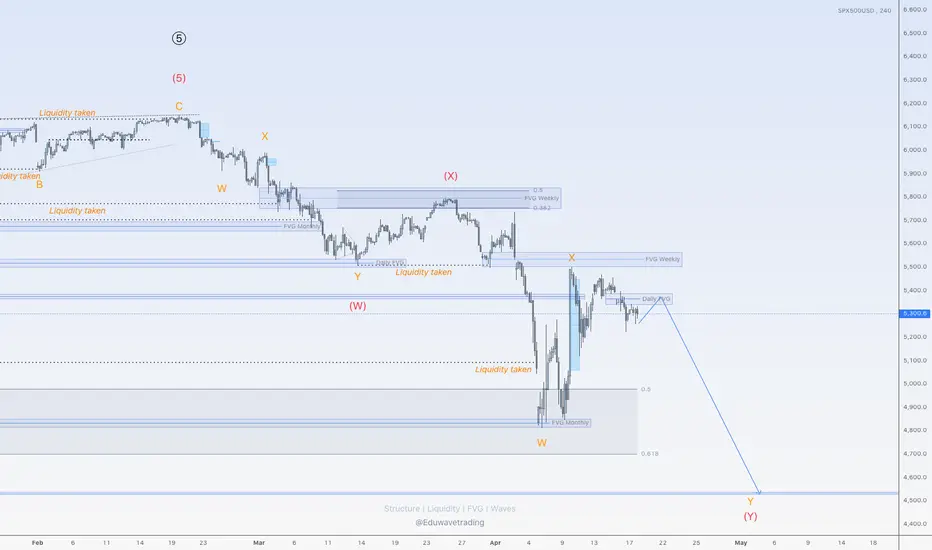
More down for SPX500USDHi traders,
SPX500USD consolidated the whole week last week.
So next week we could see the start of the last impulse wave down to finish the bigger (red) WXY correction.
Let's see what the market does and react.
Trade idea: Wait for a small correction up on a lower timeframe to trade shorts.
If you want to learn more about trading FVG's & liquidity sweeps with Wave analysis, then please make sure to follow me.
This shared post is only my point of view on what could be the next move in this pair based on my technical analysis.
Don't be emotional, just trade your plan!
Eduwave
SPX500Abu Sarah's Daily Pivot Points Indicator
For S&P 500 Index Futures
Automatically updates and identifies important support and resistance areas
Works on all time frames
