S&P 500 Breaks Out — Trump, Tariffs & Bullish Island PatternDonald Trump has mentioned the US stock market in every meeting he has held in the past few days, which has caused the US stock market indices , including the S&P500 Index ( SP:SPX ), to rise:
"Better go out and buy stocks now".
President Donald Trump told a crowd in Saudi Arabia on Tuesday that the markets are just getting started. “It’s going to get a lot higher,” he said, right as the S&P 500 posted its first gain since late February.
But one of the main reasons for the increase in the S&P 500 Index and US stocks is The United States has dropped its tariffs on Chinese goods to 30% , down from a brutal 145% , while China is slashing its own duties on US imports to just 10% , temporarily, for the next 90 days .
-------------------------------------------------
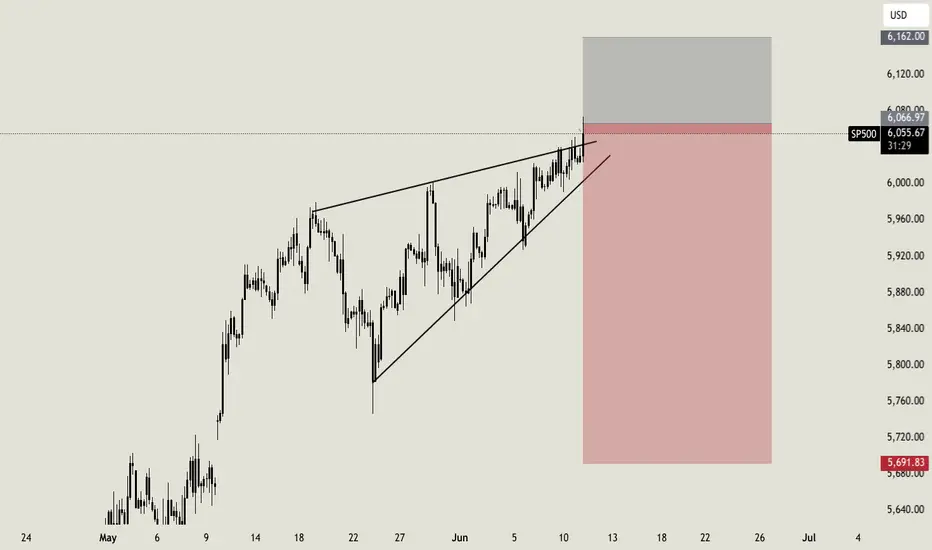
Now let's take a look at the S&P 500 Index chart on the daily time frame .
S&P500 Index managed to break the Resistance zone($5,737_$5,506) and 21_SMA(Weekly) by Breakaway Gap .
In terms of Classic Technical Analysis , the S&P500 Index has managed to form a Bullish Long Island Pattern , and this pattern is one of the continuing patterns and will be a sign of the continuation of the S&P500 Index's upward trend .
In terms of Elliott Wave theory , it seems that the S&P500 index has completed the corrective wave and is in new impulsive waves , which could cause a new All-Time High(ATH) to form.
I expect the S&P500 index to increase by at least +5% as it approaches the Uptrend line , and we will see the possibility of a new ATH .
Please respect each other's ideas and express them politely if you agree or disagree.
S&P 500 Index Analyze (SPX500USD), Daily time frame.
Be sure to follow the updated ideas.
Do not forget to put a Stop loss for your positions (For every position you want to open).
Please follow your strategy and updates; this is just my Idea, and I will gladly see your ideas in this post.
Please do not forget the ✅' like '✅ button 🙏😊 & Share it with your friends; thanks, and Trade safe.
SPXM trade ideas

The sell moment is coming? SP500Market is greed as of now, and the chart is showing a potential reversal pattern. I expect a quick short liquidation first and a big short next. I expect the market to retrace till the 5700 level in the coming weeks.
If you are a scalp trader, check my accounts page!
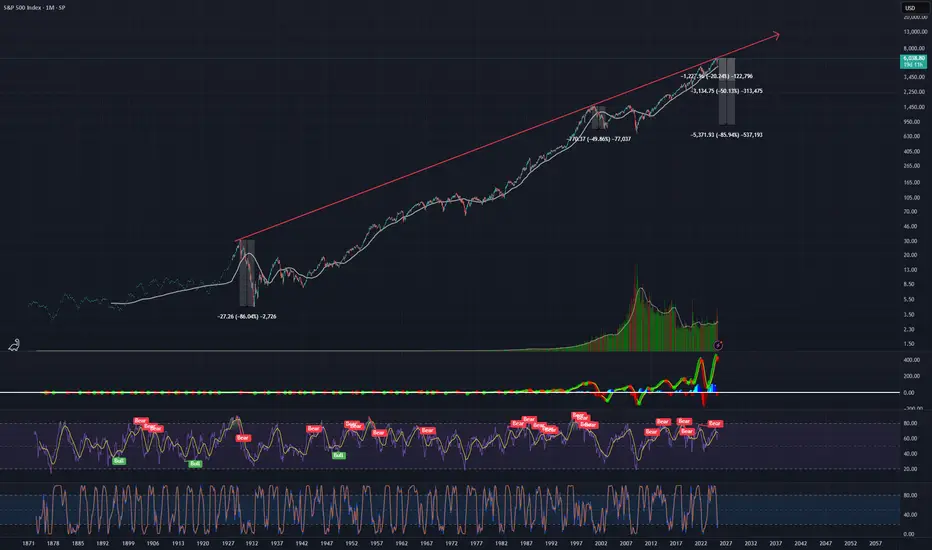
SPX Danger ZoneLog chart of SPX with a trendline connecting 1929 top to 2000 dot com top and up to 2024-25 top.
We already touched this trendline multiple times at the end of 2024 and the beggining of 2025, after which we saw a 20ish percent pullback.
If history rhymes, then we can expect a top at 6250-6350 area in the next few months and we might even stay around there for some time trapping retail investors and other foverever bulls. However, the crash ranging beteween 50 percent (2000 dot com bubble burst) and 86 percent (1929 Wall Street crash) might unravel over the next few years.
With the amount of leverage in the market this house of cards can tumble down even quicker.
Take care.
Volatility Incoming - But Price Will Say WhenKey levels on SPX and NDX
5905 big gamma level and hedging level for June 30 monthly and quarter expiration
DXY watching for potential bear trap and range trade
Gold, Silver, Bitcoin and others all discussed
Thanks for watching!!!

COMPLETED 5 of 3 or C RSI bearish Non confirmation The chart is now labeled as COMPLETED . Please also take note of The HUGE difference in QQQ to QQQE and SPY to RSP . Best of trades Wavetimer 115 % short

Premarket update - SPX USOIL GOLD NAT GAS BTCSPX sold off more overnight, but nothing dramatic yet. I do believe we will have a negative day today. Gold looks good for more upside and possibly to all time highs eventually. NAT GAS looks like a short and so does OIL. BTC probably a bit lower to 105k.

S&P500 INTRADAY consolidation range Boeing Crash: An Air India Boeing 787 crashed after takeoff from Ahmedabad to London, killing all 242 on board. It’s the worst accident involving this model. Boeing shares dropped on renewed safety concerns.
Trump Tariffs: Donald Trump plans to set new tariff rates within 1–2 weeks before a July 9 deadline. The EU may be last to get a trade deal. Japan is cautious about any agreement.
US-UK Trade Deal: The US and UK plan to move quickly on a trade deal. The EU is expected to face delays.
Tariff Pause: The US may extend a 90-day pause on tariffs for countries negotiating seriously.
Middle East Tensions: The US is pulling embassy staff as tensions rise. Iran warned of retaliation if nuclear talks fail. Reports say the US is preparing for a possible Israeli strike on Iran. Oil prices eased.
Key Support and Resistance Levels
Resistance Level 1: 6060
Resistance Level 2: 6120
Resistance Level 3: 6172
Support Level 1: 5960
Support Level 2: 5900
Support Level 3: 5800
This communication is for informational purposes only and should not be viewed as any form of recommendation as to a particular course of action or as investment advice. It is not intended as an offer or solicitation for the purchase or sale of any financial instrument or as an official confirmation of any transaction. Opinions, estimates and assumptions expressed herein are made as of the date of this communication and are subject to change without notice. This communication has been prepared based upon information, including market prices, data and other information, believed to be reliable; however, Trade Nation does not warrant its completeness or accuracy. All market prices and market data contained in or attached to this communication are indicative and subject to change without notice.

Elliott Wave Perspective: S&P 500 (SPX) Set to Finish Wave 3Since reaching its low on April 7, 2025, the S&P 500 (SPX) has embarked on an impulsive rally. From that bottom, the index progressed through distinct waves, as defined by Elliott Wave theory. Wave 1 concluded at 5246.57, followed by a corrective pullback in wave 2, which found support at 4910.42. Currently, wave 3 is underway, unfolding as a strong impulse with subdivisions in a lesser degree.
From the wave 2 low, the rally continued with wave ((i)) peaking at 5481.34. A brief retracement in wave ((ii)) then followed which ended at 5101.63. The index then surged higher in wave ((iii)), reaching 5968.61. A subsequent pullback in wave ((iv)) found support at 5767.41, setting the stage for further gains. The index should push to a few more highs to complete wave ((v)) of 3. This will mark the culmination of this upward phase.
Looking ahead, once wave 3 concludes, a corrective wave 4 should follow, retracing part of the rally from the April 7, 2025 low. This correction could unfold in a 3, 7, or 11-swing pattern before the index resumes its upward trajectory. In the near term, as long as the pivot low at 5765.74 holds, the S&P 500 is poised to achieve additional highs to finalize wave ((v)) of 3. However, if this critical support at 5765.74 is breached, it would signal the end of wave 3, prompting a larger wave 4 pullback, potentially in a 3, 7, or 11-swing structure.

SPX500 | Bearish Below 6010 Ahead of PPI – Trade Talks in FocusSPX500 | OVERVIEW
US Futures Edge Lower Ahead of PPI Report
U.S. stock futures dipped on Thursday as investors await the latest PPI data, following a softer-than-expected CPI report that eased pressure on the Federal Reserve to hike rates.
On the geopolitical front, U.S. and Chinese negotiators have reached a preliminary trade agreement during talks in London. However, the deal still requires formal approval from Presidents Trump and Xi.
📉 Technical Outlook:
The index holds a bearish momentum as long as it trades below the pivot level at 6010. If price remains under this level, it may extend the decline toward 5966, and a firm close below this support could open the path to 5938 and 5902.
📈 A bullish reversal may occur if the price breaks above 6010, with confirmation on a 1H close above 6020, targeting higher resistances.
Support Levels: 5966, 5938, 5902
Resistance Levels: 6033, 6056, 6098

S&P500 is Nearing an Important Support of 5,960!!!Hey Traders, in today's trading session we are monitoring US500 for a buying opportunity around 5,960 zone, US500 is trading in an uptrend and currently is in a correction phase in which it is approaching the trend at 5,960 support and resistance area.
Trade safe, Joe.

My favorite skitzo line in the S&P 500This is a test post, but it's also one of the single most potentially vindicating technical analysis ideas of all time: that the market really is an oracle that encodes the entirety of relevant information.
This trendline uses a logorithmic scale that intuitively "counterbalances" monetary policy and every other value-traveling dynamic like financial technologies and increasing market efficiencies, et cetera. It's a textbook trendline--Murphy says a trendline is a line that connects two highs or lows--and these highs and lows are the country's most violent economic crises: "The Great Depression" and "The Recession".

Waiting for the turnSPX cash is likely to confirm the futures high but I don't think any rally from here will last. My bet is still on a turn by Friday. Gold, Nat Gas and USOIL look like a short setup right now. BTC is hard to read, it may go higher first.

update at 12pmMarket has reentered the wedge, not a great sign, but we'll have to see how the day loses. Nat Gas came down hard. Gold is holding support, BTC getting a bounce but I think it goes lower. OIL had a nice bounce but may fall here.

usa 500 analyse*The content on this analysis is subject to change at any time without notice, and is provided for the sole purpose of assisting traders to make independent investment decisions.

S&P 500 Index (SPX) Weekly TF – 2025
Chart Context:
Tools Used: 3 Fibonacci Tools:
1. One **Fibonacci retracement** (from ATH to bottom)
2. Two **Trend-Based Fibonacci Extensions**
* Key Levels and Zones:
* **Support Zone** (Fib Confluence): \~4,820–5,100
* **Support Area (shallow pullback)**: \~5,500–5,600
* **Resistance & TP Zones:**
* TP1: **6,450** (Fib confluence & -61.8%)
* TP2: **6,840** (-27%)
* TP3: **7,450–7,760** (Major Confluence)
Technical Observations:
* SPX is approaching a **critical resistance** near previous ATH (\~6,128) with projected upward trajectory.
* The **green dashed path** suggests a rally continuation from current \~6,000 levels to TP1 (\~6,450), TP2 (\~6,840), and eventually TP3 (\~7,450–7,760), IF no major macro shock hits.
* The **purple dotted path** suggests a potential retracement first to \~5,600 (shallow correction) or deeper into \~5,120 or even 4,820 zone before continuing the bullish rally.
* The major support zone around **4,820–5,120** includes key Fib retracement levels (38.2% and 61.8%) from both extensions and historical breakout levels.
Fundamental Context:
* US economy shows **resilience** amid soft-landing narrative, though inflation remains sticky.
* The **Federal Reserve** is expected to cut rates in **Q3–Q4 2025**, boosting equity valuations.
* Liquidity expansion and dovish outlook support risk assets, including **equities and crypto**.
* However, **AI-driven tech rally** may be overstretched; a correction could follow earnings disappointments or macro surprises (e.g., jobs or CPI shocks).
Narrative Bias & Scenarios:
**Scenario 1 – Correction Before Rally (Purple Path)**
* If SPX faces macro pushback (e.g., high CPI, hawkish Fed), expect retracement to:
* 5,600 = Fib -23.6% zone
* 5,120–4,820 = Major Fib Confluence Zone
* These would act as **accumulation zones**, setting up next leg up toward TP1 and beyond.
* **Effect on Gold**: May rise temporarily due to risk-off move.
* **Effect on Crypto**: Could stall or correct, especially altcoins.
**Scenario 2 – Straight Rally (Green Path)**
* If Fed confirms cuts and macro remains soft:
* SPX breaks ATH (\~6,128)
* Hits TP1 (\~6,450), TP2 (\~6,840)
* Eventually reaches confluence at **TP3 (7,450–7,760)**
* **Effect on Gold**: May struggle; investor preference for equities.
* **Effect on Crypto**: Strong risk-on appetite, altseason continuation.
Indicators Used:
* 3 Fibonacci levels (retracement + 2 extensions)
* Trendlines (macro and local)
* Confluence mapping
Philosophical/Narrative Layer:
This phase of the market resembles a test of collective confidence. Equity markets nearing ATHs while monetary easing begins reflect a fragile optimism. The Fibonacci levels act as narrative checkpoints — psychological as much as mathematical. Will we rally on faith or fall for rebalancing?
Bias & Strategy Implication:
Bias: Bullish with caution
* Strategy:
* Await **confirmation breakout >6,128** for fresh long entries
* Accumulate on dips in the **5,100–5,500** zone if correction unfolds
* Use **TP1, TP2, TP3** as staged exits
Related Reference Charts:
* BTC.D Analysis – Bearish Bias:
* TOTAL:Bullish Bias
*TOTAL3 – Bullish Bias:
* US10Y Yield – Falling Bias Impact:https://www.tradingview.com/chart/US10Y/45w6qkWl-US10Y-10-Year-Treasury-Yield-Weekly-TF-2025/

SPX 500 to 17,000 in 7 years.This chart represents the S&P 500, showcasing its performance over time, including quarterly data.
It captures everything.
Every recession.
Every war.
Every president.
Every variation of the monetary base as superpowers rise and fall.
Whenever I hear a bear in the stock market declare that THE TOP has been reached, and we are about to CRASH -50% to -90%
I find myself drawn to these comprehensive long term charts.
If the bulls are genuinely in control and we have merely undergone an intermediate-term correction, then the long-term bull market that commenced at the 2009 low remains robust, with many more years ahead.
The chart also illustrates that the three significant bull market phases typically last around 18-20 years following a major breakout.
And they yield a comparable number of X's.
It's all quite fascinating, if you ask me.
See you in the future!

up or down...Hello friends🙌
🔊As you can see, the US500 index has been identified with several resistance encounters and the good support that the price has been able to break the resistance and turn it into support. Now, according to today's news, it seems that the price is targeting higher targets that we have identified for you.
In case of correction, it has strong support ahead of it, which we have identified with a white line, but don't forget that buyers have entered...📈
🔥Join us for more signals🔥
Trade safely with us.

Smart Money Levels Spotted on SPX500USD – Massive Sell Zone Major Supply Zone (Resistance): 🔵 6,000 – 6,050
Price is currently sitting right inside a well-defined supply zone, where smart money previously sold off heavily back in December.
Intermediate Support: 🔵 5,436
A clear structural level where price previously broke down from and retested in April.
Major Demand Zone (Support): 🟠 4,900 – 5,000
Price reacted aggressively from this zone during the massive April sell-off, suggesting strong institutional interest.
---
🧭 Current Price Action:
SPX500USD is currently trading at 6,004, right at the supply zone marked by the blue shaded area. Price has aggressively rallied from the 4,900 demand zone in April and is now testing this critical resistance level for the first time since the major drop.
📌 Notice the tight consolidation and rejection wicks from this area in the past. This could signal a potential reversal or a breakout trap!
---
⚠️ Bearish Signals to Consider:
🔻 Risk of Rejection: With price inside a supply zone and momentum slowing, there’s a high probability of a rejection.
🔻 Double Top Structure: Previous highs around 6,050 could form a double top, making this a textbook reversal opportunity.
🔻 Downside Targets:
📍 First target: 5,436 (previous support & breakout level)
📍 Second target: 4,900–4,950 (major demand zone & value area)
---
🧠 Smart Money Perspective:
This setup aligns perfectly with institutional trading logic:
Sell high in supply zones
Buy low in demand zones
Volume Profile and LuxAlgo’s visible range confirm these key levels where institutions are most likely to act.
---
🧨 Trading Plan:
🚫 No buying in the supply zone
📉 Short entries if rejection confirms (look for bearish engulfing / lower high on lower timeframes)
🎯 Target 1: 5,436
🎯 Target 2: 4,900–4,950
🛡️ Stop Loss: Above 6,050 (fake breakout zone)
---
📊 Bonus Tip:
Watch how price behaves around FOMC and CPI news – liquidity grabs often happen right before key macro data, especially near supply zones. Be patient!
---
💬 Let’s Discuss:
Do you see a breakout or a rejection from here?
Comment below if you're bullish or bearish on SPX500USD! 👇
Don't forget to like & follow if you find this breakdown helpful 💡
#SP500 #SPX500USD #SmartMoney #SupplyAndDemand #TechnicalAnalysis #PriceAction #LuxAlgo #TradingSetup #SwingTrade #BearishReversal

SOARING 20's are you ready for the Blowoff of the century#SPX v Currency in circulation
#Cup&Handle
1929 Echo bubble
AI will increase earnings and GDP
as ASI enters the workplace and Robotics grow us out of Debt
GDP = Number of people * Productivity
Now add an autonomous workforce to this.

S&P500 calm reaction to geopolitical riskGeopolitics:
The US launched airstrikes on Iran, raising global tensions. Iran has vowed to retaliate, and Israel isn’t backing down. Trump warned of more action if Iran doesn’t make peace. The US issued a global travel alert, airlines are avoiding the Gulf, and Japanese banks may pull staff from the region. Oil is in focus, especially with tankers avoiding the Strait of Hormuz.
Markets:
Reactions were calm overall. The US dollar gained, oil prices rose briefly, and stock futures were mixed as investors waited to see what Iran does next.
Corporate News:
BNY Mellon is reportedly in talks to merge with Northern Trust, which could lead to a major deal in the banking sector.
Tesla launched its first robotaxi service in part of Austin, aiming to spark new growth after a sales slump.
Key Support and Resistance Levels
Resistance Level 1: 6018
Resistance Level 2: 6043
Resistance Level 3: 6070
Support Level 1: 5910
Support Level 2: 5870
Support Level 3: 5845
This communication is for informational purposes only and should not be viewed as any form of recommendation as to a particular course of action or as investment advice. It is not intended as an offer or solicitation for the purchase or sale of any financial instrument or as an official confirmation of any transaction. Opinions, estimates and assumptions expressed herein are made as of the date of this communication and are subject to change without notice. This communication has been prepared based upon information, including market prices, data and other information, believed to be reliable; however, Trade Nation does not warrant its completeness or accuracy. All market prices and market data contained in or attached to this communication are indicative and subject to change without notice.

SPX: geopolitics, Fed, inflationDuring the previous week the S&P 500 was moving in a mixed manner. The trading range was between levels 6.039 and 5.967 where the index is closing the week. Traders and investors had quite a lot of topics to cover in order to decide which side should be traded. The tensions in the Middle East were one of them, continuing for the second week in a row. The FOMC meeting was held, with the Fed holding interest rates steady, for another meeting. Still, the Fed continues to count with two rate cuts till the end of this year. The Fed expects that implemented trade tariffs by the US Administration might affect short term inflationary pressures, but it should be a one-off effect. Some positivity for markets came from the statement of the Fed Governor Waller, who noted that the Fed might make the first rate cut in July. On the opposite side was San Francisco Fed President Mary Daly, who noted that she would be more confident to cut rates, after she is certain that the trade tariffs would not make a significant impact on inflation.
Uncertainty still holds on markets, especially after news posted by the Wall Street Journal, noting that the U.S. might cancel technology waivers, impacting some chipmakers. The tech companies involved in the semiconducting business dropped in value. Friday's trading session Nvidia ended by 1,12% lower, AMZN also closed the week with a drop of 1,33%. This week on the opposite side was Apple, with a gain of 2,25%.
As long as uncertainty shapes investors sentiment, the market will lack optimism. The volatility on the US equity markets might continue, with possibly negative trends. The week ahead brings the PCE data as well as Fed Chair Powell`s testimony in front of the Congress, in which sense, the volatility will most certainly hold.

S&P 500 | Bullish Breakout Setting Up After Ichimoku Compression
The S&P 500 Index is showing signs of bullish reversal after a period of consolidation inside the Ichimoku cloud on the 30-minute chart. Price previously broke down from a descending channel but found support near the 5,960 level and is now challenging the cloud resistance.
Key technical highlights:
Previous ascending and descending channel structures are clearly defined.
Sideways accumulation zone indicates market indecision and potential buildup.
Price is attempting to break above the Ichimoku cloud, which may signal a bullish trend continuation.
A clean breakout and hold above 5,985 could trigger a move toward the 6,020 resistance zone, as projected.

Weekly Preview - SPX USOIL NAT GAS GOLD BTCfor SPX to have a good down move, 5900 has to break overnight tonight. 5700 is possible this week. Nat Gas still looks bullish, OIl as well. Gold may go to new highs but that wouldn't necessary be longer term bullish. BTC should continue to drop.
