S&P 500 H4 | Rising into a pullback resistanceThe S&P 500 (SPX500) is rising towards a pullback resistance and could potentially reverse off this level to drop lower.
Sell entry is at 5,982.20 which is a pullback resistance that aligns with the 50% Fibonacci retracement.
Stop loss is at 6,030.00 which is a level that sits above the 78.6% Fibonacci retracement and a swing-high resistance.
Take profit is at 5,869.32 which is a swing-low support that aligns closely with a 78.6% Fibonacci retracement.
High Risk Investment Warning
Trading Forex/CFDs on margin carries a high level of risk and may not be suitable for all investors. Leverage can work against you.
Stratos Markets Limited (tradu.com ):
CFDs are complex instruments and come with a high risk of losing money rapidly due to leverage. 63% of retail investor accounts lose money when trading CFDs with this provider. You should consider whether you understand how CFDs work and whether you can afford to take the high risk of losing your money.
Stratos Europe Ltd (tradu.com ):
CFDs are complex instruments and come with a high risk of losing money rapidly due to leverage. 63% of retail investor accounts lose money when trading CFDs with this provider. You should consider whether you understand how CFDs work and whether you can afford to take the high risk of losing your money.
Stratos Global LLC (tradu.com ):
Losses can exceed deposits.
Please be advised that the information presented on TradingView is provided to Tradu (‘Company’, ‘we’) by a third-party provider (‘TFA Global Pte Ltd’). Please be reminded that you are solely responsible for the trading decisions on your account. There is a very high degree of risk involved in trading. Any information and/or content is intended entirely for research, educational and informational purposes only and does not constitute investment or consultation advice or investment strategy. The information is not tailored to the investment needs of any specific person and therefore does not involve a consideration of any of the investment objectives, financial situation or needs of any viewer that may receive it. Kindly also note that past performance is not a reliable indicator of future results. Actual results may differ materially from those anticipated in forward-looking or past performance statements. We assume no liability as to the accuracy or completeness of any of the information and/or content provided herein and the Company cannot be held responsible for any omission, mistake nor for any loss or damage including without limitation to any loss of profit which may arise from reliance on any information supplied by TFA Global Pte Ltd.
The speaker(s) is neither an employee, agent nor representative of Tradu and is therefore acting independently. The opinions given are their own, constitute general market commentary, and do not constitute the opinion or advice of Tradu or any form of personal or investment advice. Tradu neither endorses nor guarantees offerings of third-party speakers, nor is Tradu responsible for the content, veracity or opinions of third-party speakers, presenters or participants.
SPXM trade ideas

SPX: Elliott Wave indicating corrective phase nearly doneMy Elliott Wave count suggests the S&P 500 ( SP:SPX ) is nearing the completion of its current corrective phase. Price action has been consolidating around the 5980 area, last closing at 5980 on Wednesday.
From an Elliott Wave perspective, this setup implies an uptrend continuation is likely coming in the upcoming days.
Key levels I'm watching:
Immediate Support: 5840-5900 zone. A hold here would confirm strength.
Stronger Support: 5767-5840. A break below this would challenge the immediate bullish count.
Resistance: 6000 (psychological) and the all-time high of 6147.43. A clear break above these levels will validate the next impulse wave.
Volume and market breadth will be crucial confirmations. Let's see how the market reacts!
What are your thoughts on the current SPX wave count? Share below!
Disclaimer: This content is for informational and educational purposes only, and should not be considered financial advice. Trading involves substantial risk and may result in the loss of your capital. Always conduct your own thorough research and consult with a qualified financial professional before making any investment decisions.

S&P500Net shorts increased by 58,668 contracts, which is a massive bearish shift from institutions and hedge funds.
This signals that large speculators are aggressively betting against the S&P 500.
It’s one of the largest bearish positions in recent months — often tied to expectations of a market pullback, economic concern, or interest rate risk.
Bearish bias intensifies — short positions rising fast.

SPX500 Detailed Trading Game Plan🎯 Current Market Context:
Current Price: 6,000 (Approx.)
Trend: Bullish; forming higher highs and higher lows.
Key Technical Observations:
Strong support and trendline respecting bullish structure.
Fibonacci confluence points towards potential upside momentum continuation.
Volume Profile indicating key levels at 5,950–6,000.
🚦 Trading Scenarios & Probabilistic Setups:
🟢 Scenario A (High Probability Long Trade ~65%):
Entry Zone: Current Levels (6,000–5,950) or retest to 5,863 support.
Stop Loss: Below 5,709 (critical structural support).
Targets:
Primary: 6,262 (100% Fibonacci Extension)
Secondary: 6,460 (Key Horizontal Resistance)
Risk-to-Reward: Favorable (~1:3)
🟡 Scenario B (Medium Probability Short Trade ~45%):
Entry Zone: 6,460–6,500 (strong resistance confluence)
Stop Loss: Above 6,600 (clear invalidation)
Targets:
Primary: 6,100 (structural retest)
Secondary: 5,950–5,863 (previous support zone)
Risk-to-Reward: Good (~1:2)
🔴 Scenario C (Low Probability but High Reward Long Trade ~35%):
Entry Zone: Deep retracement at ~5,408–5,106
(Invalidated if price breaks below 5,107.)
Stop Loss: Below 5,107 (firm invalidation)
Targets:
Primary: 5,950 (key resistance)
Extended: 6,460–7,176 (long-term bullish target)
Risk-to-Reward: Excellent (~1:5+), but lower likelihood of triggering.
📊 Probability & Risk Management Summary:
Scenario Probability Risk Reward Potential
A (Long) 65% ✅ Moderate High
B (Short) 45% ⚠️ Moderate Moderate
C (Long Deep) 35% ❗ Lower Very High
⚙️ Recommended Approach:
Primary Strategy: Bullish Continuation (Scenario A) due to current market structure and volume profile confirmation.
Secondary Consideration: Watch closely for Short Setup (Scenario B) only upon clear resistance signals.
Contingency Setup: Deep retracement (Scenario C) provides excellent value entry if fundamentals trigger a major correction.
🛠 Trade Management Tips:
Position Size according to scenario probabilities. Allocate larger sizing to Scenario A, cautious sizing for Scenario B, and small, speculative sizing for Scenario C.
Trailing Stops: As price approaches targets, adjust stops to lock profits progressively.
🗓 Timeline & Key Levels for Reference:
Immediate actionable trades: Scenario A (Long) setup at current levels.
Monitor closely by Mid-August 2025 for Scenario B potential short setup.
Watch closely for deep retracement scenario by November 2025 if substantial correction occurs.
🚨 Important Note: Always adjust your trades dynamically based on evolving macroeconomic and geopolitical news. These probabilities are guidelines—not certainties.
⚠️ Disclaimer:
Trading involves substantial risk and is not suitable for every investor. The information provided is purely for educational and informational purposes and does not constitute financial advice, a recommendation, or solicitation to buy or sell any financial instrument. Always perform your own analysis, consider your financial situation and risk tolerance, and consult with a qualified financial advisor before executing trades. Past performance does not guarantee future results. You alone bear the full responsibility for any investment decision you make.
Stay disciplined, trade wisely, and good luck! 🍀📊

17-04-2025This chart contains my analysis and key observations for today's trading session. All drawings and indicators reflect my current view of the market as of today. The purpose of this publication is to keep a record of my analysis and review it later for learning and improvement. No investment advice is provided.
SPX500 | Regression Channel Aligned with Bullish Sentiment – 6,1The S&P 500 ( FOREXCOM:SPX500 ) continues to respect the newly drawn regression channel after breaking above both descending resistance and AI-based mid-zones. Price is now moving in alignment with the prevailing sentiment bias, indicating potential momentum toward the 6,156–6,167 extension range.
🧠 Key Observations:
Breakout from a compressed structure
VWAP reclaims confirm market strength
Regression channel suggests controlled ascent
1.236 Fib projection at 6,062.22 aligns with short-term resistance
Higher confluence targets: 6,156.60 and 6,167.02
📉 Risk Levels:
Breakdown below 6,007 or re-entry into the prior wedge would invalidate this view short term.
🔍 Follow US, WaverVanir_International_LLC for more high-precision confluence maps, risk models, and macro-aligned quant setups.

15-04-2025This chart contains my analysis and key observations for today's trading session. All drawings and indicators reflect my current view of the market as of today. The purpose of this publication is to keep a record of my analysis and review it later for learning and improvement. No investment advice is provided.
I will personally watch this trade. London session might go downI think I discovered a flawed in the system and it might need some immediate attention. This is where my specialty comes in.

S&P500 INTRADAY sideways consolidation Geopolitics & Markets:
Donald Trump left the G-7 early, denying it was to negotiate peace between Israel and Iran. He floated sending JD Vance or Steven Witkoff for talks but denied direct outreach to Iran.
Tensions escalated as Israel bombarded Iran, which retaliated with missiles and drones. Trump briefly alarmed markets by calling for the evacuation of Tehran.
Oil prices rose and equity futures fell amid rising geopolitical risks. A tanker collision near the UAE added to oil market jitters.
Deutsche Bank warned oil could hit $120 if the Strait of Hormuz is disrupted.
Tech & AI:
Meta is working with Scale AI’s Alexander Wang to accelerate its AI strategy. The stock is near record highs after a strong rebound, boosted by investor optimism over Zuckerberg’s AI push.
SoftBank raised $4.8B by selling T-Mobile US shares to help fund AI ventures. It’s leading a massive $40B funding round for OpenAI, which just secured a U.S. defense contract.
U.S. Politics & Tax Policy:
Senate Republicans revised Trump’s tax plan, softening the controversial "revenge tax" to ease concerns about foreign investment. An Australian asset manager cited the tax in freezing U.S. investments.
Lawmakers left the SALT cap unchanged for now, keeping the $10,000 limit while further debate continues.
Key Support and Resistance Levels
Resistance Level 1: 6,058
Resistance Level 2: 6,138
Resistance Level 3: 6,200
Support Level 1: 5,953
Support Level 2: 5,913
Support Level 3: 5,845
This communication is for informational purposes only and should not be viewed as any form of recommendation as to a particular course of action or as investment advice. It is not intended as an offer or solicitation for the purchase or sale of any financial instrument or as an official confirmation of any transaction. Opinions, estimates and assumptions expressed herein are made as of the date of this communication and are subject to change without notice. This communication has been prepared based upon information, including market prices, data and other information, believed to be reliable; however, Trade Nation does not warrant its completeness or accuracy. All market prices and market data contained in or attached to this communication are indicative and subject to change without notice.

S&P 500 H1 | Falling toward a swing-low supportThe S&P 500 (SPX500) is falling towards a swing-low support and could potentially bounce off this level to climb higher.
Buy entry is at 5,974.27 which is a swing-low support that aligns closely with the 78.6% Fibonacci retracement.
Stop loss is at 5,935.00 which is a level that lies underneath a swing-low support.
Take profit is at 6,056.80 which is a swing-high resistance.
High Risk Investment Warning
Trading Forex/CFDs on margin carries a high level of risk and may not be suitable for all investors. Leverage can work against you.
Stratos Markets Limited (tradu.com ):
CFDs are complex instruments and come with a high risk of losing money rapidly due to leverage. 63% of retail investor accounts lose money when trading CFDs with this provider. You should consider whether you understand how CFDs work and whether you can afford to take the high risk of losing your money.
Stratos Europe Ltd (tradu.com ):
CFDs are complex instruments and come with a high risk of losing money rapidly due to leverage. 63% of retail investor accounts lose money when trading CFDs with this provider. You should consider whether you understand how CFDs work and whether you can afford to take the high risk of losing your money.
Stratos Global LLC (tradu.com ):
Losses can exceed deposits.
Please be advised that the information presented on TradingView is provided to Tradu (‘Company’, ‘we’) by a third-party provider (‘TFA Global Pte Ltd’). Please be reminded that you are solely responsible for the trading decisions on your account. There is a very high degree of risk involved in trading. Any information and/or content is intended entirely for research, educational and informational purposes only and does not constitute investment or consultation advice or investment strategy. The information is not tailored to the investment needs of any specific person and therefore does not involve a consideration of any of the investment objectives, financial situation or needs of any viewer that may receive it. Kindly also note that past performance is not a reliable indicator of future results. Actual results may differ materially from those anticipated in forward-looking or past performance statements. We assume no liability as to the accuracy or completeness of any of the information and/or content provided herein and the Company cannot be held responsible for any omission, mistake nor for any loss or damage including without limitation to any loss of profit which may arise from reliance on any information supplied by TFA Global Pte Ltd.
The speaker(s) is neither an employee, agent nor representative of Tradu and is therefore acting independently. The opinions given are their own, constitute general market commentary, and do not constitute the opinion or advice of Tradu or any form of personal or investment advice. Tradu neither endorses nor guarantees offerings of third-party speakers, nor is Tradu responsible for the content, veracity or opinions of third-party speakers, presenters or participants.

Monday Preview SPX rallied overnight, making the the larger C wave down less of a possibility. Gold may fall now that it's tested it's highs. Natural Gas is over resistance and looks like it will go higher. Oil also looking for a bounce today. BTC is above resistance at the moment.

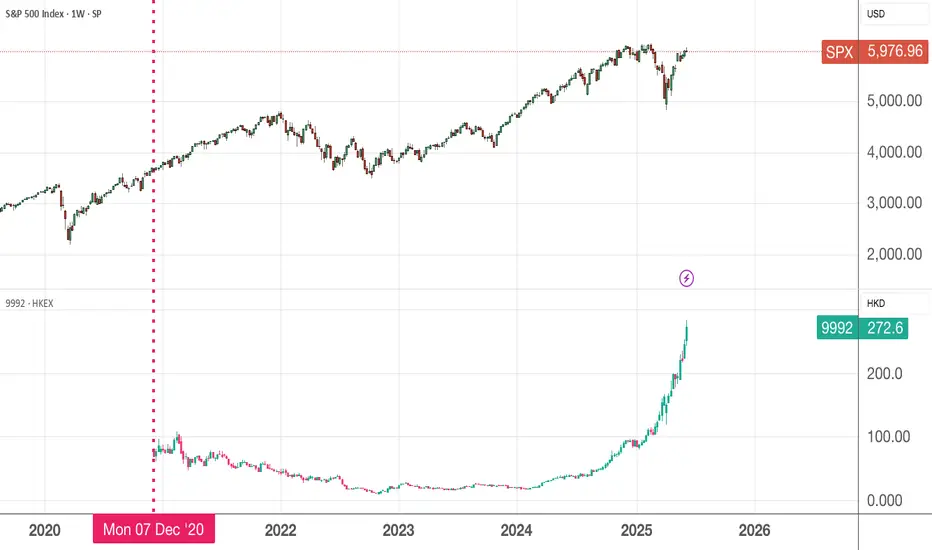
Opportunities abound if you are open mindedRead latest article here
I have covered my regrets for missing this stock here and here
From this article , you can see that resellers are investing/buying up these limited edition plush toys and selling online at a profits. See, you need not be dabbling in the stock market to make money. These resellers neither manufacture nor market these toys but were sharp and fast enough to catch the trend.
Risks - if they bought too many and the trend dies down or the profits start to come down, they stand to lose as well since they need to first cough out capital to purchase these toys.
I am of the opinion that the stock market is created equally for both the rich and poor to have a stake in the game. That is why if you are an employee earning a fixed salary, learning to trade/invest is no longer a luxury unless you have a huge inheritance, strike lottery or simply not interested in making money.
Since Dec 2020, Pop Mart has gained 286% returns for the shareholders who ride through the lows of less than 10 dollars in its darkest moments during 2023/2024. In comparison, the same amount of money invested in the SPX will gives you less than 70% returns. Pop Mart gains is 4x more than passive investing in SPX.
Congrats to those who had longed it and are laughing to the bank. For those like me who missed it, no point crying over spilled milk. There are abundant opportunities, just keep an open mind, if the fundamentals are ok, nibble a bit and see how it goes. All you need is 1-2 multibagger in your portfolio
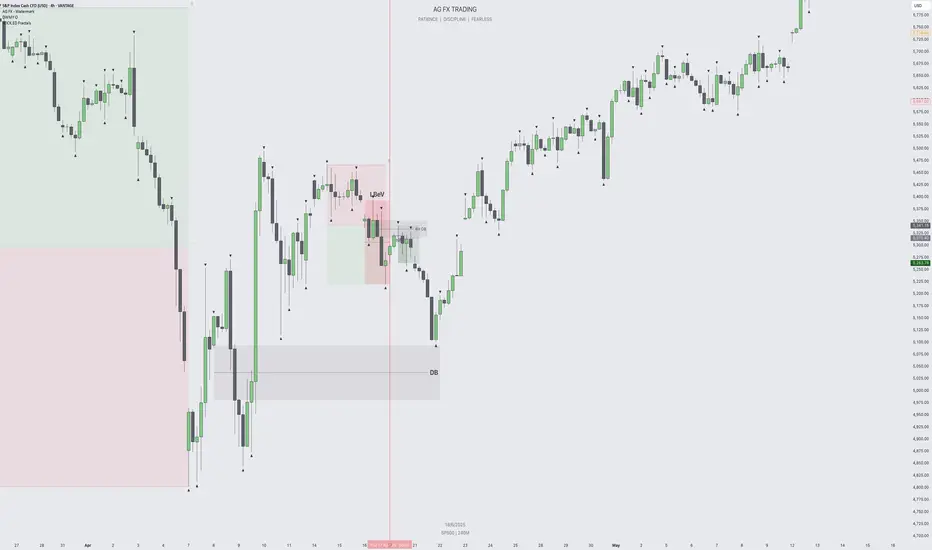
SPX500 VEP Trader Strategy | Trend + Liquidity + Precise We’ve confirmed a strong bullish trend in SPX500 supported by solid momentum on the daily timeframe using the Squeeze Momentum indicator. The market shows potential to continue upward but may first revisit key liquidity zones.
🔍 Identified Liquidity Zones
We’ve marked high-liquidity zones on the following daily candles:
📅 Thursday, June 5
📅 Thursday, June 12
📅 Tuesday, June 3
These are areas where the market may pull back to sweep open orders before resuming the bullish trend.
🎯 Key Area: Fair Value Gap (15min)
We are expecting price to reach a 15-minute FVG identified on Monday, June 2 at 10:15 AM.
✅ Target level: $5,892
If the price taps into this zone, we’ll be watching for a bullish reaction.
🛠️ Entry Confirmation (5min or 2min)
Once the reaction occurs:
Look for a new FVG on 5M or 2M.
Confirm that Squeeze Momentum continues to show bullish strength.
If aligned, we enter CALLs with high confidence.
📉 Risk Management
Stop Loss: $5,860
Take Profit 1: Nearest recent High
Take Profit 2 and beyond: Continue marking each new High as a profit-taking step
📌 Final Thoughts
This is a clean setup combining liquidity analysis, FVG structure, and VEP Trader confirmation for high-probability trading.
It’s a plan that respects patience, structure, and precision.
📸 (See attached chart for full visualization of structure, levels, and gaps)
#SPX500 #VEPTrader #SmartMoneyConcepts #PriceAction #LiquiditySweep #FVGTrading #DayTrading #TradingViewIdeas #PBInvesting

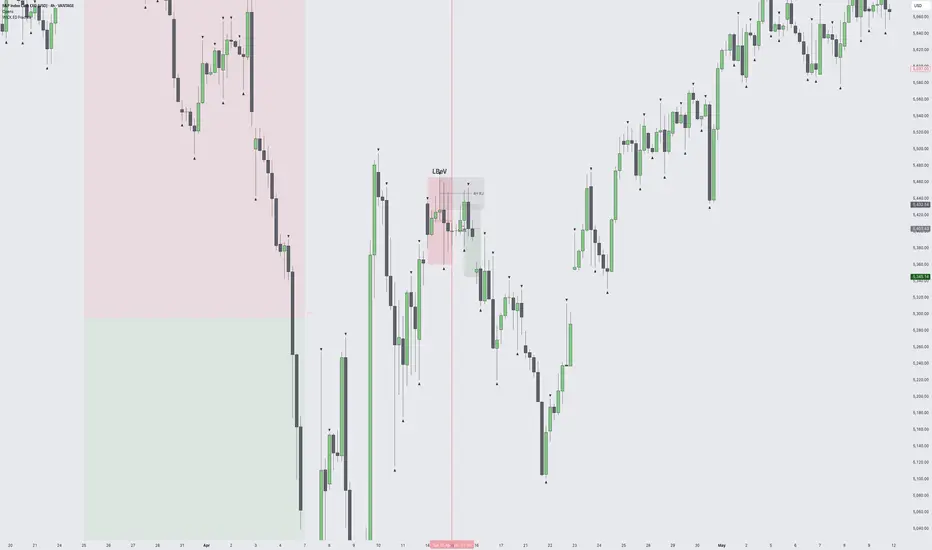
Bearish outlook on us500Looking at how price took out liquidity inside the previous eardhbob l I would be watching for bearishness to the downside

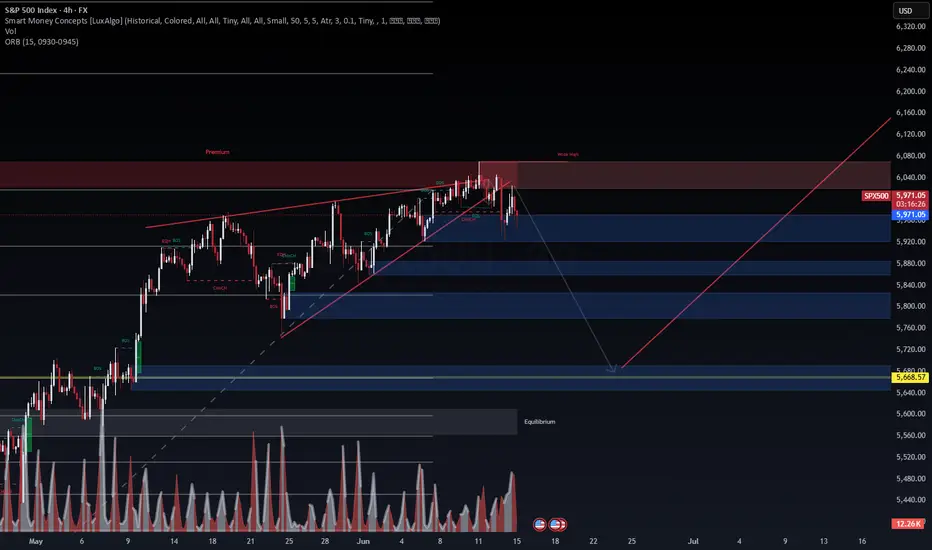
SPX500 | SMC Breakdown in Progress – Watch the Liquidity SweepThe rising wedge broke structure near the weak high in premium territory. We are now seeing bearish CHoCHs and BOS with volume confirmation, suggesting a move down toward the next key demand zone between 5840–5720.
📊 Volume Analysis
Spikes in sell volume during BOS align with structural shifts, confirming the loss of bullish intent.
📌 Key Zones
Premium Zone: 6000–6080 was swept and rejected
Target Zones: 5840, 5760, and final liquidation zone near 5668
Equilibrium sits below 5700, matching confluence with prior FVG and OB
🔀 Scenarios
Price could react mid-range and retrace to test the weak high again.
A full sweep of the lower liquidity zone near 5668 could create a bullish springboard for a longer-term continuation.
🎯 Bias: Bearish unless price reclaims 6020 on strong volume.
Watch for how price behaves near the mid-blue zone — patience will provide the cleanest entry.
— WaverVanir International LLC
S&P500 awaits new drivers for growthThe S&P 500 index has been moving in a perfectly sideways direction without any clear directional bias. This week had increased volatility a little bit, but not too much: the price was consolidating in a narrowing triangle, having expanded it to some extent.
It’s possible to observe a continuation of a sideways action, at least until the interest rate decision from the FED next week and the press-conference of Jerome Powell, which might give (or might not give) any clarity about the possible direction of the market.
Overall activity remains muted as summer’s slow price action dominates the action.
Don't forget - this is just the idea, always do your own research and never forget to manage your risk!

SPX500: Trade Setupwww.youtube.com
📉 SPX500 – 4H Short Setup | Smart Money Premium Rejection
Approaching a pivotal juncture on the 4H chart, where price interaction at the premium zone signals a noteworthy development. Notably, a rejection marked by a feeble high + CHoCH structure.
🎯 Current Thesis:
- Short Entry: 5,998.3 → Entering premium + inefficient zone
- Target: 5,790.1 → Previous FVG + BOS retest area
- Potential Reload Zone: 5,704.2 – 5,644.2 → Offering deep discount + mitigation opportunities
🧠 Structure + Liquidity Insights:
- Bearish intent affirmed by BOS + CHoCH
- Fib levels align for confluence, notably 0.886 rejection at 5,875.6
- Key FVG breached; distribution evident from premium swing failure
📊 Gameplan:
Execute initial target at 5,790, consider partial exit.
Monitor reaction for possible reload near 5,704 or lower at 5,644 for continued strategy.
Maintain caution above 6,018 (weak high) for risk protection.
⏳ Context:
- Increasing volatility, weakening internals
- Downside path supported by volume nodes
- Market reassessing risk premia amidst Fed pause
🏴☠️ Trade strategically akin to smart money. Avoid impulsive actions — prioritize displacements, mitigations, and liquidity tactics.
hashtag#SPX500 hashtag#SmartMoneyConcepts hashtag#Fibonacci hashtag#ShortSetup hashtag#OrderFlow hashtag#TradingView hashtag#BearishBias hashtag#PremiumRejection hashtag#IntradayStrategy hashtag#SMP500 hashtag#WaverVanir

SPX500 – 4H Short Setup | Smart Money Premium RejectionWe’ve reached a critical inflection zone on the 4H chart. Price has tagged the premium zone and rejected with a weak high + CHoCH structure.
🎯 Current Thesis:
Entry Short: 5,998.3 → Price entered premium + inefficient zone
Price Target: 5,790.1 → Previous FVG + BOS retest zone
Reload Zone: 5,704.2 – 5,644.2 → Deep discount + mitigation area
🧠 Structure + Liquidity Logic:
BOS + CHoCH validated bearish intent.
Fib levels confirm confluence:
0.886 rejection (5,875.6)
Price now under key FVG
Distribution confirmed by swing failure at premium
📊 Gameplan:
Target first leg to 5,790, partial out.
Watch reaction for potential reload around 5,704 or deeper at 5,644 for continuation play.
Protect invalidation above 6,018 (weak high).
⏳ Context:
Volatility rising, internals weakening
Volume nodes support downside path
Fed in pause → market reevaluating risk premia
🏴☠️ Trade like smart money. Don’t chase price — wait for displacements, mitigations, and liquidity raids.
#SPX500 #SmartMoneyConcepts #Fibonacci #ShortSetup #OrderFlow #TradingView #BearishBias #PremiumRejection #IntradayStrategy #SMP500 #WaverVanir

update TP for NASDAQ i see more ups for NASDAQ .The Nasdaq index touched strong support, so I think it will rise further, as shown.


S&P500Both COT data and price action indicate the start of bearish momentum, making this a high-probability setup for a downside move Short Entry: Enter a short position due to the bearish setup.


SPX / SP500 Short - RISING WEDGE WARNINGYou can see the index is currently moving in a rising wedge, which is a bearish indicator once the structure breaks down. There might be a small upside for a very limited time, but mid-term we are moving down.
