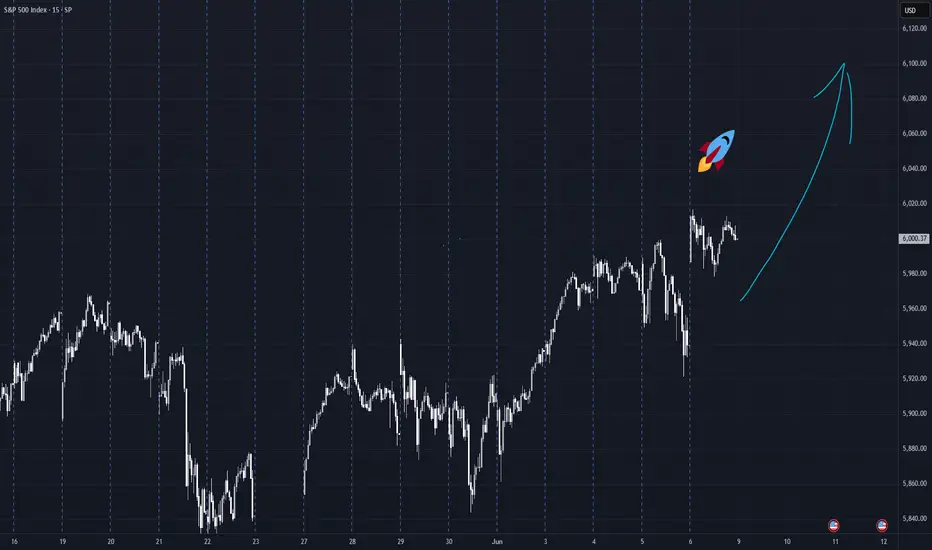
SPX'S BULLS !6200 Will get touched easily soon !
because the much vol up there waiting to be hunted at 6100+
𓄀𝓈𝓉𝒶𝓎 𝓉𝓊𝓃ℯ𝒹 𓃓
SPXM trade ideas

SHORT ON SPY (SPX/USD)SPY has failed to create higher highs and given us a head and shoulders pattern.
I will be selling spy to the next level of demand looking to catch 50-60 points.

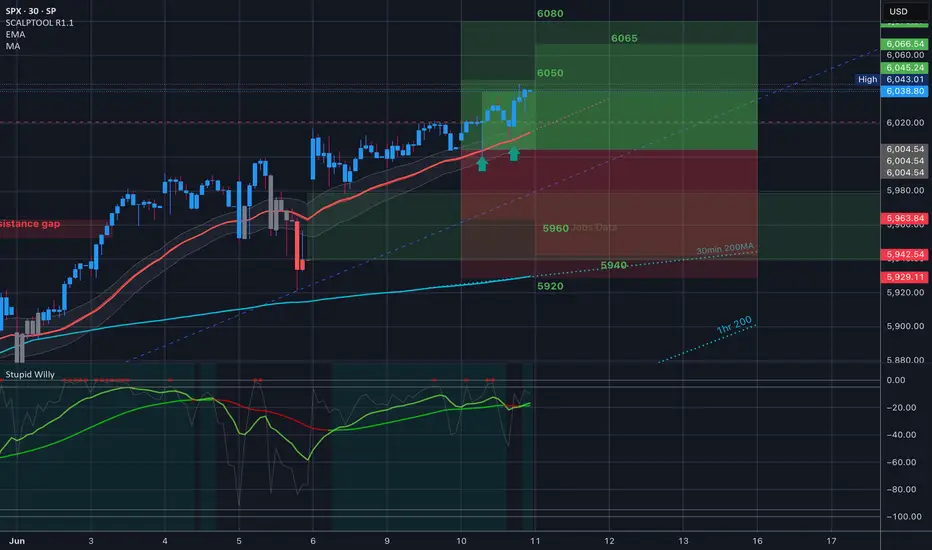
$SPX // June 10 2025 // Analysis & Targets for Day TradersWow!!! What a day!! This is the chart from premarket, and you can see that 35EMA catching us all day. The setup was there. Good Game!!
My 6050/6065 bear call spreads paid today!!
S&P 500 & Indexes Breakdown + Trade SetupsIn this video, I dive into the S&P 500 and other major indexes to share my current market outlook. Right now, price action is stalling and volume continues to dry up — a signal that we could be due for a deeper pullback before any continuation to the upside.
📌 With global fundamentals such as:
US–China trade tensions
Russia–Ukraine war
Broader geopolitical risks
…it’s hard to ignore the pressure building. That’s why I lean bearish in the short term, expecting potential downside before any breakout to new highs.
⚠️ Of course, trying to short in this slow grind can feel like catching a falling knife — but I’ve prepped a few setups, all broken down in the video based on solid technical confluences.
Watch the full breakdown and let me know your thoughts.
Thanks for tuning in! 🙏
👇 Drop a comment, like, and subscribe for more market breakdowns.
#SP500 #IndexBreakdown #MarketOutlook #TechnicalAnalysis #TradeSetups #BearishBias #VolumeAnalysis #GeoPolitics #SwingTrading #TradingCommunity #TradingView

SPX500 weekly overviewThis 6,136.54 calculated by 4821.59 and 3506.64 and worked really well as top of the SPX500!
Expect the zone around that line! All zones could be chosen to long the instrument.
4821.59 * 2 - 3506.64 = 6,136.54
The indicated levels are determined based on the most reaction points and the assumption of approximately equal distance between the zones.
Some of these points can also be confirmed by the mathematical intervals of Murray.
You can enter with/without confirmation. IF you want to take confirmation you can use LTF analysis, Spike move confirmation, Trend Strength confirmation and ETC.
SL could be placed below the zone or regarding the LTF swings.
TP is the next zone or the nearest moving S&R, which are median and borders of the drawn channels.
*******************************************************************
Role of different zones:
GREEN: Just long trades allowed on them.
RED: Just Short trades allowed on them.
BLUE: both long and short trades allowed on them.
WHITE: No trades allowed on them! just use them as TP points

Morning market ideasSPX could be finished overnight but the cash session may try to equal the overnight high. Gold is coming up to heavy resistance. Oil Looks to be heading towards 66 and maybe more. BTC looks like it may drop again but right now it's at support. Natural Gas is likely going to drop.

S&P500 INTRADAY uptrend continuation supported at 5960Key Support and Resistance Levels
Resistance Level 1: 6120
Resistance Level 2: 6170
Resistance Level 3: 6220
Support Level 1: 5960
Support Level 2: 5900
Support Level 3: 5800
This communication is for informational purposes only and should not be viewed as any form of recommendation as to a particular course of action or as investment advice. It is not intended as an offer or solicitation for the purchase or sale of any financial instrument or as an official confirmation of any transaction. Opinions, estimates and assumptions expressed herein are made as of the date of this communication and are subject to change without notice. This communication has been prepared based upon information, including market prices, data and other information, believed to be reliable; however, Trade Nation does not warrant its completeness or accuracy. All market prices and market data contained in or attached to this communication are indicative and subject to change without notice.

SPX500 Holds Steady as Markets Eye US-China Trade Developments SPX500 Overview
U.S. stock futures were little changed on Tuesday as investors awaited key developments from the U.S.-China trade talks underway in London.
Technical Outlook (4H Chart):
The index is experiencing cautious movement amid ongoing tariff tensions and geopolitical uncertainties.
Bullish Scenario:
A sustained 4H close above 6030 could confirm bullish momentum, with upside targets at 6066 and 6098, potentially extending toward a new all-time high (ATH).
Bearish Scenario:
As long as the price remains below 6010, bearish momentum may persist, targeting the support levels at 5966, followed by 5938 and 5902.
Support: 5966 • 5938 • 5902
Resistance: 6066 • 6098

Lack of momentum on Macd indicator on SPX Price action making new HIGH But MACD lines show slow momentum . Last 3 times this Happened and we saw a quick retest on 50 EMA .

S&P 500 update from last week📉 Lesson Learned – The Way of a Trader 📈
Well… this time I jumped the gun. Thought the market would break lower from a compression point, but I was wrong. Price pushed higher, broke the ascending channel upwards — and I paid the price 💸
Not much volume behind the move, but still... up is up.
I acted on a gut feeling, and that didn’t work out.
The mistake?
⛔ Tried to predict the top
⛔ Didn't wait for a confirmed break with volume
Now it’s time to:
✅ Review
✅ Re-evaluate
✅ Learn
✅ Come back stronger
We’re not always going to be right — and that’s part of the game.
Discipline beats ego.
Welcome to the life of a trader.
Let’s keep improving 🔁

Update SPX is still hovering at 90% from the top, Gold looks better now and probably goes higher, OIl the same, BTC should find resistance at 109k

US 500 Index – All Time Highs Back in SightFresh optimism regarding trade negotiations between the US and China, coupled with confirmation on Friday that the US labour market is cooling down slowly and not indicating an imminent US recession, has seen the US 500 index open this morning at 4 month highs, bumping up against the psychological 6000 again, with its all time peak of 6144 (February 19th) back in sight.
Looking forward, this could be a pivotal week for the US 500, with a variety of risk events for traders to consider, all of which may have the potential to impact the direction of risk sentiment into the Friday close.
First up, later today, traders will be eagerly awaiting updates from the second round of trade talks between US and Chinese trade teams, who are tasked with defusing tensions regarding the supply of rare earth minerals and advanced technology.
Then, on Wednesday (CPI 1330 BST) and Thursday (PPI 1330 BST) the next round of US inflation updates for May are released. These could be relevant to traders who have become more sensitive to potential price rises due to the impact of President Trump's trade tariffs. Any surprise deviations from expectations in either of these releases could see an increase in US 500 index volatility.
Putting this all together with any fresh reports outlining progress on trade deals between the US and Japan or the EU, and it could be a volatile week in store. With this in mind, it can be helpful to consider the technical indicators and trends.
Technical Update: Focus on the Bollinger Mid Average
While some may have argued for a slowing in upside momentum of the recent US 500 index advance, price weakness has continued to be limited in both time and extent.
Importantly, as the chart above shows, when short term setbacks in price have recently materialised, it has been the rising Bollinger mid-average that has marked a support focus.
This maintains the potential of a more constructive picture and positive price trend, where buyers have been happy to pay a higher price each time that weakness is seen, and have been able to push the index above previous peaks in price, to new recovery highs.
Of course, there is no guarantee this pattern of higher highs and higher lows in price will extend further, but traders may well be focusing on this type of pattern as having the potential to lead to a more sustained phase of price strength.
What are the potential support and resistance levels that traders may be watching this week for clues to the direction of the next possible price move?
Potential Resistance Levels:
Further evidence that a positive trend in price could still be in place came on Friday, as a new recovery price high at 6017 was posted.
Traders may now be watching how a previous price high at 6049, which was posted on February 24th is defended, as closing breaks may see further attempts to push to higher levels. Such moves could then lead to further price strength towards 6144, the February 19th all-time high.
Potential Support Levels:
Having held and turned price activity higher over previous tests, it may well still be the rising Bollinger mid-average, which currently stands at 5916 that represents a possible support focus this week.
Closes below this level while not confirmation of a more extended phase of price weakness, may see a deeper decline to test 5842, the May 30th session low, even on to the 5742 level, which is equal to the low posted on May 23rd.
The material provided here has not been prepared in accordance with legal requirements designed to promote the independence of investment research and as such is considered to be a marketing communication. Whilst it is not subject to any prohibition on dealing ahead of the dissemination of investment research, we will not seek to take any advantage before providing it to our clients.
Pepperstone doesn’t represent that the material provided here is accurate, current or complete, and therefore shouldn’t be relied upon as such. The information, whether from a third party or not, isn’t to be considered as a recommendation; or an offer to buy or sell; or the solicitation of an offer to buy or sell any security, financial product or instrument; or to participate in any particular trading strategy. It does not take into account readers’ financial situation or investment objectives. We advise any readers of this content to seek their own advice. Without the approval of Pepperstone, reproduction or redistribution of this information isn’t permitted.

The Second Blow-Offanyone casually looking at long-term charts can see in recent history on the monthly scale one of the most violent blow-off tops started In 1995-2000, running those 5 years up 240%. interestingly, my target and the number of years it takes to reach since the post-covid lows is almost the same


SPX500 – Volatile Week Ahead as Trade Talks and CPI LoomSPX500 | Overview
Fundamental Insight:
S&P 500 futures edged lower early Monday as traders brace for a high-impact week.
Key events include:
- US-China trade talks in London (Monday)
- U.S. inflation data (CPI) expected midweek (Wednesday)
Markets are cautious, awaiting clarity from both geopolitical developments and macroeconomic indicators, which could trigger strong directional moves.
Technical Outlook:
The price appears to be entering a correction phase, with the potential to drop toward 5966.
A confirmed break below 5966 may extend the bearish trend toward 5938 and 5902.
However, a break above 6030 would invalidate the bearish scenario and could trigger a bullish continuation toward 6098 and potentially a new all-time high (ATH).
Pivot Line: 6010
Support Levels: 5966, 5938, 5902
Resistance Levels: 6030, 6098

S&P500 Short: Ending DiagonalHi all, over here, I presented a cleaned-up chart of the EW counts for S&P500 and gave 2 entry points for shorting. The most important points are here:
1. 5th wave completion (or completing)
2. Ending Diagonal: will follow a sharp move down.
Alternatively, you can wait for a breakdown of the lower trendline to short.
Good luck!

You're all doomedEveryone has gone full bull again. The selloff is not over. The selloff is about to resume. The shorts are MIA. Down til Christmas. Starts this week.

SPX - way to ATH in June SPX with a gap just below last season, having all its SMAs aligned and head funds heavily short, I am sure we are on our way to new ATHs. A little shake out to find support on sma50 could be expected, but for now the strategy would be BTD! - no financial advice.

5821 target beaeish flowBeen awhile since I posted to spy channel.
Ive observed a negative flow, with a bearish apex on the 2hr futures chart. My target is 5820. Fail attempt to breakout above 600 on spy, this appears ro be a liquidity grab by smart moneym I will break chart down further into layers

SPX showing break from ascending triangleSPX500 futures daily chart showing break from ascending triangle. Expecting upside move towards 6100 in coming days

Remaining bullish on SPX and how I think through my chartsVideo Recap: The Zoomed Out View
Weekly moving averages are reordering and turning up
The weekly chart shows that the 10EMA and 20EMA have now crossed the 50SMA and are turning up. That reordering adds strength to the broader trend. This past week, the index reclaimed 6,000, which is a key psychological level. And we also saw price bounce off the uptrend line drawn from the April low, showing buyers are still defending key areas of support.
Daily pullback found support
The daily chart gave us a pullback the Friday before last, but it held right at a confluence of support (the 20EMA and 200SMA), along with a horizontal level drawn from the weekly timeframe.
Digestion periods can shake you out if you’re too zoomed in
The last few weeks have been a reminder that chop can test your patience and your plan. We didn’t break trend, we just pulled back to support. But if you’re too zoomed in, it can feel like everything is shifting. That’s when stops get hit early, trades get closed prematurely, and new positions get put on for the wrong reasons. In reality, this was just a normal digestion after a strong move. And when in doubt, zooming out brings the clarity back.
Trendlines and levels are guides, not absolutes
There were a few moments in my chart review this week where I caught myself trying to make lines matter more than they do. But these tools (trendlines, moving averages, support and resistance) only matter in the context of what price is doing around them. Structure tells the real story. One line getting hit or crossed doesn’t mean the whole thesis breaks down. What matters is whether buyers step in, whether trend resumes, and whether your trade idea still fits your system.
So what now? Here’s what I’ll be watching this week:
We’re holding above all major MAs.
If we push through the February all-time high, that can shift sentiment, especially for retail traders who may see that as a signal that “we’re in the clear.”
If we stall below the ATH, that wouldn’t be a problem by itself, but I’d watch how price behaves...ie are we pulling back constructively or losing key levels?
I’m not leaning bearish and won't be unless we start closing below 5,800 (200SMA) and definitely if we can't hold the rising 50SMA. (My second scenario after my bullish one is sideways, so bearish for me is out for now.)
When the market starts moving, the best thing you can do is trust your prep, lean into your plan, and zoom out when things get noisy. The bigger picture hasn’t changed.

RKLB Weekly Options Trade Plan – 2025-06-07🚀 RKLB Weekly Options Trade Plan – 2025-06-07
Bias: Moderately Bullish
Holding Period: 3–5 trading days
Catalyst: Trump–Musk headline cycle + strong short-term momentum
Timeframe: Expiry June 13, 2025
🔍 Multi-Model Consensus Summary
Model Direction Strike Entry Stop Target(s) Confidence
Grok No Trade – – – – 0%
Claude Long Call $30 $0.76 $0.38 $1.50 75%
Llama Long Call $30 $0.76 $0.57 $1.14 70%
Gemini Long Call $31 $0.49 $0.24 $0.74–$0.98 65%
DeepSeek Long Call $30 $0.76 $0.38 $1.52 70%
✅ Consensus: Buy $30 call expiring 2025-06-13
💬 4 of 5 models bullish; 3 aligned on same strike and premium
⚠️ Max pain at $26 and overbought daily RSI are top risks
📈 Technical Snapshot
Price Trend: Bullish short-term (price > EMAs on 5-min & daily)
RSI: Nearing overbought (RSI ~69)
MACD: Bullish short-term, weakening daily
Resistance: $29.00–$29.50
Support: $28.70–$28.75
✅ Trade Setup
Parameter Value
Instrument RKLB
Direction CALL (LONG)
Strike $30
Entry Price $0.76
Profit Target $1.14 (≈50% gain)
Stop Loss $0.38 (≈50% loss)
Size 1 contract
Expiry 2025-06-13 (Weekly)
Confidence 70%
Entry Timing At market open
⚠️ Key Risks
Max Pain Gravity: $26 could act as price magnet by end of week
Overbought Setup: Daily RSI + Bollinger breach may cap further upside
Exhaustion Signs: Bearish MACD divergence could lead to snap pullback
Momentum Trade: Must act quickly; trail stops if resistance nears
A little more upside for SPX500USDHi traders,
And again my previous outlook of SPX500USD played out as I've said. After a small correction we saw the continuation of the upmove to the Daily FVG.
Next week we could see price come into the Daily FVG and reject from there for a correction down.
Let's see what the market does and react.
Trade idea: Wait for a small correction down on a lower timeframe to trade short term longs into the Daily FVG.
If you want to learn more about trading FVG's & liquidity sweeps with Wave analysis, then please make sure to follow me.
This shared post is only my point of view on what could be the next move in this pair based on my technical analysis.
Don't be emotional, just trade your plan!
Eduwave
