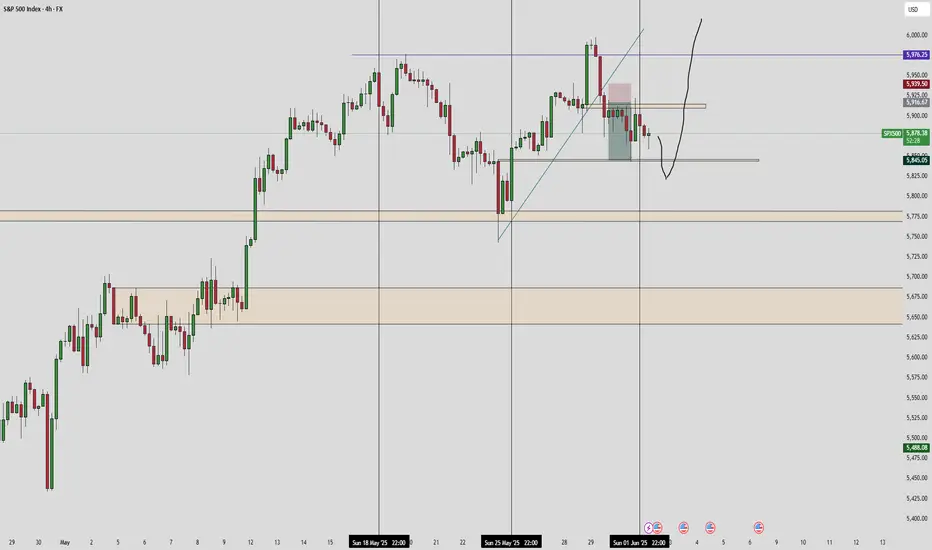
S&P500: Gearing up for a push to 6,100S&P500 is bullish on its 1D technical outlook (RSI = 64.611, MACD = 85.830, ADX = 19.630) as it has been trading inside a Channel Up for over a month. Right now it is halfway through the new bullish wave. We expect it to rise by at least +4.40%, same as the previous one. Stay bullish as long as the 4H MA50 holds, TP = 6,100.
## If you like our free content follow our profile to get more daily ideas. ##
## Comments and likes are greatly appreciated. ##
SPXM trade ideas

SP500 would you capture or just let it slip?His palms are sweaty
Knees weak, arms spaghetti
His nervous
But on the surface
He looks calm and ready

Acorn's Smart Money S&P SignalJune 3, 2025 - After another successful S&P signal in May, we have another Bullish signal for the first part of June. If correct, the bullish S&P indicator suggests the S&P will close above 5861.43 on June 19.

S&P 500 is Under Pressure from Weak ADP Data, Strong ResistanceThe S&P 500 is showing signs of contraction just below the key 6000 level. The ADP employment report, which revealed the slowest pace of hiring since March 2023, has raised some concern among investors. Whether this weak labor data will significantly impact the broader stock market remains to be seen.
Tariff effects appear to be gradually surfacing, first in jobless claims, then in the ISM manufacturing data, and now in the ADP report. Inflation data will likely be affected last, probably in a few months, due to the fact that both households and businesses frontloaded purchases ahead of the tariffs. As a result, the market could first confront recession fears, followed later by concerns about stagflation.
From a technical standpoint, a short-term RSI divergence is emerging, and the 6000 level is acting as strong resistance. If the S&P 500 fails to break above this resistance, a selloff could be triggered, with the 200-hour moving average as the initial target. Should the index fall below the 200-hour level, bearish momentum could increase, potentially deepening the correction.
To invalidate this negative scenario, the index would need a clear breakout above 6000, confirmed by multiple daily closes above that level.

Balance could break todaySPX may go higher but it could be a false break according to the RSI. Gold looks like it will go higher. USOIL is retreating from resistance so far. BTC still looks like it will drop.

US500 Bullish Outlook US500 Bullish Outlook
US500 is well-positioned for another upward wave.
The price is forming a bullish triangle pattern, suggesting further gains if it breaks above the pattern or surpasses 5990.
Key upside targets are 6100 and 6240.
Investors are closely watching any new trade deal. If Trump rejects any deal or issues threats, the US500 could temporarily fall to 5930 before resuming its rise.
So far, the overall trend remains bullish, with no signs of reversal as long as key levels hold.
You may find more details in the chart!
Thank you and Good Luck!
❤️PS: Please support with a like or comment if you find this analysis useful for your trading day❤️

S&P 500 is going in a ranging mode5704 is a historical key level, now we are slightly above it; for serious buyers we have to wait until the news; we will watch a retracement in this zone then we can take our position long

SPX Key Levels to Watch Jun 4 In today’s analysis of the S&P 500 (SPX), we’ll break down the crucial levels to watch as we head into June 4th. After perfectly testing the 5929 level yesterday, the market bounced back, setting the stage for potential moves. We’ll discuss the new support range between 5954 and 5967 and what it means for traders. If this range holds, we might see a rally towards 6165, but if it falters, a drop to 5850 could be on the horizon. These levels are highly actionable, so stay sharp and ready to react!

Something Brewing on SPXCup and handle brewing on the SPX daily. All time highs are near. See you there before the pullback

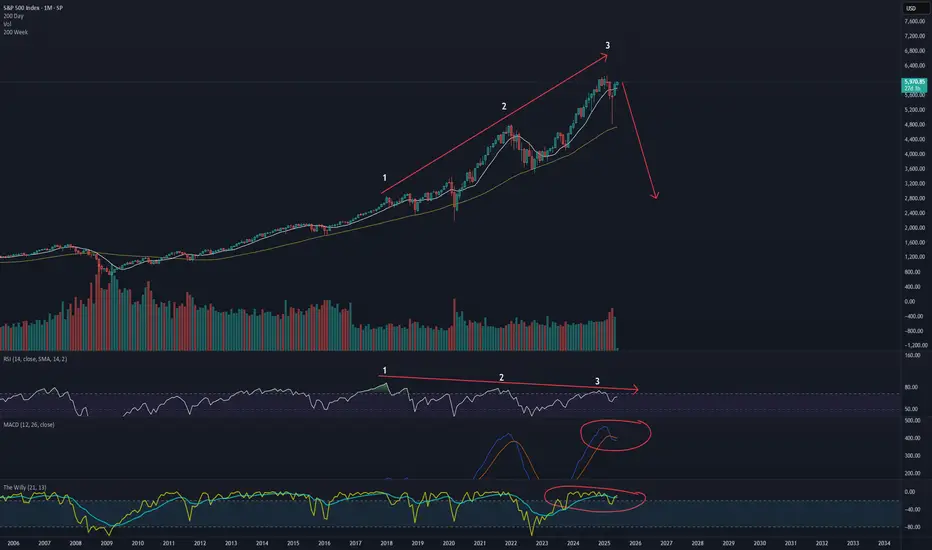
3 drives of bearish monthly divergence = bear market incoming"A bull market is like sex, it feels best just before it ends"
would like to draw attention to the bubble stocks and crypto right now, providing a definitive definition of mania.
The argument for a lost decade is in order.
The first decline in the spx will be aprox 55% to 2800, likely to recover its highs similar to how the market traded in the 1970's
Balance areas abound - SPX GOLD USOIL BTCBias still up on the markets with the target likely being the upper daily BB. Gold target reached and now taking a breather. USOIL may break up sooner than later. BTC looks like more downside is likely.

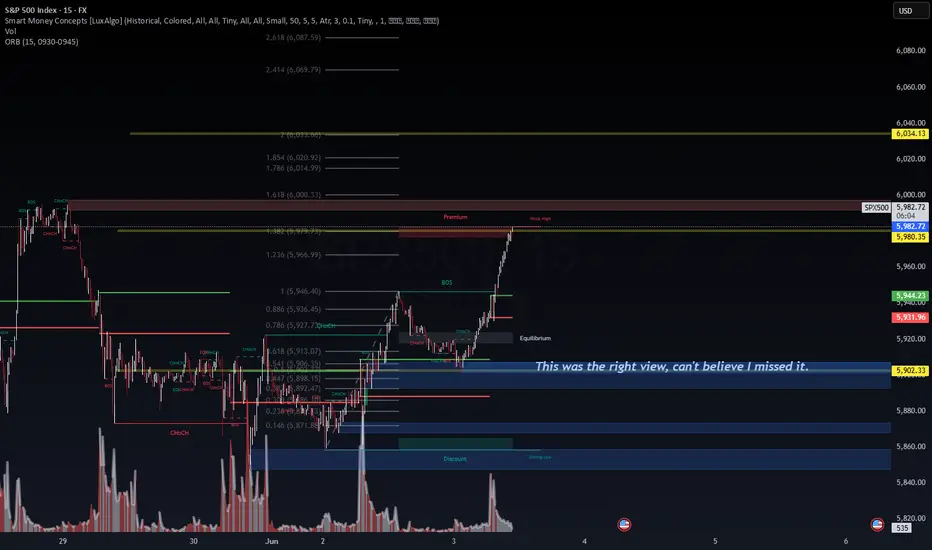
Updated Technical Analysis – SPX500 (15M)Published: June 3, 2025 @ 10:22 PST
🔍 Observations:
🔺 Price Context:
Currently trading at 5,982, right inside the premium + weak high zone
1.382 Fib extension = 5,979.73 has just been tagged
Next Fib levels:
1.618 = 6,000.33
2.0 = 6,034.13 (also long-term resistance target)
🧠 SMC & Liquidity:
BOS confirmed around 5,927
Multiple ChoCHs now invalidated = strength in the up move
Weak high at 5,980 likely acted as a liquidity magnet → now filled
📉 Risk Alert:
Low volume on the final leg up = signs of exhaustion
Price is now above key liquidity zones — perfect for a fake-out or reversal
🔁 Updated Probabilities (Intraday Outlook)
Direction Probability Reason
Bearish Reversal (today) 65% Liquidity sweep + premium zone rejection + volume divergence
Bullish Continuation (toward 6,034) 35% Momentum intact, if breakout holds and is supported by volume spike
🧠 Analyst Note:
"This was the right view, can’t believe I missed it."
— This quote fits perfectly here. The 5,902 zone (equilibrium) acted exactly as intended: a launchpad. Missing the move isn’t the problem — it’s not learning from it that is.
SPX500SPX500: Bullish Momentum Builds – 6500 in Sight?
📍 Current Price: 5977.00
📈 Bias: Strongly Bullish
🎯 Target: 6500+
📉 Invalidation Level: 5850 (Short-term support)
📊 Technical Outlook:
The SPX500 continues to show strong bullish momentum as it trades at all-time highs near 5977.00. With persistent buying pressure and supportive macro tailwinds, the index looks poised for further upside.
Key observations:
✅ Price Action: Clean breakout and consolidation above recent highs. No signs of exhaustion yet.
📈 Trend: Clearly up across all major timeframes (Daily, 4H, 1H).
🧠 Psychological Level: 6000 is within reach, and a break above could open the path toward 6500 as the next major round number and Fibonacci extension level.
💡 Market Sentiment: Risk-on tone prevails; tech and mega caps continue to lead.
🔍 Support & Resistance Levels:
Resistance: 6000 → 6150 → 6500
Support: 5900 → 5850 → 5735
⚠️ Risk Management:
While the setup remains bullish, traders should watch for:
Surprise macro headlines (Fed speeches, inflation data, geopolitical risks)
Pullbacks toward support for potential re-entries
📝 Conclusion:
SPX500 remains in a powerful uptrend. As long as price holds above key short-term support at 5850, bulls retain full control. A breakout above 6000 could trigger a fresh wave of institutional buying, driving price toward 6500 in the coming weeks.
📢 Let me know your thoughts — are we heading for 6500 next?
👍 Like & follow for more real-time market insights!

SPX500 Macro + Technical + Probabilistic AnalysisPublished: June 3, 2025
🔍 Chart Breakdown (Daily | LuxAlgo + EW + SMC)
Structure Summary:
🔶 Wave Count: Completing Wave (5), with price nearing exhaustion
🔴 Weak High Zone: ~6,100–6,200 = liquidity magnet
🟥 Premium Zone: Between current price and 6,426
🟦 Equilibrium Zone: ~4,950–5,150
🟩 Discount Zone: ~4,150 = long re-entry or cycle bottom if correction occurs
📅 Key Timing Line: June 17, 2025 = potential reversal date (time-based confluence)
Volume Analysis:
🔊 Volume spikes at Wave 2 and Wave 4 suggest reactive participation
📉 Lower volume into recent highs suggests distribution, not accumulation
🔁 Multi-Timeframe Outlook
Timeframe Direction Probability Rationale
Intraday (15M) Bearish 60% Weak high rejection, premium zone swept, liquidity-based reversal
Swing (2–3 weeks) Bullish → Bearish 70% to 6,420 → then reversal Wave 5 completion into supply zone, followed by corrective ABC
Macro (Q3–Q4 2025) Bearish 80% Likely mean reversion toward equilibrium (5,000) or discount (4,200)
📊 Key Price Zones to Watch
Level Label Strategy
6,426 🎯 Wave 5 Target Look for exhaustion, divergence, or liquidity sweep
6,150–6,200 🟥 Weak High / Premium Possible fake-out zone or reversal trigger
5,900 🔵 Short-term support Likely retest zone on first rejection
5,150–4,950 ⚖️ Equilibrium Mid-cycle mean reversion target
4,150 🟩 Discount/Strong Low Long reload zone if correction deepens
⚠️ Risk Considerations
Macro Data Watchlist: June 12 CPI + June 17 FOMC = macro catalysts for Wave 5 peak
Invalidation: If price holds above 6,450 after June 17, EW count must be adjusted
Alternative Count: Parabolic Wave 5 extensions can overshoot — be cautious shorting early

S&P 500 4 Hr. chart Impulsing towards 61251). Huge Volume! 2). Banks are Buying! 3). Breaking trendline on wave 3!

Bulls and Bears zone for 06-03-2025SPX has been trading in a range since mid May. Perhaps a pullback might be in the cards.
Level to watch: 5946 --- 5948
News to Watch:
US Factory Orders 10:00am
US JOLTS 10:00am

S&P500 Giant Inverse Head and Shoulders waiting for its breakoutThe S&P500 index (SPX) appears to be forming the Right Shoulder of a long-term Inverse Head and Shoulders (IH&S), the pattern that made the April 07 bottom of the Tariff War correction.
Currently supported by both its 1D MA50 (blue trend-line) and 1D MA200 (orange trend-line), once the overhead Resistance/ neckline breaks, we expect a +24.55% rise to the 2.0 Fibonacci extension, the equivalent of the rise it made from the April bottom up until now.
The target given is 7400.
-------------------------------------------------------------------------------
** Please LIKE 👍, FOLLOW ✅, SHARE 🙌 and COMMENT ✍ if you enjoy this idea! Also share your ideas and charts in the comments section below! This is best way to keep it relevant, support us, keep the content here free and allow the idea to reach as many people as possible. **
-------------------------------------------------------------------------------
Disclosure: I am part of Trade Nation's Influencer program and receive a monthly fee for using their TradingView charts in my analysis.
💸💸💸💸💸💸
👇 👇 👇 👇 👇 👇

SPX500 Rejection Confirmed – Bearish Setup UnfoldingThe S&P 500 has just rejected a strong supply zone around the 5,915–6,006 region, a level that previously acted as resistance in March. Price is showing early signs of weakness as sellers defend this area aggressively.
📌 Key Technical Levels:
🔵 Supply Zone (Resistance): 5,915–6,006
🔵 Next Support #1: 5,436 – Expect reaction or bounce here
🟠 Demand Zone (Major Support): 4,908 – Confluence with volume profile and previous swing lows
🔴 Price Action Insights:
Strong bearish reaction at the upper supply zone ✔️
Double rejection around 6,000 with a drop in bullish momentum 📉
Candlestick structure forming lower highs — early reversal signals
Red arrows indicate potential path if sellers maintain control
🧠 What I'm Watching:
🔽 If we break below 5,436 with volume, the next bearish target is 4,908
🔁 If bulls reclaim and close above 6,006, the bearish thesis is invalidated
🗓️ Keep in mind upcoming U.S. news events (NFP, CPI, FOMC) – shown on the chart – could fuel volatility and impact momentum.
---
💬 What’s your take? Are you shorting the SPX500 or waiting for confirmation?
📈 Drop your thoughts in the comments! Let’s trade smart.
#SPX500 #S&P500 #SupplyAndDemand #PriceAction #SmartMoney #TechnicalAnalysis #BearishSetup #TradingView #SP500Analysis #StockMarket

That's for My American FriendsGuys there's a LQ in there downside if you don't want to miss so you can enter but make sure your SL is large, but i suggest you wait for LQ taken, i know it's take time but Patiance Pays.. See You

SPX500 H1 | Potential bullish bounceSPX500 is falling towards a pullback support and could potentially bounce off this level to climb higher.
Buy entry is at 5,907.26 which is a pullback support that aligns with the 38.2% Fibonacci retracement.
Stop loss is at 5,838.00 which is a level that lies underneath a multi-swing-low support and the 61.8% Fibonacci retracement.
Take profit is at 5,995.10 which is a swing-high resistance that aligns with the 61.8% Fibonacci retracement.
High Risk Investment Warning
Trading Forex/CFDs on margin carries a high level of risk and may not be suitable for all investors. Leverage can work against you.
Stratos Markets Limited (tradu.com ):
CFDs are complex instruments and come with a high risk of losing money rapidly due to leverage. 63% of retail investor accounts lose money when trading CFDs with this provider. You should consider whether you understand how CFDs work and whether you can afford to take the high risk of losing your money.
Stratos Europe Ltd (tradu.com ):
CFDs are complex instruments and come with a high risk of losing money rapidly due to leverage. 63% of retail investor accounts lose money when trading CFDs with this provider. You should consider whether you understand how CFDs work and whether you can afford to take the high risk of losing your money.
Stratos Global LLC (tradu.com ):
Losses can exceed deposits.
Please be advised that the information presented on TradingView is provided to Tradu (‘Company’, ‘we’) by a third-party provider (‘TFA Global Pte Ltd’). Please be reminded that you are solely responsible for the trading decisions on your account. There is a very high degree of risk involved in trading. Any information and/or content is intended entirely for research, educational and informational purposes only and does not constitute investment or consultation advice or investment strategy. The information is not tailored to the investment needs of any specific person and therefore does not involve a consideration of any of the investment objectives, financial situation or needs of any viewer that may receive it. Kindly also note that past performance is not a reliable indicator of future results. Actual results may differ materially from those anticipated in forward-looking or past performance statements. We assume no liability as to the accuracy or completeness of any of the information and/or content provided herein and the Company cannot be held responsible for any omission, mistake nor for any loss or damage including without limitation to any loss of profit which may arise from reliance on any information supplied by TFA Global Pte Ltd.
The speaker(s) is neither an employee, agent nor representative of Tradu and is therefore acting independently. The opinions given are their own, constitute general market commentary, and do not constitute the opinion or advice of Tradu or any form of personal or investment advice. Tradu neither endorses nor guarantees offerings of third-party speakers, nor is Tradu responsible for the content, veracity or opinions of third-party speakers, presenters or participants.

S&P turns flat after bouncing off lows
The S&P 500, which ended Friday's session flat, has turned flat in today's session as well, after bouncing back from its earlier lows on reports that the US and Chinese leaders will meet to discuss trade after the two sides accused each other of violating their recent trade deal.
June could be a more challenging month for stocks if trade uncertainty persists, following what had been a strong May for global equities—marking their best monthly performance since November 2023. Much of that rally was driven by optimism that the worst of the US tariff threats had passed, encouraging investors to return to risk assets. However, any sense of calm was quickly disrupted after in the last few days, when Trump announced plans to double tariffs on steel and aluminum from 25% to 50%. This move has reignited concerns about a potential resurgence of trade tensions, adding to the already growing list of market risks. On top of that, investors are also bracing for political gridlock in Washington, as lawmakers prepare to negotiate a sweeping tax and spending bill amid escalating concerns about US government debt. With the debt ceiling deadline approaching, June could bring renewed market volatility, casting a cloud over the near-term S&P 500 outlook.
From a technical point of view, the trend is bullish but the doji candles in the last few trading sessions suggest that the momentum is waning and that a bit of a pullback could be on the cards.
Resistance at 5,900 was being tested at the time of writing. A daily close above this level would be a bullish outcome, in which case a run towards last week's high near 6,000 could be on the cards.
However, if resistance at 5,900 holds, then a potential drop to the next support area around 5787 would be the more likely outcome first. Further support is seen between 5,670 to 5,695.
By Fawad Razaqzada, market analyst with FOREX.com

S&P INTRADAY corrective pullback - pivotal zoneMacro & FX Outlook
Morgan Stanley forecasts a 9% decline in the US dollar by mid-2026, driven by a slowing US economy and expected Fed rate cuts.
Trading implication: Long positions in EUR, GBP, and other G10 currencies may benefit as USD weakens. Watch for renewed momentum in carry trades and emerging market FX.
Geopolitics
Ukraine-Russia conflict escalates with Ukrainian drone strikes hitting deep into Russia (including Siberia) and Moscow launching one of its most sustained aerial attacks.
Peace talks are expected in Turkey today.
Trading implication: Elevated geopolitical risk could support safe havens (gold, CHF, USD short-term) and oil prices, depending on energy infrastructure vulnerability.
UK Defense Spending
The UK will allocate £15 billion to expand its nuclear warhead program, new attack submarines, and build munitions factories.
Trading implication: Likely to support defense sector stocks and raise questions around fiscal policy ahead of elections; may contribute to upward pressure on gilts if deficits widen.
Poland Political Shift
Nationalist Karol Nawrocki wins presidential election, a setback for Poland’s pro-EU coalition government.
Trading implication: Potential increase in EU policy friction. May weigh on Polish assets and zloty (PLN) in the short term.
US Debt Ceiling & Diplomacy
Treasury Secretary Scott Bessent assured markets the US will not default but gave no timeline on cash exhaustion.
Also noted a Trump–Xi call is imminent, aiming to ease US-China tensions.
Trading implication: Uncertainty over Treasury liquidity may raise short-term bill yields. Any improvement in US-China relations could lift global risk sentiment and Chinese equities.
Key Support and Resistance Levels
Resistance Level 1: 6010
Resistance Level 2: 6070
Resistance Level 3: 6160
Support Level 1: 5780
Support Level 2: 5740
Support Level 3: 5700
This communication is for informational purposes only and should not be viewed as any form of recommendation as to a particular course of action or as investment advice. It is not intended as an offer or solicitation for the purchase or sale of any financial instrument or as an official confirmation of any transaction. Opinions, estimates and assumptions expressed herein are made as of the date of this communication and are subject to change without notice. This communication has been prepared based upon information, including market prices, data and other information, believed to be reliable; however, Trade Nation does not warrant its completeness or accuracy. All market prices and market data contained in or attached to this communication are indicative and subject to change without notice.

S&P 500"The S&P 500 is showing a bullish trend on the monthly chart, which means as we enter a new month (June), we're looking for a healthy pullback to position for long entries. Fingers crossed!"