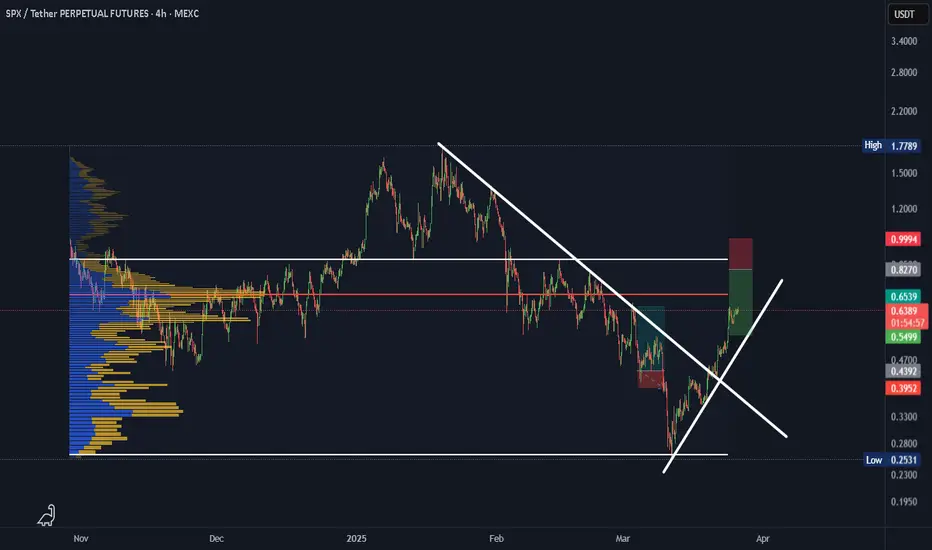
SPX | HTF Breakout Confirmed, Watching for Pullback EntryHTF still bullish — watching W iFVG & weekly OB below as major bid zone.
Breakout to 2.13 next if structure holds.
Lose W OB? Full reset.
Best R:R for swings if we get a flush into 0.75–0.95.
SPXUSDT trade ideas

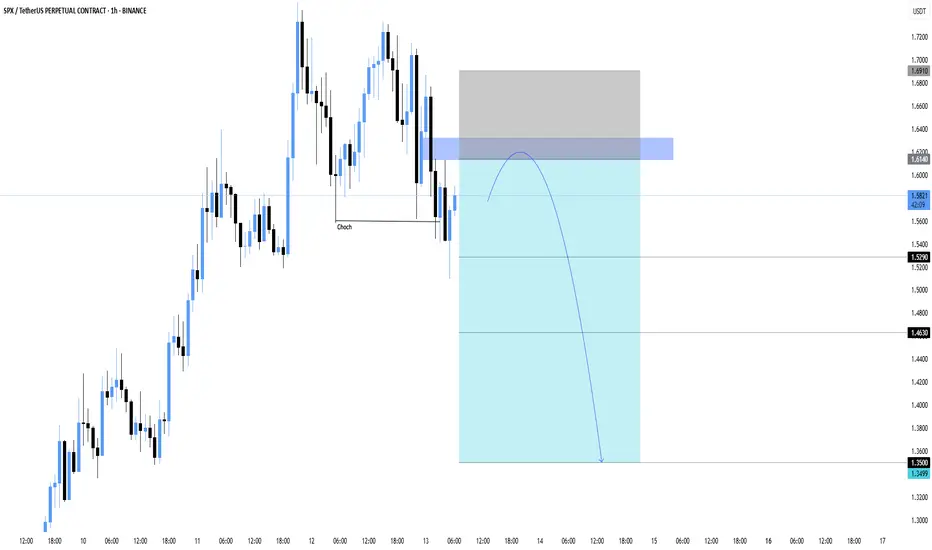
SPX/USDT — Change of Character Signals Bearish Move Incoming The structure has shifted with a clear CHoCH (Change of Character), suggesting that bullish momentum is weakening. Price recently pulled back into a supply zone around 1.6140–1.6910, setting up a potential short opportunity.
🔍 Technical Breakdown:
Price broke below recent higher low = CHoCH confirmed
Bearish BOS followed by retracement into premium zone (FVG/Supply)
Expecting rejection and continuation to downside if price fails to reclaim 1.6140
🔧 Trade Plan:
Entry Area: 1.6140
Stoploss: Above 1.6910
Targets:
• TP1: 1.5290
• TP2: 1.4630
• TP3: 1.3500
This setup aligns with internal structure + supply zone + CHoCH. Wait for confirmation candle or bearish engulfing in entry area before executing.
SPX SHORT SETUP SPX SHORT SETUP
ENTRY : 1.3416
PROFIT : 0.7648
STOP : 1.5336
ALL trading ideas have entry point + stop loss + take profit + Risk level.
hello Traders, here is the full analysis for this pair, let me know in the comment section below if you have any questions, the entry will be taken only if all rules of the strategies will be satisfied. I suggest you keep this pair on your watchlist and see if the rules of your strategy are satisfied. Please also refer to the Important Risk Notice linked below.
Disclaimer

SPXUSDT Wave Structure and Bullish OutlookAfter a clean break from the descending structure, SPXUSDT established a solid base within the strong demand zone, followed by a bullish pennant breakout.
The wave count suggests the current move is targeting the $1.77 zone as wave (3) before a minor correction for wave (4), with the projected end of this bullish cycle aiming around $3.20. Immediate support remains at $1.14, and invalidation only occurs on a break below the previous base. Structure remains bullish unless proven otherwise.

SPX Technical Analysis – Bullish StructureSPX Technical Analysis – Bullish Structure
The overall trend of SPX appears bullish, and based on the current structure, the asset shows potential for a 20% upside, with a possible move toward the $1.25 level.
Key support zones to watch are:
$0.90, which is approximately 11% below the current price
$0.80, which is around 21% below and can be considered the main support
As long as the price holds above these key levels and the bullish trend remains intact, the outlook stays optimistic for further upward continuation.
📌 This analysis is for educational and informational purposes only and does not constitute financial advice.
📝 Follow for more updates on SPX and other assets

SPXUSDT bounce setup — Low Conviction Play Off Demand ZoneMEXC:SPXUSDT is testing a demand zone built from the H1 order block + H4 swing failure pattern (SFP). While the structure remains weak, the current zone offers bounce potential — but conviction is low.
Setup:
🟩 Demand Zone: $0.90–$0.93
• Area of previous demand, also aligned with SFP
• Bounce possible, but high risk of fading without strength
🎯 First Target: $1.11 (Daily S/R)
🟥 Major Resistance: $1.20 — monthly level, likely hard cap
🚫 Invalidation:
• Clean break below $0.90 opens door to deeper drop
• No setup continuation if zone fails to hold
Plan:
• Short-term bounce trade only
• Not a high conviction long — manage risk closely
• Reassess if reclaim and structure form above $1.00+
📌 Dead cat bounce potential — keep stops tight and expectations measured.

SPX6900After hitting the 1.2000 level, SPX6900 has been failing to break above and created a key resistance on the intraday/4h chart at 1.1700 level. After multiple failed attempts to break 1.1700, price has slowed down and found support at the 0.9900 level, which I consider a key weekly level.
A slow build-up of momentum has taken price from the weekly support back towards 1.1700 level for another potential attempt at breaking the resistance. With the new month ongoing and general cycle on BTC still bullish (BTC above EMA50), I expect a successful breakthrough from the current price action.
Looking to trade the SPX futures towards next weekly level of 1.6500 and above to price discovery as soon as a clear break of structure is confirmed on the 1-hour timeframe and price closes above 1.1100, to which at this point I have about 3 minutes to go.
No clear stop loss however, IF price continues to fall and 4h closes below 0.98, I will consider the market to have turned bearish and close my trade.

SPX/USDTKey Level Zone: 0.9650 - 0.9950
HMT v8.1 detected. The setup looks promising, supported by a previous upward/downward trend with increasing volume and momentum, presenting an excellent reward-to-risk opportunity.
HMT (High Momentum Trending):
HMT is based on trend, momentum, volume, and market structure across multiple timeframes. It highlights setups with strong potential for upward movement and higher rewards.
Whenever I spot a signal for my own trading, I’ll share it. Please note that conducting a comprehensive analysis on a single timeframe chart can be quite challenging and sometimes confusing. I appreciate your understanding of the effort involved.
Important Note :
Role of Key Levels:
- These zones are critical for analyzing price trends. If the key level zone holds, the price may continue trending in the expected direction. However, momentum may increase or decrease based on subsequent patterns.
- Breakouts: If the key level zone breaks, it signals a stop-out. For reversal traders, this presents an opportunity to consider switching direction, as the price often retests these zones, which may act as strong support-turned-resistance (or vice versa).
My Trading Rules
Risk Management
- Maximum risk per trade: 2.5%.
- Leverage: 5x.
Exit Strategy
Profit-Taking:
- Sell at least 70% on the 3rd wave up (LTF Wave 5).
- Typically, sell 50% during a high-volume spike.
- Adjust stop-loss to breakeven once the trade achieves a 1.5:1 reward-to-risk ratio.
- If the market shows signs of losing momentum or divergence, ill will exit at breakeven.
The market is highly dynamic and constantly changing. HMT signals and target profit (TP) levels are based on the current price and movement, but market conditions can shift instantly, so it is crucial to remain adaptable and follow the market's movement.
If you find this signal/analysis meaningful, kindly like and share it.
Thank you for your support~
Sharing this with love!
HMT v2.0:
- Major update to the Momentum indicator
- Reduced false signals from inaccurate momentum detection
- New screener with improved accuracy and fewer signals
HMT v3.0:
- Added liquidity factor to enhance trend continuation
- Improved potential for momentum-based plays
- Increased winning probability by reducing entries during peaks
HMT v3.1:
- Enhanced entry confirmation for improved reward-to-risk ratios
HMT v4.0:
- Incorporated buying and selling pressure in lower timeframes to enhance the probability of trending moves while optimizing entry timing and scaling
HMT v4.1:
- Enhanced take-profit (TP) target by incorporating market structure analysis
HMT v5 :
Date: 23/01/2025
- Refined wave analysis for trending conditions
- Incorporated lower timeframe (LTF) momentum to strengthen trend reliability
- Re-aligned and re-balanced entry conditions for improved accuracy
HMT v6 :
Date : 15/02/2025
- Integrated strong accumulation activity into in-depth wave analysis
HMT v7 :
Date : 20/03/2025
- Refined wave analysis along with accumulation and market sentiment
HMT v8 :
Date : 16/04/2025
- Fully restructured strategy logic
HMT v8.1 :
Date : 18/04/2025
- Refined Take Profit (TP) logic to be more conservative for improved win consistency

SPX/USDT Breakout SPXUSDT:
SPX is now trading around $0.7255. #SPX has already broken out of the bull flag pattern and looks bullish. So, the possible scenario is that, as a bull flag is a bullish pattern, we can expect bullish momentum. Otherwise, if the price dumps and trades inside the bull flag channel, the breakout will be considered a fakeout. Keep an eye on it.

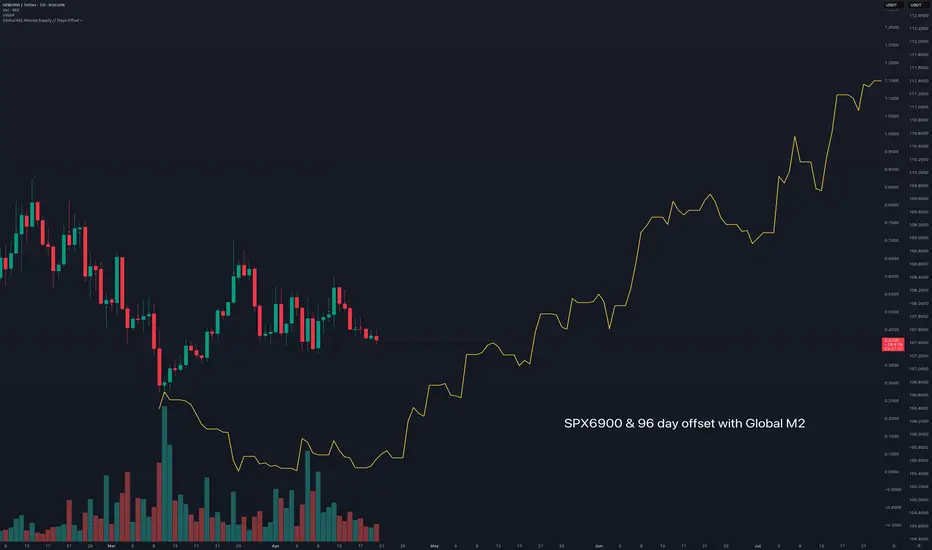
$SPX6900 following Global M2 money supplyFollowing Colin Talks Crypto's BTC & Global M2 money supply.
I'm using his script to generate global M2, in his version there is a 108 day - 86 day offset.
Here with SPX I adjusted to between that range at 96 days.
This sets up a strong outlook for SPX6900 going into the new few months.


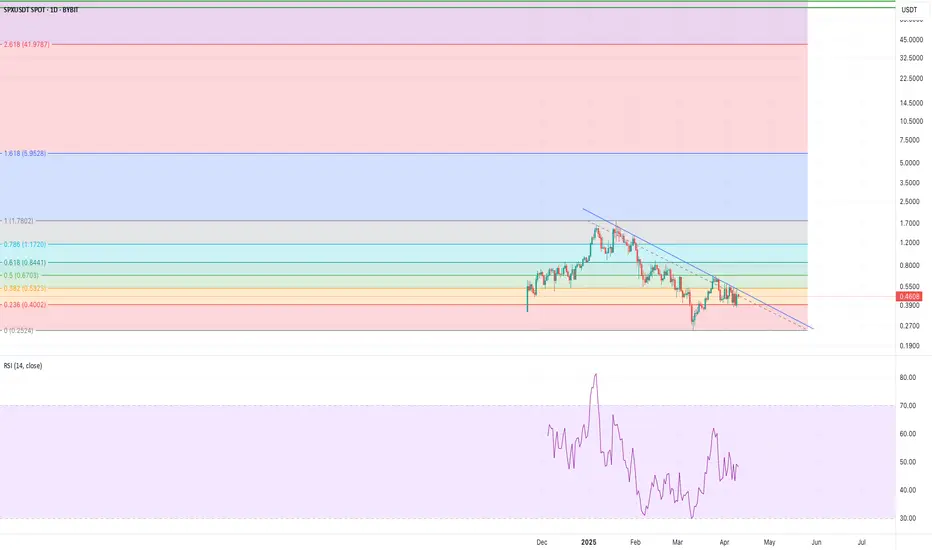
SPX Million fibsThis chart highlights the current Fib extensions I'm keeping an eye on. Murad's $100 target suggests it might be smart to start scaling out around the $80–$90 range—taking profits gradually before the euphoria phase kicks in.
Buying SPX — $0.40 Is a Key LevelI'm entering a position on SPX.
The $0.40 zone has proven to be a "strong support" — even when major tokens were dropping, SPX consistently got bought up at this level.
Now we’re testing it again — and the market is showing signs of exhaustion on the sell side.
📌 Look at the chart:
• Coinbase Premium is heavily negative — but price is holding
• RSI is near oversold — with a chance of reversal
• $0.40 is acting like a psychological and technical wall
This is where "strong hands" tend to step in.
Don’t ignore the tape — someone is defending this zone.
🚀 If you believe in this analysis, hit "Boost" so others don’t miss the opportunity.
— Alex

SPXUSDT manipulated rise before the fallThe market is pulling back after a strong drop in the Asian session. At the moment, while bitcoin is showing -2%, BINANCE:SPXUSDT.P is accelerating by 15% in the hunt for liquidity.
Possible entry into liquidity zone and false resistance breakout
False resistance breakout
1) 0.5473
2) 0.6689
Market is bearish, no hint of growth
A pullback is forming with the aim of accumulation or liquidity before continuing the fall
The fall may continue after the bitcoin correction is over

SPXUSDT – Local Buyer Interest or a Temporary Relief?I’ve developed a Pine Script that generates buy alerts based on RSI and volume behavior.
If you're interested in trying it out — leave a comment, and I’ll share the code with you directly.
On the **SPXUSDT (1H, Bybit)** chart, we’re observing a sharp sell-off with a breakdown below the key dynamic support – **EMA 200**. However, the current structure shows signs that are relevant for a **cautious DCA entry strategy**.
---
🔍 **Technical Context:**
- **EMA 9 < EMA 21 < EMA 200** – a clearly bearish alignment.
- Price has moved aggressively below all key moving averages, but the latest candle shows a **bounce with increasing volume**.
- **RSI Indicators:**
- **RSI (14): 28.92** – firmly in the **oversold** zone.
- **RSI EMA: 37.28** – RSI remains below its average, showing bearish pressure.
- **Cautious DCA on Dips** strategy has triggered **two consecutive buy signals** near the local bottom.
- Initial support forming between **0.4430–0.4460**, which could serve as a DCA zone.
---
📈 **Volume Insight:**
The spike in volume hints at **localized demand** — either from short-sellers closing positions or early accumulation attempts by buyers reacting to oversold levels.
---
⚠️ **Cautionary Notes:**
- **RSI has not yet crossed its EMA to the upside**, which means a reversal is not confirmed.
- Without a breakout above **EMA 9 and EMA 21**, any bounce should still be considered **corrective**.
---
✅ **Strategic View:**
- This zone may be appropriate for **initial DCA entries**, but should be approached with **risk-managed scaling**.
- Key confirmation would be a **bullish RSI crossover above its average**, followed by **EMA 9 crossing EMA 21**.
---
💬 Drop your thoughts in the comments – are we seeing early accumulation or just another trap in a downtrend?

SPXUSDT – Short-Term Weakness LikelyPrice action is showing signs of exhaustion after a failed attempt to break above 0.5530 .
Bollinger Bands are squeezing — incoming move likely. Bias: bearish.
---
Key Observations:
- Bearish RSI divergence – lower momentum despite higher highs.
- EMA9 / EMA21 support still holding, but momentum is fading.
- Coinbase Premium at -25 – signals institutional sell pressure.
- Volume declining on green candles — weak confirmation.
---
Support Levels:
- 0.5250 – EMA21 zone
- 0.5145 – Bollinger mid-band / previous base
- 0.5000 – psychological round level + volume shelf
Break below 0.5145 unlocks downside space toward 0.5000.
Expecting short-term correction before potential reload.
---
No emotional trades — just levels, structure, and execution.
#SPXUSDT #crypto #technicalanalysis #priceaction #RSI #EMA #BollingerBands #supportresistance #psychology #tradingview

Liquidity Spike or Trap?The recent price expansion in SPXUSDT, reflecting a +5% gain, may initially suggest a bullish breakout. However, a deeper analysis of the structure and market psychology reveals signs of potential exhaustion rather than genuine strength:
- RSI: Approaching 65, hovering near overbought territory, typically signaling late-stage long entries.
- Coinbase Premium: Persistently negative around -35, indicating that spot-driven demand is not following price — a strong divergence and cautionary signal.
- Volume: While elevated on SPX, ETH fails to confirm with momentum or volume, highlighting a cross-asset disconnect.
- Bollinger Bands: Price is pressing against the upper band, suggesting volatility expansion. Without consolidation or continuation, this often resolves in mean reversion.
- EMA structure: Short-term bullish crossover is in place, but lacking macro confirmation or synchronized sector strength.
ETHUSDT, meanwhile, remains flat and constrained within its bands. RSI sits below 57, and volume remains neutral. This further confirms the asymmetry and lack of true trend conviction.
Assessment: The current market behavior aligns with a liquidity sweep or false breakout setup. These are typically initiated to trap breakout traders and reset leveraged positioning. Based on volume analysis and behavioral indicators, there is a ~70% probability this move will retrace.
Key levels to monitor for potential re-entry or validation:
- SPXUSDT: 0.500–0.495
- ETHUSDT: 1802–1795
If price fails to hold above these zones with supporting volume and premium shifts, continuation is unlikely. Exercise caution.
Conclusion: What we’re observing is most likely a controlled liquidity event, not a structural reversal. Maintain strategic discipline and do not mistake engineered volatility for sustainable trend formation.

Breaking: SPX6900 ($SPX) Surged 23% Today Amidst Market TurmoilThe price of SPX6900 ( SP:SPX ) Surged 23% today amidst market volatility. Albeit it wasn't only the crypto industry undergoing correction, the stock market has had its own fair share of the dip with about $1.5 trillion wiped out from US stock market at open today.
As of the time of writing, SP:SPX is up 16.36%, there is still room for price surge as hinted by the RSI at 53. A breakout above the 1-month pivot could cement the path for a move to the $1 pivot.
Similarly, a break below the 50% Fibonacci level could negate the aforementioned bullish thesis leading to a consolidation move to the 1-month low region.
SPX6900 Price Live Data
The live SPX6900 price today is $0.537989 USD with a 24-hour trading volume of $58,478,403 USD. SPX6900 is up 18.38% in the last 24 hours. The current CoinMarketCap ranking is #100, with a live market cap of $500,863,790 USD. It has a circulating supply of 930,993,090 SPX coins and a max. supply of 1,000,000,000 SPX coins.

Market Outlook – April 4, 2025Hey everyone, just sharing my thoughts on the current market situation based on recent developments and upcoming events.
1. Tariff Announcement Shockwave
Yesterday's announcement from former President Trump regarding significant import tariffs has already triggered strong market reactions. We saw a sharp drop in SPX and related assets , with nearly 30% lost at one point. This kind of aggressive protectionist policy adds heavy pressure to an already fragile market.
2. Upcoming NFP and Unemployment Data
We’re now awaiting today’s Non-Farm Payrolls and Unemployment Rate data (12:30 UTC).
- Forecast: NFP at 135k (vs. previous 151k)
- Unemployment Rate: 4.1% (same as previous)
If these come in weaker than forecast, this may confirm slowing economic conditions, increasing downside pressure.
3. Powell’s Speech Later Today
At 15:25 UTC, Fed Chair Powell is set to speak. This could be a major turning point , depending on whether he addresses the tariff situation or hints at monetary policy support.
If he avoids the topic or stays hawkish, we could see more selling ahead.
4. What I’m Watching
- SPX approaching resistance at 0.508–0.510 with decreasing momentum (look at RSI divergence).
- Coinbase Premium remains negative overall, indicating cautious institutional sentiment .
- Volumes have picked up, which might suggest distribution rather than healthy accumulation .
Conclusion:
Personally, I remain cautious . This recent rise could be a bull trap , especially ahead of such high-impact events. Unless the data surprises to the upside and Powell offers dovish signals, I’m expecting increased volatility and possibly more downside.
Stay sharp, protect your capital.

What's next?
- EMA 9/21: Clearly broken above and now being tested as support
- Bollinger Bands: Price touched the upper band — possible overbought condition
- Coinbase Premium: +15.56 — rare! Indicates real spot demand
- RSI: 66.12 — approaching overbought territory, suggesting momentum is weakening, but not yet at an extreme level
✅ Positives:
- The price rally is supported by volume (SPX)
- RSI is climbing, but not at extreme levels yet
- EMA 9 > EMA 21 — a strong bullish signal
- Coinbase Premium turned positive for the first time in hours — a significant shift
⚠️ Warning signs:
- SPX is overheated on RSI — potential short-term profit-taking or pullback ahead
- Price is above the upper Bollinger Band — often followed by a correction
- ETH hasn't caught up with the momentum — potential divergence risk
We’re currently seeing a genuine momentum, not just manipulation — but it’s already entering a potential profit-taking or pause zone.
If the next candle prints a long upper wick and volume drops, a pullback is likely.

LIMIT ORDER - $SPX/USDTLIMIT ORDER - $SPX/USDT
Direction: #Short 🔴
Entry Price: 0.42540
Stop Loss: 0.45932
Target 1: 0.40855
Target 2: 0.39170
Target 3: 0.37485
Target 4: 0.35800
Target 5: 0.34116

SPX SHORT SETUP ALL trading ideas have entry point + stop loss + take profit + Risk level.
hello Traders, here is the full analysis for this pair, let me know in the comment section below if you have any questions, the entry will be taken only if all rules of the strategies will be satisfied. I suggest you keep this pair on your watchlist and see if the rules of your strategy are satisfied. Please also refer to the Important Risk Notice linked below.
Disclaimer