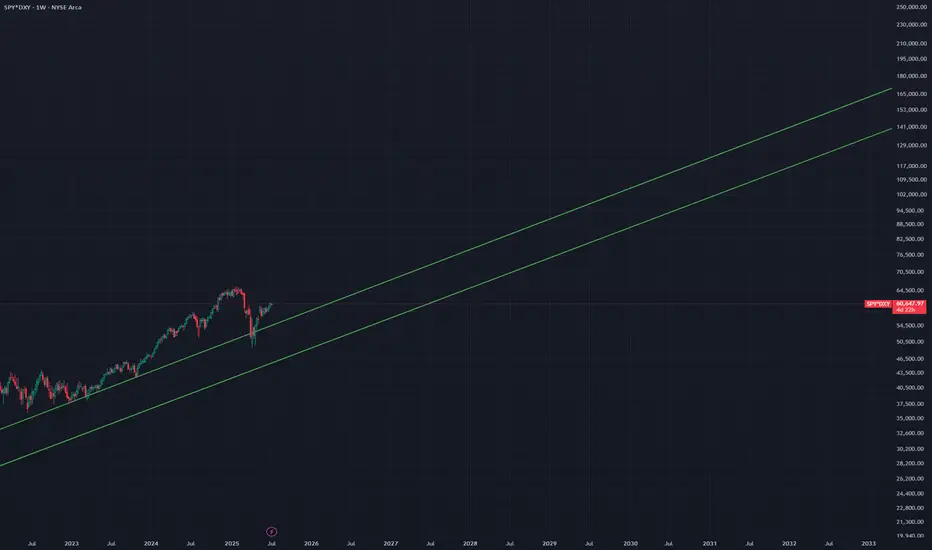
Real SPY vs DevaluationMacro traders and swing traders often employ this type of analysis to comprehend broader economic trends.
Particularly, the inverse correlation between a strong USD and equity markets.
SPY trade ideas
SPY Rejected at Gamma Wall–Watch $610 Breakdown or $615 Reclaim🧠 GEX-Based Options Sentiment:
SPY closed Friday with a rejection off the Highest Positive Net GEX / Gamma Wall at $615, with sellers defending the upper structure near the 2nd Call Wall at $620.
Support now lies in the $608–$604 range, with $605.54 and $604.45 aligning with GEX magnets and prior structure. Below that, there’s a gap to the HVL zone near $599, and the gamma floor starts deep around $591, which is also defended by the 2nd and 3rd PUT Walls.
Implied Volatility Rank is 12.2, with IVX below average. This implies premium selling could be dominant unless we break key levels. Meanwhile, PUT flow dominates at 31.9%, showing a clear defensive posture by institutions.
🔧 Options Trade Setup (for Monday–Wednesday):
Bearish Setup:
If SPY confirms under $610, especially during the first hour Monday, it could trigger a fade toward $605 or even $599 HVL.
Consider a PUT debit spread like 610p/600p (Jul 3).
Stop out if price reclaims $613.50–$615 cleanly.
Bullish Setup:
If SPY holds $610 and reclaims $615 with force, it can squeeze into the GEX void toward $620–$622.
Consider a CALL debit spread like 615c/620c (Jul 3).
Stop if price breaks back under $610 with volume.
📉 Intraday Technical Breakdown (1H Chart):
We now have back-to-back CHoCHs printed below rising wedge structure, followed by a failed retest at the top. This is a textbook sign of exhaustion. The final BOS and CHoCH from Friday confirmed that buyers lost short-term control.
The current structure is rolling over with lower highs, and SPY is now trading inside a descending micro-channel after rejection at $615.
Volume picked up on the Thursday/Friday rejection, which adds weight to the downside scenario unless we open strong Monday.
📌 Key Levels to Watch:
$617.00 – Upper Gamma ceiling
$615.00 – Gamma Wall & recent supply zone
$613.50 – Mid-level rejection pivot
$610.00 – Structure support now under threat
$608.48 – Intraday gamma magnet
$605.54 / $604.45 – Strong confluence support zone
$599.49 – HVL target zone
$591.90 – Gamma floor if broader selloff triggers
✅ Thoughts and Monday Game Plan:
SPY looks vulnerable under $610 — this is the most important level to watch. If that breaks and holds below in the first 30–60 minutes, we likely fade to $605 or lower.
The ideal trade setup would be to short the retest of $610 from below, or buy PUTs on confirmed weakness into the gamma air pocket. Alternatively, wait for a high-volume reclaim of $615 to trade with the bulls, but until then, the path of least resistance is down.
Macro catalysts are light, but pre-holiday positioning could bring volatility — stay nimble.
Disclaimer:
This analysis is for educational purposes only and not financial advice. Always use proper risk management and trade with a plan.

Market BreadthMarkets are still in 'Bull' mode going into the 4th. Keeping a eye on the 9-EMA which I use as a trailing stop on my long positions. Not likely to pick up any new positions for now.

SPY Technical Analysis! SELL!
My dear followers,
I analysed this chart on SPY and concluded the following:
The market is trading on 614.85 pivot level.
Bias - Bearish
Technical Indicators: Both Super Trend & Pivot HL indicate a highly probable Bearish continuation.
Target - 586.37
Safe Stop Loss - 631.68
About Used Indicators:
A super-trend indicator is plotted on either above or below the closing price to signal a buy or sell. The indicator changes color, based on whether or not you should be buying. If the super-trend indicator moves below the closing price, the indicator turns green, and it signals an entry point or points to buy.
Disclosure: I am part of Trade Nation's Influencer program and receive a monthly fee for using their TradingView charts in my analysis.
———————————
WISH YOU ALL LUCK

Weekly $SPY / $SPX Scenarios for June 30 – July 3, 2025🔮 Weekly AMEX:SPY / SP:SPX Scenarios for June 30 – July 3, 2025 🔮
🌍 Market-Moving News 🌍
📈 US Stocks Rally to Record Highs
Following a volatile first half, U.S. equities surged into record territory in late June on a combination of easing Middle East tensions, cooling inflation data, and the 90-day tariff pause
💵 Dollar Weakens on Fed and Trade Uncertainty
The U.S. dollar fell to a 3½-year low, pressured by persistent speculations over President Trump replacing Fed Chair Powell and extending rate-cut expectations, as well as progress in U.S.-Canada trade talks
🇨🇦 U.S.–Canada Trade Talks Lift Sentiment
Canada temporarily repealed its digital services tax to facilitate talks seeking a broader trade agreement by July 21, boosting U.S. equity futures
🛢️ Oil Prices Stabilize
After spiking on geopolitical fears, oil traders settled between $65–78/bbl amid supply relief following ceasefire developments and easing Middle East risks
⚠️ July Risks Loom
The coming week will spotlight:
July 4 deadline for Trump’s tax bill
Expiry of the tariff pause on July 9
U.S. Nonfarm Payrolls on July 3
Each poses potential for increased volatility if outcomes disappoint
📊 Key Data Releases & Events 📊
📅 Monday, June 30
9:45 AM ET – Chicago PMI (June): Gauge of Midwestern factory activity
📅 Tuesday, July 1
U.S. markets open, watch trade developments
📅 Wednesday, July 2
Global PMI readings released
📅 Thursday, July 3 (Early close ahead of Independence Day)
8:30 AM ET – Nonfarm Payrolls (June)
8:30 AM ET – Unemployment Rate (June)
8:30 AM ET – Average Hourly Earnings (June)
These labor metrics will be critical for Fed rate outlooking
⚠️ Disclaimer:
This information is for educational and informational purposes only and should not be construed as financial advice. Always consult a licensed financial advisor before making investment decisions.
📌 #trading #stockmarket #economy #jobs #Fed #oil #trade #technicalanalysis

SP500 possible Turn Just a possibility - DJT and IWM have turned down, they often lead the moves. Gold at support and holding. Oil support is holding. Natural gas probably bounces here. BTC at channel resistance

SPY: Bearish Continuation is Expected! Here is Why:
Looking at the chart of SPY right now we are seeing some interesting price action on the lower timeframes. Thus a local move down seems to be quite likely.
Disclosure: I am part of Trade Nation's Influencer program and receive a monthly fee for using their TradingView charts in my analysis.
❤️ Please, support our work with like & comment! ❤️

SPY Prediction (with 10% conviction)Now that we are at ATH, whats going to happen next?
Superimposition of 2018 bear market over today's timeline shows we rally to $625 after which we get a correction to $573. Rally continues onwards until we get another plandemic🤞
In 2018 we had tariffs 1.0 in addition to FED QT. This time we have tariffs 2.0 (or do we?) and a confused FED which probably makes the case for the same level of FUD.
Economic and political environment changes but human behoviour does not change, altlest not like moores law.
Thank you for your attention to this matter!

SP500 short USD is losing its reserve currency status but I guess it is also loosing its measuring cup status as well.
While people are cheering for all time highs in USD, SP500 in CHF does not look good at all.

June 27th, 2025 - Morning BriefFriday, June 27, 2025. Markets are on the edge, and if you thought summer would bring calm, think again. Today’s script is pure adrenaline.
Overnight, the U.S. and China finally inked a trade deal that actually matters: tariffs are coming down, and rare earths are flowing again. Tech and manufacturing stocks are already celebrating, with SP:SPX and CME_MINI:NQ1! futures inching toward fresh record highs. NASDAQ:NVDA is still the market’s favorite lottery ticket, hitting another all-time high. Meanwhile, NYSE:NKE just spiked 10% premarket after beating earnings. Never mind the $1 billion tariff punch, they’ll “manage it.” Sure.
But the real show is the May PCE inflation data dropping this morning. The Fed’s favorite gauge is expected to tick up to 2.3% year-over-year, with core PCE at 2.6%. If the numbers surprise, brace for whiplash in rates and risk assets. GDP’s third estimate confirmed a -0.5% contraction in Q1, so the “soft landing” crowd is sweating. Jobless claims and new home sales hit at 10:00 AM ET. Expect every algo on the Street to be watching.
Trump is making noise about firing Powell before 2026, which has traders betting on earlier rate cuts. If you’re looking for stability, you’re in the wrong casino.
Here’s where things stand:
- OANDA:XAUUSD : $3,280–$3,334/oz (slipping as risk appetite returns)
- BLACKBULL:WTI : $65.64–$65.82/barrel (steady, but one headline away from chaos)
- BINANCE:BTCUSDT : $107,215–$107,477 (down, but still a six-figure fever dream)
- CME_MINI:ES1! : Hovering just below the 6,144 record
Today’s takeaway: The market’s running on hope, caffeine, and denial. Stay sharp, one bad print and the rally could turn into a stampede for the exits. Welcome to the volatility vortex.
Been building something for US swing traders — if you’re one, I’d really appreciate your feedback. Free to test, link in Bio

SPY GEX & Technical Setup – Aiming for Gamma Lift-Off?GEX Outlook (June 24, 2025):
SPY is sitting right on top of a major Gamma Wall at 607–610, with high net positive GEX and strong Call Wall stacking above. The 2nd Call Wall (609) and GEX10 (611) suggest bullish optionality remains intact if SPY can hold above 605.
* GEX Sentiment: 🟢🟢🟢🟢
* IVR: 13.7 (low implied volatility rank, bullish)
* IVx Avg: 16.7
* Put Walls: Strong support at 595 and 591
* Call Pressure: Builds up from 605 to 611
📌 This is a prime environment for long CALLs, especially for traders expecting momentum continuation through 607+.
Price Action (1H): Smart Money Concepts Perspective
* Break of Structure (BOS) confirmed at ~606
* Retest held strong near 600.15–604.45, validating support
* Clear bullish CHoCH and BOS sequence with strong volume
* Current candle consolidation inside a small supply zone near 607 (possible pause before continuation)
Support Zones:
* 604.45: First line of defense
* 600.15: Breaker block retest
* 591.90: Ultimate bear invalidation zone
Resistance Targets:
* 610: Next major target (2nd Call Wall)
* 611+: GEX10/extension zone for squeeze
🔍 Trade Idea (Scalp or Swing)
Bullish Scenario (CALLs setup):
* Entry: On retest of 604.5–605 zone
* Target: 610–611 (Gamma zone breakout)
* Stop: Below 600.15
* Options Play: Buy 610C 0DTE/1DTE if intraday bounce confirmed above 605 or breakout continuation above 607
Bearish Reversal?
* Only if SPY breaks below 600 with momentum + volume. Otherwise, dip = opportunity.
Summary:
SPY is riding a strong bullish structure with GEX favoring upward pressure. As long as 604–605 holds, dips are for buying. Watch 607–610 for breakout confirmation. Options market flow supports further upside if volatility remains controlled.
Disclaimer: This analysis is for educational purposes only and not financial advice. Always do your own due diligence before trading.

SPYOf course when I get out of SPY it sky rockets... this has continuously happened to me while trying to build up my small account. I get in make about 5-10%, take profits, then it jumps in the direction I get into. Wild. Any suggestions?


SPY . Market Corrections IncomingHey Guys it's been a long time but I'm going to be more consistent in publishing more. The S&P 500 has hit a level of resistance 4 times on the daily chart. which is very very telling. Yes I understand we have news and war being a major catalyst in the stock market rallying a lot lately but this is only temporary. This previous witching was last Friday if you weren't aware which also caused the small pull back. So for further bullishness to continue let's look at the earnings for the magnificent 7 and the rest of the tech sector. More war means more money for the market . we have the next witching in September . and so here are my projections. We take a step higher in July as we go into the peak of SOLAR Maximum . please do your research. and then after that by September we go into pull season . Happy trading

update on the Markets 6-26SPY may reverse today, I'm watching IWM for clues. Gold losing support as of now. Oil may come down more and then bounce again. NG is hard to read. BTC still holding below it's channel.

Stock Market Forecast | TSLA NVDA AAPL AMZN META MSFTStock Market Forecast | CME_MINI:NQ1! CME_MINI:ES1! QQQ SPY
Mag 7 Forecast | CBOE:MAGS NASDAQ:TSLA NVDA AAPL AMZN META MSFT

SPY ATH TARGET 650Trend: Strong bullish continuation. Price just broke above the key 610 level, entering a momentum phase toward the projected 650 target.
Structure: SPY is trading inside a rising channel. The upper bound aligns with the 650 level, suggesting this is the next liquidity zone.
Support Zones:
610: Now a critical support. If it holds, buyers remain in control.
580–560: First unfilled gap — a likely magnet if price dips.
540–530: Second unfilled gap — stronger support on deeper pullback.
500–480: Major demand block — structural bottom of the current rally.
Moving Average (EMA): Price is trading above its EMA, confirming bullish momentum.
Gaps: Two visible gaps remain open below, both likely to act as magnets if bulls lose momentum.
📈 Expected Range:
Above 610 → Target: 650
Below 610 → Watch for gap fills at 580 and 540

Nightly $SPY / $SPX Scenarios for June 27, 2025🔮 Nightly AMEX:SPY / SP:SPX Scenarios for June 27, 2025 🔮
🌍 Market-Moving News 🌍
📉 Global Markets Bet on Dovish Fed Pivot
Markets are pricing in more aggressive Federal Reserve rate cuts—approximately 125 bps by end-2026—due to speculation that President Trump may replace Chair Powell with a dovish successor. Investors caution excessive political influence could jeopardize Fed independence
🏦 Fed Governor Warns of Tariff Risks
Fed’s Michael Barr emphasized that tariffs could trigger inflation and unemployment, reinforcing the Fed’s wait‑and‑see approach. Expect modest rate cuts later this year, contingent on economic signals
📉 Q1 GDP Revised Sharply Lower
First-quarter U.S. GDP was downgraded to an annualized contraction of 0.5%, a deeper fall than previously reported. The revision underscores drag from weak consumer spending and trade disruptions
📃 Trade Deficit Widens in May
U.S. goods trade deficit expanded 11% to $96.6 billion, driven by a $9.7 billion drop in exports. Trade gap dynamics remain a headwind for growth projections
🐘 JPMorgan Sees Stagflation Risks
JPMorgan revised its U.S. GDP growth forecast down to 1.3%, warning that tariff-related “stagflationary impulse” is complicating growth and inflation outlooks—and making recession risks more real
📊 Key Data Releases 📊
📅 Friday, June 27:
8:30 AM ET – U. of Michigan Consumer Sentiment – June (Prelim.)
Expected to reflect growing economic caution. The index fell in May; traders will watch for further weakness.
10:00 AM ET – Fed Stress Test Results
Fed to release annual bank stress-test outcomes. Strong results support financial stability, while weak spots could unsettle markets
⚠️ Disclaimer:
This information is for educational and informational purposes only and should not be construed as financial advice. Always consult a licensed financial advisor before making investment decisions.
📌 #trading #stockmarket #economy #Fed #inflation #macro #charting #technicalanalysis

What Is The Market Waiting For?Good Morning Trading Fam,
Our stock and crypto markets seem to have stalled. You may be wondering what they are waiting for. Quite simply, the S&P 500 has reached a double-top. That's all. There may be some more pause here for the next week or so. Barring any significant bearish geopolitical or other events, I expect us to move higher. Any FUD at all will send the market back down again. So yes, unfortunately, the next move(s) will be mostly predicated on news. Traders are rather fragile rn. Trade accordingly.
Best,
Stew

Market has decidedI mentioned yesterday I thought it would be either a large break up or large breakdown, it was a large break up after all. All time highs are very close, so probably this week we will get there, unless something happens overnight or tomorrow. Gold looks bearish but is holding support as of now. Oil is at support. Nat Gas lost support. BTC is in a channel and looks more bullish now that it's over 105k.

SPY: How are ya?Long time no talk.
Just an update to appease some people requesting updates haha.
Mostly going over the larger term outlook for SPY, the quarterly and some discussions on the weekly.
As always, not advice and remember to follow your strategies and risk management approaches!
Safe trades everyone!

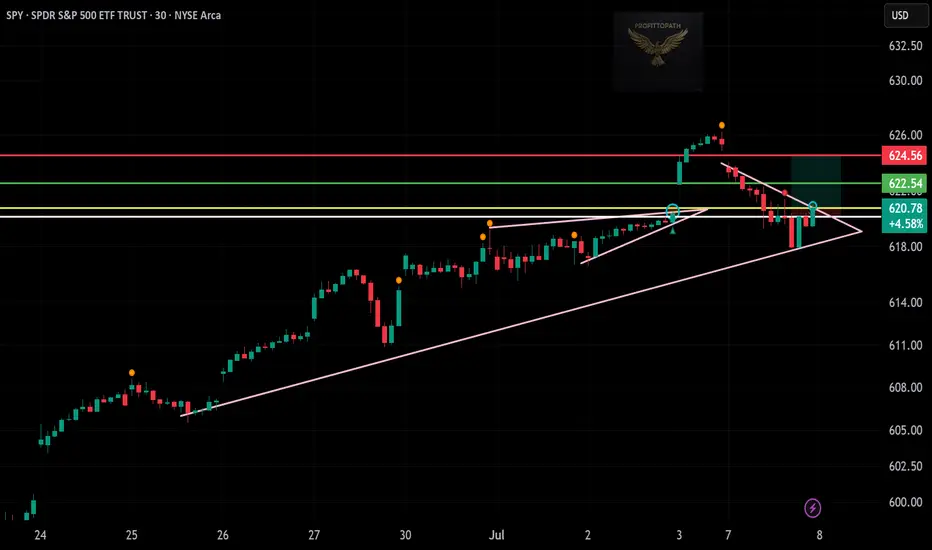
SPY Breakout Setup – Bullish Pattern Watch! 📈 🟢
SPY has formed a clear ascending triangle with strong support at $616. After a pullback, it’s now breaking out above $620.78 with a bounce from trendline support and rejection of lower prices.
📌 Trade Details:
🔹 Entry: $620.78
🔹 Stop Loss: $616.00
🔹 Target: $624.56
🔹 Pattern: Ascending Triangle Breakout
This setup aligns with market momentum and breakout structure. Great risk-reward for bulls watching major index movement.
—
📊 Posted by: ProfittoPath
#SPY #SP500 #ETFTrading #BreakoutSetup #MarketUpdate #ProfittoPath #TechnicalAnalysis #StockTrader #ChartAnalysis
SPY Gamma Squeeze Fading – Key Put Wall Battles Ahead 🧨 GEX Options Sentiment (TanukiTrade GEX Chart)
* Current Price: 619.91
* Major Support Wall:
* GEX Cluster Support: 618 → 617 (Highest Negative Net GEX + 3rd PUT Wall)
* Additional GEX Floor: 616.37 (PUT support overlap with SMC zone)
* Resistance Levels:
* 625.34 → First CALL Wall
* 627 → 2nd CALL Wall
* 630 → Top of CALL Gamma Resistance
* Put Wall Dominance:
* GEX7–GEX10 blocks show heavy negative pressure (-47% to -66%) centered between 617–620
* Options Flow Insight:
* PUTS OI: 41.9% – Signaling downside hedges are still dominant
* IVR: 15.3 (low), IVX avg: 18.2 – Implied volatility suggests premium selling could get tricky unless directional trend returns
🔸 Interpretation:
This is a “put-heavy zone” — large GEX support clusters below price (617–618) are temporarily halting further drop, but unless SPY can reclaim 625.34, there's still gamma-driven downside risk.
🟢 1-Hour SMC Price Action
* Recent Structure:
* BOS confirmed → 626.27
* CHoCH to downside below 620 → confirmed rejection
* Current Setup:
* Price is hovering at minor demand between 617–620
* If 616.37 breaks, it opens room toward SMC demand zone at 604–606
* Strong resistance overhead at 625–627 (OB + GEX call wall + CHoCH retest)
🔸 Scenario 1 – Bullish Reclaim:
* Entry: Above 621
* Target: 625.34 → 627
* Stop: Below 616.00
* Setup: Break/retest of CHoCH + reclaim trendline
🔸 Scenario 2 – Bearish Breakdown:
* Entry: Below 616.37
* Target: 606 → 600
* Stop: Above 620
* Setup: Breakdown from demand + confirmed CHoCH retest
📌 Thoughts & Recommendations:
* Scalpers: Watch 620.50–621.00 as intraday pivot.
* If reclaimed, we may see short squeeze into 625–627
* Below 616.37, put flows will likely accelerate
* Swing Traders: Bearish bias unless 625.34 flips → consider spreads or directional puts
* Neutral Edge: This is a gamma battle zone — don’t overcommit, let price pick a side
Disclaimer: This analysis is for educational purposes only and does not constitute financial advice. Trade based on your risk profile and always use a stop-loss.
