Shanghai Composite: Double bottom signals potential upsideChinese stocks are not for the faint-hearted. It's a market with a lot of volatility, swings, and roundabouts. Despite this, we've been keeping a close eye on the Shanghai Composite Index over the past few weeks and like the pattern we are seeing emerge.
As of the time of writing, the Shanghai Com
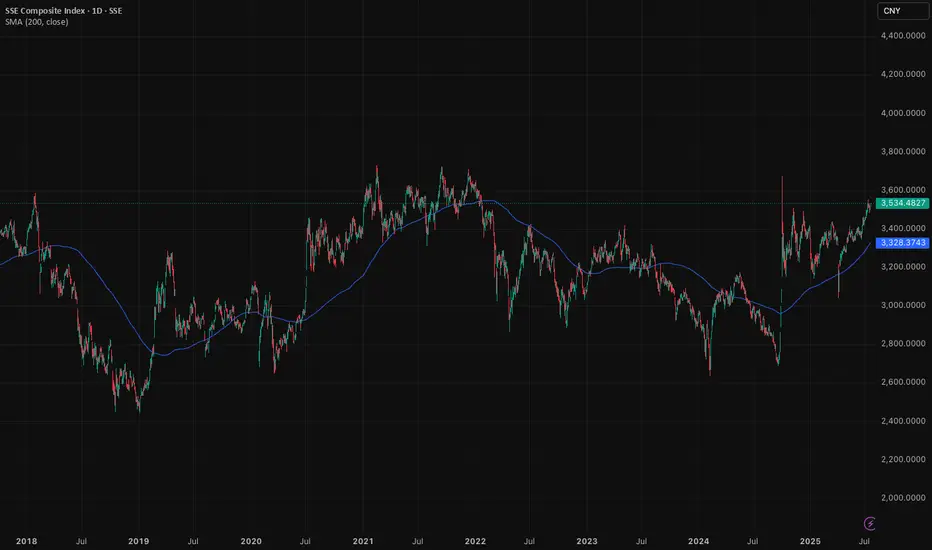
About SSE Composite Index
The SSE Composite Index, often referred to as the Shanghai index, is a stock market index that tracks the performance of all stocks traded on the Shanghai Stock Exchange. First introduced in 1991, it has soon become one of the most widely used indices of the Chinese stock market. It's a capitalization-weighted index representing the 20-year-history of the China Capital Markets' development. SSE Index has subindices such as SSE 50 Index and SSE 180 Index tracking the corresponding number of top companies of the Shanghai Stock Exchange.
Related indices
SSE Composite Index CorrectionThe SSE Composite Index, the primary index of the Shanghai Stock Exchange, reflects the performance of diverse companies across various industries and serves as a gauge of China’s economy. It is calculated based on the market value and stock prices of these companies.
According to daily Cash Data (

Is it a copy paste?Looks like the trendline breakout is similar to the one in the past back in 2013.
This is a weekly chart and could take some weeks to play out but I see a huge breakout anytime soon within a month or two.
Next target 4500?

China index short: breakdown of trend line The words in the charts are Chinese characters because I've used the screenshot of the chart to provide my view to Chinese investors. Essentially, this means chart shows a strong wave 1 up, then now we should be going into a C wave of Wave 2.

Shanghai Composite Index (SSE) To Hit 6,124 First, Then 8,660SSE had a rally from 2005 to 2007 establishing the all-time high of CNY 6,124.
After that, the price had built a weird corrective structure with ups and downs fading in magnitude over a very long period of time.
It took 17 years to complete the giant contracting triangle (white ABCDE marks).
The p

Shangai Stock Exchange Technical CorrectionAfter rose so high, SSE Index will fall soon or at least revert back to its previous trend.

Who Gets Rich in China's Market Rally?On September 24th, China announced an unprecedented fiscal stimulus, aiming to rescue its ailing economy. As soon as the news got out, China’s stock market staged a huge rally. The Shanghai Stock Exchange (SSE) index moved from below 2,800 on September 24th to close at 3,336.5 on September 30th, up

Shanghai Stock Exchange - MACRO OUTLOOK DANGER!!SSE Composite Index
Macro timeframe has just confirmed a bearish trend incoming.
Expiry set for October 2026 with macro targets of $2,000 - $1,700.
Short term we may take the lows of $2,600's followed by a dead cat bounce toward $3,000's and macro bearish structure will remain the same. Macro

Shanghai Composite. 'Arctic Fox' leaps on Shanghai street cornerReal estate has made China rich in recent years and decades. Now it looks more like radioactive kryptonite from the DC Comics universe - the birthplace of Superman.
Three months earlier, China's house prices fell 0.4% in a month, according to official statistics released in November 2023, the ste

The case for investing in ChinaThe case for investing in China
I have had discussions on this platform about my investments in China, the overwhelming response I get is negative. In this article I would like to try and provide an objective, data focused case to invest in China. In a soon coming article I will look at the opposi

See all ideas
Summarizing what the indicators are suggesting.
Oscillators
Neutral
SellBuy
Strong sellStrong buy
Strong sellSellNeutralBuyStrong buy
Oscillators
Neutral
SellBuy
Strong sellStrong buy
Strong sellSellNeutralBuyStrong buy
Summary
Neutral
SellBuy
Strong sellStrong buy
Strong sellSellNeutralBuyStrong buy
Summary
Neutral
SellBuy
Strong sellStrong buy
Strong sellSellNeutralBuyStrong buy
Summary
Neutral
SellBuy
Strong sellStrong buy
Strong sellSellNeutralBuyStrong buy
Moving Averages
Neutral
SellBuy
Strong sellStrong buy
Strong sellSellNeutralBuyStrong buy
Moving Averages
Neutral
SellBuy
Strong sellStrong buy
Strong sellSellNeutralBuyStrong buy
Displays a symbol's price movements over previous years to identify recurring trends.
Frequently Asked Questions
The current value of SSE Composite Index is 3,593.6553 CNY — it has fallen by −0.33% in the past 24 hours. Track the index more closely on the SSE Composite Index chart.
SSE Composite Index reached its highest quote on Oct 16, 2007 — 6,124.0439 CNY. See more data on the SSE Composite Index chart.
The lowest ever quote of SSE Composite Index is 95.7900 CNY. It was reached on Dec 19, 1990. See more data on the SSE Composite Index chart.
SSE Composite Index value has increased by 2.11% in the past week, since last month it has shown a 5.11% increase, and over the year it's increased by 24.27%. Keep track of all changes on the SSE Composite Index chart.
The top companies of SSE Composite Index are SSE:601398, SSE:601288, and SSE:601939 — they can boast market cap of 348.99 B CNY, 295.74 B CNY, and 281.77 B CNY accordingly.
The highest-priced instruments on SSE Composite Index are SSE:600519, SSE:688256, and SSE:688502 — they'll cost you 1,455.00 CNY, 673.30 CNY, and 352.98 CNY accordingly.
The champion of SSE Composite Index is SSE:688585 — it's gained 1.30 K% over the year.
The weakest component of SSE Composite Index is SSE:603556 — it's lost −31.32% over the year.
SSE Composite Index is just a number that lets you track performance of the instruments comprising the index, so you can't invest in it directly. But you can buy SSE Composite Index futures or funds or invest in its components.
The SSE Composite Index is comprised of 2231 instruments including SSE:601398, SSE:601288, SSE:601939 and others. See the full list of SSE Composite Index components to find more opportunities.