Steem Bullish Chart, Leads To Bullish Cycle In A Bull-MarketWe are looking at a new All-Time Low. The lowest price in more than 8 years.
We are looking at five years of consolidation.
We are looking at low risk, vs a high potential for reward.
Good night my dear reader, it is night here in the Caribbean...
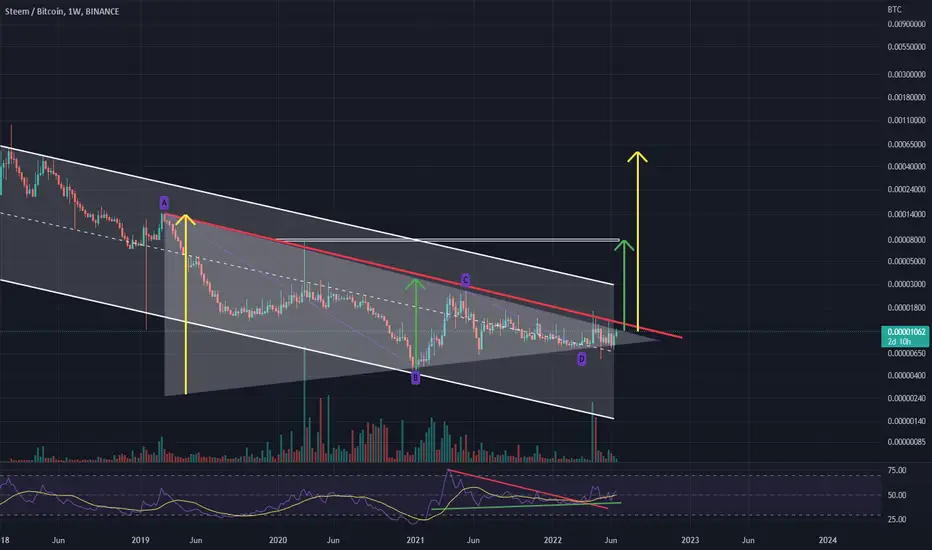
Even a medium-sized wave can produce more than 500% growth for this pair. A small wave would end at 344%. And a big wave can produce 1,000% or more.
In 2021 this pair, STEEMBTC, produced a 500% bullish wave. But this wasn't a real bullish wave but a small bounce, an inverted correction. The way the chart is set up now it can produce an actual uptrend, it has been bearish since 2017.
Something I mentioned frequently last month came back to mind again. When everything hits the fan, when the world goes south and panic sets in, people will be looking for stability or at least the impression of stability, and in the Cryptocurrency market this can be translated into old projects, pairs that have been around for a long-time. This is one of those. This is just a thought.
The chart is bullish and support higher prices in the coming bull-market.
Prepare for growth.
Thanks a lot for your continued support.
Namaste.
STEEMBTC trade ideas

STEEMBTC to 3 digit satoshi or less.- Nothing to says for STEEMBTC while it's moving inside down trend pitchfork. Get out from it might had a change for STEEM/BTC to survive which took around Q4 or next few years depending STEEMBTC movement.
- support and resistance. to avoid much clutter on the main chart.
- Indicators (CMF, CCI and OBV) is still on bearish area on daily. No bullish divergence sighted yet. as indicators still made a lower low compare the previous low.

STEEM Weekly Analysis (225% Potential Profits Mid-Term)Let's continue the second round by analyzing at the famous STEEM (STEEMBTC) altcoin, we are looking at the weekly chart.
First, let's start with the relative strength index, we can see it at over 56.
We consider this index to be strong at 30 or higher when using the weekly timeframe.
We have a symmetrical triangle which is a neutral pattern but also have a break above EMA50 and conquerd down-trendline.
This signals higher prices.
I am mapping a nice 58% short-term followed by 225% total with additional potential for those patient enough to wait for the upcoming bullish wave to unfold.
It is all very simple when it comes to the Altcoins.
To increase your holdings of Bitcoin, buy ALTSBTC (Altcoins vs Bitcoin) pairs and hold.
Very simple.
Thanks a lot for your continued support.
Namaste.

STEEM/BTC-1W-BINANCEhis is not a financial advice. Always do your own research and always put stoploss in your trade (SL) :) If you want more detailed info
how to study and read charts or just need help with some coin, just write to me here a comment, i will try to answer to everybody...
i can help you :) all for free, don't worry, BE HAPPY!
STEEM-LONGwith a buy structure formed , and a new higher lows are formed price is expected to break to the upside

steemBTCAfter this facebook outage. Im betting on Steem to make to gains. It has been consolidating in this zone for over 3 month and i think its ready to break out.
Stoploss below blue line

✅Steem/Bitcoin💥+40%Steem is a social blockchain that grows communities and makes immediate revenue streams possible for users by rewarding them for sharing content. It’s currently the only blockchain that can power real applications via social apps like Steemit.

🆓Steem (STEEM) Aug-24 #STEEM $STEEMSTEEM has spent 2 months for moving sideways around 1200sts and in the coming days, STEEM is likely to have a strong rally with the nearest 2 targets at 1800sts and 2400sts and it can absolutely increase stronger. But if it loses the 1200sts zone this turn, it will fall down to 800sts zone
📈BUY
🔴Buy : 1150-1250sts. SL if B 1000sts
📉SELL
🔴Sell : 1750-1850sts. SL if A
🔴Sell : 2350-2450sts. SL if A
♻️BACK-UP
🔵Buy : 750-850sts. SL if B
❓Details
🕯Timeframe : 1 Day
📈Red Arrow : Main Direction as BUY and SELL section
📉Blue Arrow : Back-Up Direction as BACK-UP section
🟩Green zone : Support zone as BUY section
🟥Red zone : Resistance zone as SELL section
🅰️A : The Close price of candlestick is Above the zone
🅱️B : The Close price of candlestick is Below the zone

STEEMBTC chooes short or long trend in my opinion this is 2 way that trend will choose one of them.
It will be determined soon

STEEMBTC - STEEM UDS - STEEM LONGENTRY - STL - TP on picture
TP of me . And TP of you , i don't know
You can buy more if price lower entry
" High risk scaling consider when entering orders "
Wait to entry no buy price now if price done TP2 , We cancel this order !
THIS SHITCOIN BUY 20% $ TOTAL ACCOUNT
I am fomo following the recent pump dump events

STEEMBTC wants the breakout! 🦐STEEMBTC wants the breakout after the price tested the weekly resistance. IF the price will have a breakout from the resistance, and turn into new support, According to Plancton's strategy (check our Academy), we can set a nice order
–––––
Follow the Shrimp 🦐
Keep in mind.
🟣 Purple structure -> Monthly structure.
🔴 Red structure -> Weekly structure.
🔵 Blue structure -> Daily structure.
🟡 Yellow structure -> 4h structure.
⚫️ Black structure -> <4h structure.
Here is the Plancton0618 technical analysis, please comment below if you have any question.
The ENTRY in the market will be taken only if the condition of the Plancton0618 strategy will trigger.


STEEMBTC near to break#STEEMBTC
STEEM price broke out long term resistance and maybe here or 1340 sats would be the last dip chance to buy.
it has a great great potential to increase 150% to 300% ... and even in long long term it would have 800% profit.🚀🚀


Steem/Bitcoin [LONG]This little guy flying slowly up.
TP: 0.00002650
Share your opinion in the comments.
* This is not financial advice.


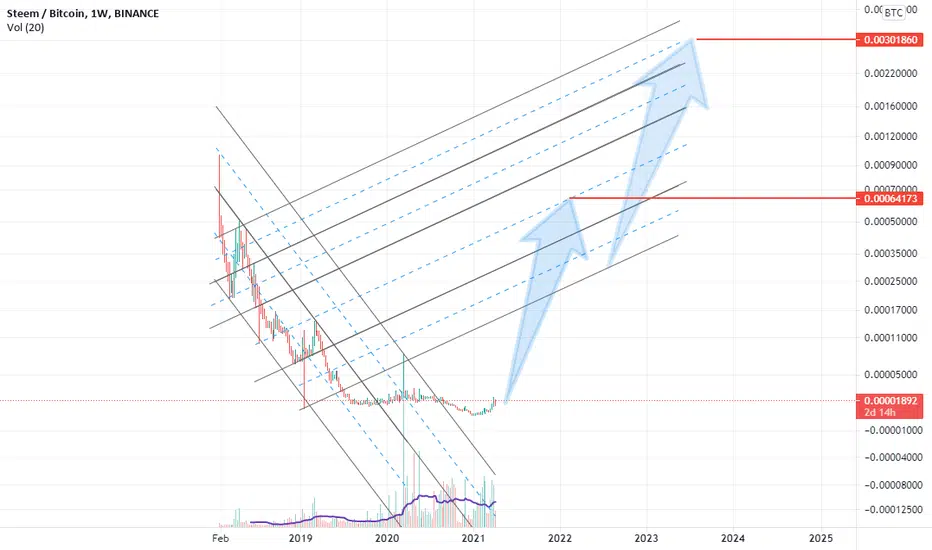
calculate targets from referencesI have two targets for bitcoin: $21200 and $11200
and have two targets for steem: $13.6 and $34
so
tp1=13.6/21200=0.00064
tp2=34/11200=0.003

STEEMBTC - Long - Potential 14.92%STEEMBTC - Long - Potential 14.92%
Exchanges: Binance
Signal Type: Regular (Long)
Entry Zone:
0.00001155 - 0.00001188
Take-Profit Targets:
1) 0.00001250
2) 0.00001378
Stop Targets:
1) 0.00001102
Trailing Configuration:
Entry: Percentage (0.0%)
