STEEMBTC trade ideas


Steem to rise 3,000%+ over next few months?Not entirely confident about this but definitely something to watch over coming months. Look at that volume


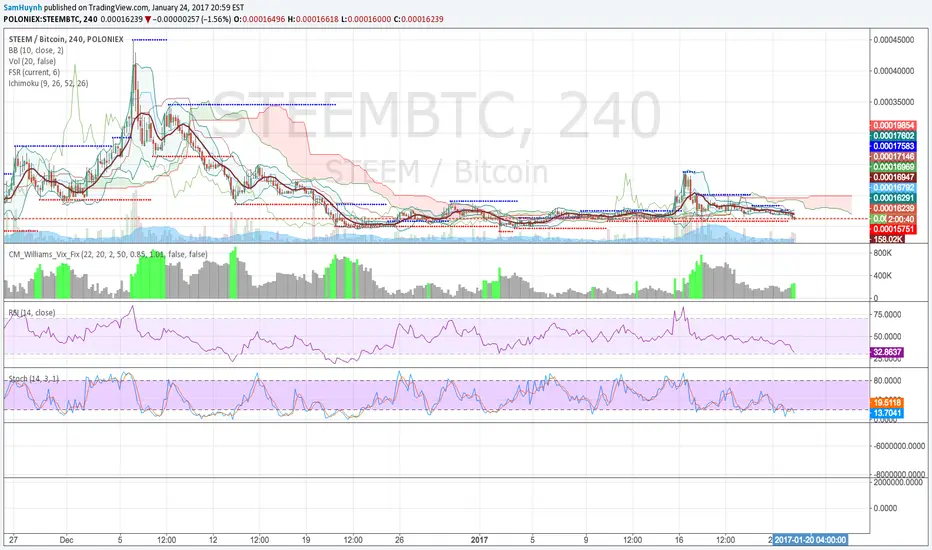
Steem important support level low risk to high probable profit We can clearly see here two very important levels to watch for( marked with two parallel black lines). Level around 0.00013555 which was created by double bottom in the November last year. Above it around 0.00015000 level pair was holding for a while between the end of the December and beginning of the January. Mid of February level was broken and the pair went south very quickly just to rise up in mid March with very high volume. Pair for the last 16 days is testing support around these two levels. I marked three soldiers formation with blueish rectangle which is suggesting trend reversal.
I think it would be reasonable to set SL just below lower level.
TP area would be around last high around level 0.00032000 or you could just wait some time till the pair will reach 200 ema which should bring some interesting price action. I would definitely close position when the pair will be close to the 200 ema.


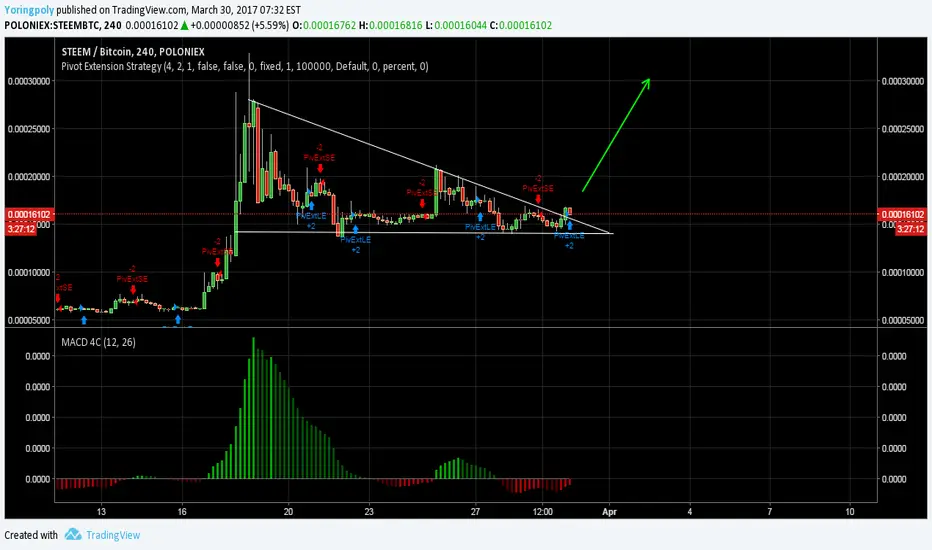
STEEM breakout, trend reversal confirmed, 2nd wave UP on the waySteemit, decentralized and incentivized social media.
Steemit is a innovation and a new social media platform built on the Steem blockchain where the community rewards individuals for their posts, comments and votes, co-founded by Ned Scott chief executive officer and Daniel Larimer, CTO of Steemit and founder of Bitshares.
This was my first chart about steem:
a chart from spacetrader(PRO) still one of only few crypto applications with a product out:
steemtools.com
best wishes
your Altcoinanalytics


Steem Long "Update"A few people asked me about a Steem update, and here it is! Long again!
I wrote a few details in the new chart
Sorry but I don't have the time to describe each option
here is the old chart:
Best wishes and don't forget:"don't invest more than you can afford to lose"
your Altcoinanalytics

STEEMBTC 60M LongAfter a massive jump to the upside, the ratio seems to be finding support at 0.00017
Looks like another good risk/reward opportunity is upon us.
Target Price: 0.0003 (recent high)
Stop loss 0.00017
Good luck


STEEM, very LONG!Steem will jump up after the 10ksat resistance.
It is highly probable that we will see a trend reversal.
It's a good moment to enter Steem, the price was at over 4usd a few months ago, the risk reward relation is perfect.
best wishes

Steem ready to interrupt the current downtrendAfter weeks of continued price decline in the STEEMBTC currency pair, a change to the upside might be at hand. We have seen earlier that a break of the major downtrend line led to some substantial upside. In addition, this time the newly unfolded downtrend line coincides with the 2/1 Gann line, drawn from the high to a significant local low, suggesting the significance of the entire Gann fan. A break of such line indicates a move to the next Gann line, i.e. 3/1.
How soon STEEMBTC reaches this line can only be guessed. In the scenario outlined on the chart there would be a potential profit of 250% and a potential loss of 15-25%. The stop-loss is determined just under the current all time low.
I am not responsible for any loss on your side if you would do this trade, but I sincerely hope this plays out as expected since I am invested myself. ;)

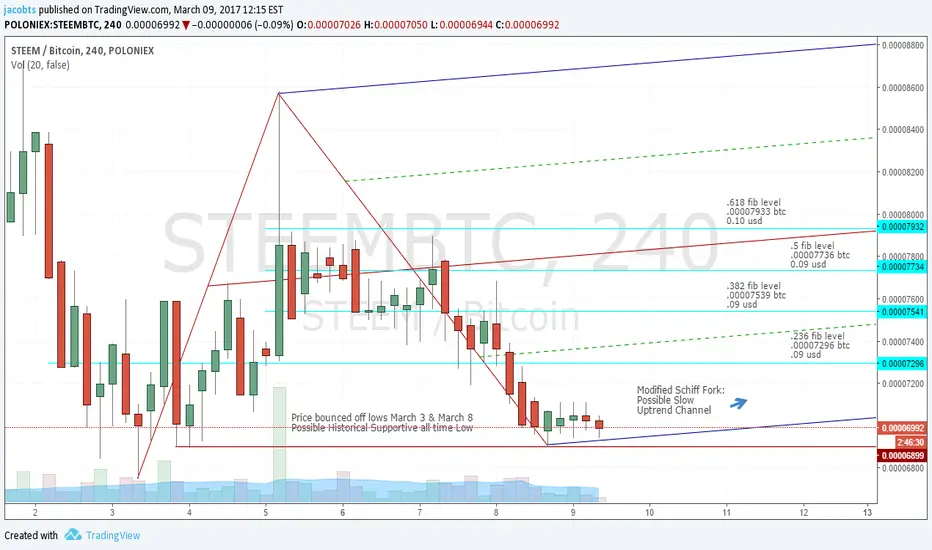
STEEM . Baby Bull
Almost one year old, STEEM may have seen it's all time low from which it has bounced a few times now. A modified Schiff Pitchfork shows us a slow BULLISH channel moving forward. Fibonacci levels ahead also show some attractive historical price action.
Technically speaking, tentatively BULLISH.
Fundamentally speaking, the blockchain is new and there continues to be innovative projects discussed and released including SteemPhotos and Busy. And those are just the beginning. Steem has an engaged, diverse, and creative community. It's transactions are instant. Despite any growing pains, it continues to show potential.
Personally speaking, I am BULLISH. The platform continues to show increased usability and the community continues to attract new members whom create new content not only for crypto-enthusiasts but for a variety of public interests.
steemit.com
What will happen? We shall see.
Time to buy STEEM - Pump incomingit is good time to buy Steem now. Big Pump is coming within 1 week :)
still one of only few crypto applications with a product outhigh risk spot long, don't listen to me.
still one of only few crypto applications with a product out
higher high and higher lows got my attention.
price breakout is confirm.
hard fork to remove 90% of powerup time and 90% of inflation was a good step to making this a viable decentralized reddit.
with inflation under control 9%-<1%/year, the tokens value is no longer diluted as drastically.


STEEM NutralSeems to be settling into a tradable range, though likely to break out on a rise eventually.

$STEEM - now what?Being a steemian I would say it's a good moment for a little STEEMBTC pump as the price, Tenkan & Kijun are going to meet, but still there are no signals for bulls.
At the time of posting there are no bullish signs even on the hourly charts :-(
just watch how the situation is being resolved

STEEMBTC - a mere update of the price targetsSTEEMBTC is flat for the last couple of weeks, almost no signs of any positive movements :(
and the resistance for the possible up-spikes of the price came down closer:
the Ichimoku Base Line (Kijun Sen, the red line) is around 0.00019550
