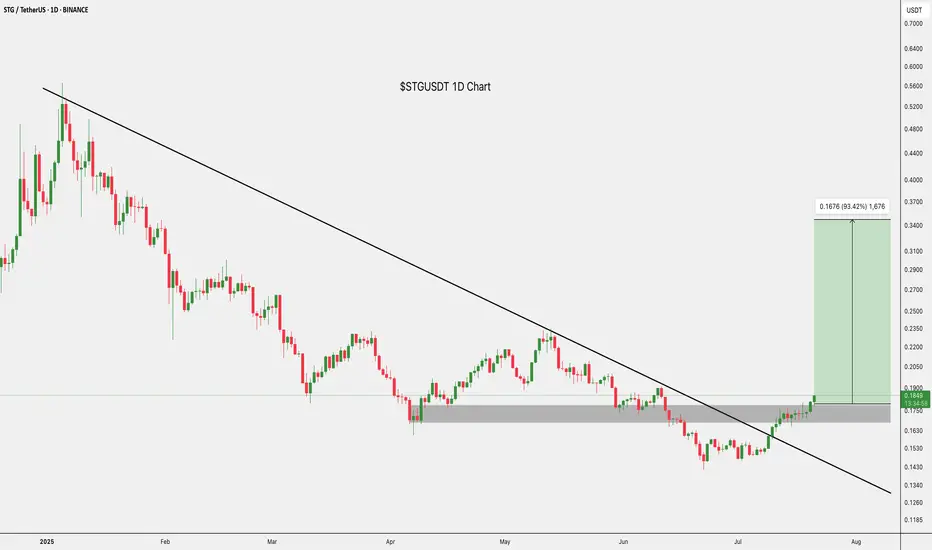
$STG Breakout 93% Move Ahead?NYSE:STG just broke out of a long-term downtrend and flipped the $0.1644–$0.1786 zone into support.
If this level holds, it could rally toward $0.3480, nearly 93% upside.
Momentum looks strong, and the breakout is clean.
One to watch closely.
DYOR, NFA
STGUST trade ideas

STG/USDTKey Level Zone : 0.4380 - 0.4420
HMT v4.1 detected. The setup looks promising, supported by a previous upward/downward trend with increasing volume and momentum, presenting an excellent reward-to-risk opportunity.
HMT (High Momentum Trending):
HMT is based on trend, momentum, volume, and market structure across multiple timeframes. It highlights setups with strong potential for upward movement and higher rewards.
Whenever I spot a signal for my own trading, I’ll share it. Please note that conducting a comprehensive analysis on a single timeframe chart can be quite challenging and sometimes confusing. I appreciate your understanding of the effort involved.
Important Note :
Role of Key Levels:
- These zones are critical for analyzing price trends. If the key level zone holds, the price may continue trending in the expected direction. However, momentum may increase or decrease based on subsequent patterns.
- Breakouts: If the key level zone breaks, it signals a stop-out. For reversal traders, this presents an opportunity to consider switching direction, as the price often retests these zones, which may act as strong support-turned-resistance (or vice versa).
My Trading Rules
Risk Management
- Maximum risk per trade: 2.5%.
- Leverage: 5x.
Exit Strategy
Profit-Taking:
- Sell at least 70% on the 3rd wave up (LTF Wave 5).
- Typically, sell 50% during a high-volume spike.
- Adjust stop-loss to breakeven once the trade achieves a 1.5:1 reward-to-risk ratio.
- If the market shows signs of losing momentum or divergence, ill will exit at breakeven.
The market is highly dynamic and constantly changing. HMT signals and target profit (TP) levels are based on the current price and movement, but market conditions can shift instantly, so it is crucial to remain adaptable and follow the market's movement.
If you find this signal/analysis meaningful, kindly like and share it.
Thank you for your support~
Sharing this with love!
HMT v2.0:
- Major update to the Momentum indicator
- Reduced false signals from inaccurate momentum detection
- New screener with improved accuracy and fewer signals
HMT v3.0:
- Added liquidity factor to enhance trend continuation
- Improved potential for momentum-based plays
- Increased winning probability by reducing entries during peaks
HMT v3.1:
- Enhanced entry confirmation for improved reward-to-risk ratios
HMT v4.0:
- Incorporated buying and selling pressure in lower timeframes to enhance the probability of trending moves while optimizing entry timing and scaling
HMT v4.1:
- Enhanced take-profit (TP) target by incorporating market structure analysis

Stargate Finance 500% Easy Target (Withdrawals)It will be easy... Do you remember why I label this as an 'easy target'?
I use the term 'easy' when the pair in question can go beyond what is shown on the chart. STGUSDT (Stargate Finance) can grow much more than 500% in the coming months, making this target an easy one.
Good evening my fellow Cryptocurrency trader, we are about to start a new week now and this week will be positive and green for the Cryptocurrency market.
How are you feeling in this wonderful day?
Here is Sunday night, by the time you read this, it is likely to be Monday. A fresh week starts and the market will be full green. That's great.
Looking at STGUSDT on the weekly timeframe we can appreciate the highest buy volume since August 2022. This is happening after a new All-Time Low. It is early, this pair is now starting to recover and soon it will produce astonishing growth.
The great part is not the buying nor the holding, the best part is to see your volume rise, your capital as the market grows. The next best part is to collect and enjoy the profits you secure with your trades. Remember, you must sell in order to win. Holding is necessary but after buying, we have to sell.
Try it. Make a habit of withdrawing small amounts as the market grows. In this way you will be ready to withdraw big time when we reach the top. You don't have to do it now though, right now is the time for buying, buy and hold.
This pair looks great and I believe it will produce massive growth. We are LONG, up and ready.
Thanks a lot for your support.
Namaste.

"STG/USDT targets $2-$5 amid bullish momentum and Vitalik buzz!
Chart Analysis:
1. Current Price: STG is trading at $0.4167, above the 50-day EMA ($0.3561) and the 200-day EMA ($0.3695), indicating a short-term bullish trend.
2. Key Resistance Levels:
- $0.5662: Immediate resistance, as it marks a previous price reaction zone.
- $0.7293: A critical level to breach for bullish momentum continuation.
- $0.8782: Strong resistance zone before entering the $1 range.
3. Volume: Recent spikes in volume suggest increased buying interest.
4. Potential Upside Targets:
- $2: A significant psychological and technical resistance, requiring a breakout above $0.8782 and consistent volume.
- $3: Mid-term target, achievable if $2 holds as support.
- $5: A long-term target, contingent on a sustained macroeconomic and market-wide crypto rally.
Vitalik Buterin's Involvement:
Recent reports about Vitalik Buterin's mention or potential association with STG might fuel speculative interest, leading to increased buying pressure. His name often correlates with trust and excitement in the crypto community. However, without clear confirmation or significant utility driven by his involvement, this may remain speculative.
Conclusion:
- Short Term: Watch for a breakout above $0.5662 and sustained volume.
- Mid to Long Term: Achieving $2, $3, and $5 depends on broader market conditions, ecosystem development, and concrete news about Buterin's role.

STG/USDTKey Level Zone : 0.3581-0.3657
HMT v3.0 detected. The setup looks promising, supported by a previous upward/downward trend with increasing volume and momentum, presenting an excellent reward-to-risk opportunity.
HMT (High Momentum Trending):
HMT is based on trend, momentum, volume, and market structure across multiple timeframes. It highlights setups with strong potential for upward movement and higher rewards.
Whenever I spot a signal for my own trading, I’ll share it. Please note that conducting a comprehensive analysis on a single timeframe chart can be quite challenging and sometimes confusing. I appreciate your understanding of the effort involved.
If you find this signal/analysis meaningful, kindly like and share it.
Thank you for your support~
Sharing this with love!
HMT v2.0:
- Major update to the Momentum indicator
- Reduced false signals from inaccurate momentum detection
- New screener with improved accuracy and fewer signals
HMT v3.0:
- Added liquidity factor to enhance trend continuation
- Improved potential for momentum-based plays
- Increased winning probability by reducing entries during peaks

STG/USDT Bearish Outlook: Downtrend Confirmed - Watch Key Levels
📉 STG/USDT is showing a strong bearish trend across multiple timeframes. Following a pullback, the price is under pressure, indicating potential for further downside. This analysis highlights key support/resistance levels, trend directions, and potential trading scenarios.
Timeframe Analysis:
5min: 🐻 Price below 20 SMA, RSI < 50, Bearish MACD. Short-term selloff.
30min: 🐻 Price below 20 SMA, RSI < 50, Bearish MACD. Bearish continuation.
1H: 🐻 Price below 20 SMA, RSI < 50, Bearish MACD. Bearish continuation, possible consolidation.
Daily: 🐻 Price below 20 SMA, RSI < 50, Bearish MACD. Clear downtrend, potential for further downside.
Key Levels:
Support: $0.30 (psychological), $0.28, $0.25
Resistance: $0.33, $0.36
Indicators:
20 SMA: Price below on all TFs = Bearish.
RSI: < 50 across all TFs, indicating bearish momentum.
MACD: Bearish crossovers below zero line across all TFs.
Potential Scenarios:
Bearish Continuation: Price likely to test lower supports at $0.28 & $0.25.
Double Bottom Potential: 4H chart shows potential formation for double bottom, watch for confirmation and neckline breakout.
Consolidation: A period of sideways trading may also be seen.
Trading Strategy:
SELL/HOLD: Recommended to sell or hold positions with stop losses.
Short Positions: Consider shorts on rallies to $0.33, stop-loss above.
Take Profit: Target $0.28 initially, then $0.25.
Stop Loss: For shorts, consider a stop loss above $0.33. Move existing stop losses down to $0.32 or $0.31.
Avoid Buying: Downtrend is strong, avoid buying.
Risk Management:
Monitor for oversold conditions, which doesn't guarantee a reversal.
Be cautious of shifts in market sentiment.
Keep an eye on overall crypto market correlation.
#STG #STGUSDT #Crypto #Trading #TechnicalAnalysis #Bearish #Altcoin #TradingView

STGUSDT 4DSTG Update ~ 4D
#STG If you still have Conviction on this coin. Buy in increments from here with a short term target of at least 20%+

STGUSD Technical Analysis: Bulls taking charge?
STGUSDT is showing promising signs of a potential trend reversal, with several technical indicators aligning in favor of the bulls.
Evidence for a Bullish Reversal:
Strong Support: The recent bounce from the $0.33 support level demonstrates strong buying interest at this key level.
Resistance Breakout: The price has convincingly broken above the resistance zone of $0.37 - $0.38, signaling a potential shift in momentum.
MACD Confirmation: The MACD has crossed above the zero line and confirmed a bullish crossover, further supporting the bullish scenario.
Healthy Volume: The volume during the recent upward price action has been relatively healthy, indicating genuine buying conviction.
Potential Upside Targets:
Short-term Target: The descending trendline, currently around $0.40, represents the first major obstacle for the bulls. A break above this trendline could open the door for further gains.
Medium-term Target: If the bullish momentum continues, the next target could be the previous high around $0.43.
Risk Management:
Stop-loss: Traders can consider placing a stop-loss order below the recent swing low around $0.35 to protect against a potential reversal.
Trailing Stop: As the price moves higher, consider using a trailing stop-loss to lock in profits and manage risk.
Conclusion:
STGUSDT appears to be entering a bullish phase, with several technical indicators supporting this outlook. While some risks remain, the potential rewards for the bulls seem to outweigh the risks at this point.

STGUSDT 4DSTG ~ 1W
#STG If you still have Conviction on this coin. Buy in increments from here with a short term target of at least 20%+,, bulls will start pumping prices from here.

Stargate finance ( STG)Stg usdt Daily analysis
Time frame 4 hours
Risk rewards ratio >1.3 👈
Stg is an omnichain-native asset bridge designed to solve the blockchain trilemma , which says blockchain can be desensitized, secure and fast simultaneously.
STG is a good and promising currency in the crypto market. Given the strong team it has, I expect very good growth. Although STG has strong competitors in DeFi such as Polkadot. One of the advantages of StG over Dot is its speed of operation, and of course it has other advantages.
Technical analysis:
Stg is moving between 2 parallel line for 8 week. It's very good movement for traders.
Buy in down and sell in up. But I think in alt season STG will break this parallel and pump. But I have a short time analysis.
When STG break the upper side , I'll reach my target and start to another analysis to higher target

Skt (aka sktrgt)I am an amateur trader. I sometimes enter into trades. Other times it is only an analysis. Trade with your own risk awareness.
69%

STGUSDT 1WSTG ~ 1W
#STG If you still have Conviction on this coin. Buy in increments from here with a short term target of at least 20%+


STG Possible ScenarioSTG Possible Scenario
Breakout of main trendline
Retest of big Breakout
Breakout of MA

STGUSDT (StargateFinance) Updated till 09-11-24STGUSDT (StargateFinance) Daily timeframe range. we can see a nice move here now all it needs a clean close over 0.4177 that can push it further. for the pump not get invalid it needs to stay above 0.3147. re-entry is valid from recent support from a retrace candle.

Stargate Finance Bottom Pattern & Bullish ActionIt is very easy to spot a reversal pattern and long-term lower low on this chart. This is the so called bullish lower low.
It is bullish because everything is about to grow.
We have two give away signals on the chart, the 1,2 sequence and the Adam & Eve formation.
We see a long lower wick on #1 and then a cup pattern as #2. Pretty interesting.
More interesting is the fact that we have so many green sessions recently. Even with Bitcoin turning red right now, as I write this, this pair continues full green.
The lower low means that the market no longer needs to hunt for liquidity and is ready for a new and strong bullish phase.
This one looks good now. Allow time for it to grow.
Patience is key.
In 2025 with Crypto, we can all achieve success, we can all win.
If you are reading this now, you have great timing.
And timing is really important because getting a low entry price makes it so easy when everything becomes fuzzy when the action is already underway.
I know it is hard to buy low, but you will be happy with the results.
Think long-term.
➖ Buy at the bottom.
➖ Sell at the top.
Namaste.

STGUSDT 1D#STG has broken out of the falling wedge to the upside and is now encountering the daily MA50. In the event of a successful retest of the pattern and flipping above the MA50, the targets are:
🎯 $0.4066
🎯 $0.5000
🎯 $0.5756
🎯 $0.6511
🎯 $0.7586

STGUSDT.4HReviewing the STG/USDT chart on a 4-hour timeframe reveals a persistent downtrend, characterized by lower highs and lower lows. This analysis draws from various technical indicators and chart patterns to evaluate the current market dynamics and potential future movements.
Key Observations:
Trend and Chart Patterns: The asset has formed a descending channel, confirmed by the alignment of lower peaks and troughs. This pattern typically indicates continued bearish momentum. The current price is nearing the lower boundary of this channel, suggesting a crucial testing point that could determine short-term market direction.
Resistance and Support Levels: The chart displays key resistance (R1) at around $0.4 and a stronger resistance (R2) at approximately $0.5188. Support levels (S2 and S3) are indicated lower on the chart, with the immediate support (S3) being tested. A break below this could lead to further declines.
MACD Indicator: The MACD line is below the signal line and both are trending downwards, which typically indicates bearish sentiment. The negative histogram further confirms this bearish trend.
RSI Indicator: The Relative Strength Index is near 45, which is neither oversold nor overbought. This indicates a somewhat balanced yet slightly bearish momentum, as it leans towards the lower end of the neutral range.
Technical Analysis and Conclusion:
Given the proximity to the lower boundary of the descending channel and the testing of support level S3, this is a critical juncture for STG/USDT. If the support holds, it could provide a rebound opportunity towards resistance levels R1 or potentially R2. However, a break below this support could exacerbate the bearish trend, potentially reaching new lows.
Trading Strategy:
For traders, the strategy would depend on the price action at the support level S3:
Bullish Scenario: If the price shows signs of recovery at S3 with increasing volume and a bullish reversal pattern, consider a long position with a target at R1 and a stop-loss just below the recent lows.
Bearish Scenario: If the price breaks below S3, a short position could be warranted, targeting further downward movement. The stop-loss in this case would be set just above the breakout point.
Investors should monitor further developments closely and adjust their strategies based on actual price movements and additional market factors. Always consider using stop-loss orders to manage risks effectively.

STG/USDT NEW BREAK POSSIBLITYSTG/USDT shows the low time frame possibility for new volume which can affect the price for an uptrend. ( depend all on high chance) There are no guarantees in the markets.
The new increase volume updates always start with interest if there is a confirmation to follow and if there is a building with a hold for a time.
90% of coins this time are not building coins. Some % also show a start fake trend and return to where it started. time frame confirmation + high levels building is important for a healthy coin.
There is a good chance for a break in the coming time.
Trend levels
The coin is on important break trend which means if it can get confirmed it will break.

STGUSDT(Stargate Finance) Updated till 11-08-24STGUSDT(Stargate Finance) Daily timeframe range. another alt retraced back from its new low. breaking 0.2815 can pull it back to price discovery again. now its trying for a clean close above 0.3604. if it can than it opens the door till 0.4771.

STG Long Term Profits PlanHello traders!
Currently, we are experiencing a big drop in Crypto but other markets have also been dropping hard. So, now instead of going all panic mode let's switch gears and plan ahead to take advantage of the buying opportunities. So, here's my plan in the long term for StarGate.
1) Right now, we can see price hit the Demand Zone which is the zone marked in green. It got pierced though recently after a real long time. However, it's turning into a hammer candle and reversing altogether which means strong buying pressure stepping and it could totally be a fakeout, so we should stay alert to see how it plays out.
Possible confirmations for the demand zone to be safe are: Wait for the price breakout and take a position when it re-test the zone back again.
In the future if the bearish trendline gets broken, we can expect an important rise on the price. We still have to deal with a strong supply zone which is marked in red. If price manages to pierce through the supply then we fly to the moon ♥ meanwhile, I'll be monitoring weekly and informing STG movements over time.
2) TARGETS: The nearest one would be 0.53, which would act as a mean reversion zone. After that, we can expect ranging, and we'll have to wait for signs and clues to find out what could possibly happen next. Targets long term: the supply zone and the ATH +
This idea is to spot for the long term. This asset is still in ranging mode; there hasn't been a breakout of the range yet. However, it's worth noting that there's a triangle pattern playing out in the monthly timeframe, right now.
I hope you find it useful and are able to take advantage of this idea.
Kina Tip of the Day: Take profits partially even when they don't seem much because, in the long run, they will grow in a balanced way with the rest of the portfolio.
Keep it shiny ⭐
Kina, The Girly Trader

STG Morning Doji Star 🍨 Massive GainsHey guys!
Well, first of all you don't want to miss this chance!
Here's my price action analysis for this coin:
We have a very strong upwards trendline that has been respected and bounced off from for 7 months. That's a huge hint to prove is a key area!
It has been faked out twice and everytime it bounced off from it, came back stronger than ever.
Last bounce we had not only it bounced off our upwards trendline but it also formed a strong bullish reversal candlestick pattern: Morning Doji Star!
We could say it's trying to break from the downwards move (pennant, triangle) these are very subjective but it adds up to the confluence ice cream bowl.
As a side note, candlestick patterns don't have a real meaning unless they happen at a high confluence zone then you really want to play attention to get on board on the train early!
Moreover, I recommend you trade SPOT this because market fluctuates and stops can get taken out in higher TF ideas. So HODL !
Targets area marked as TP1, TP2 and TP3
All the best,
Kina 🍨 The Girly Trader
