STMX BUY SETUPHi, dear traders. how are you ? Today we have a viewpoint to BUY/LONG the STMX symbol.
For risk management, please don't forget stop loss and capital management
When we reach the first target, save some profit and then change the stop to entry
Comment if you have any questions
Thank You
STMXUSDT trade ideas


STMXUSDT POSSIBLE SHORT CHANCEAs you can see in STMX, there is a shoulder head shoulder pattern, although it is not very symmetrical. But in 4 hours, if the candle closes below the line I draw, there may be a chance to open a short (it may be a trap). Also, profit sales can be made in the green boxes I draw (it is more logical to determine your profit yourself).
DEFINITELY NOT INVESTMENT ADVICE!!!

Short STMXSharing my first idea for a short on a failed bull pennant break out. Target down to .0065

$STMX, One of the few on the green today,$STMX
One of the few on the green today, will see if it can keep it this way with some much bearishness across the board.
UCTS 2D Buy signal a few days ago (20%+ up in profit so far)

stmxI am waiting for the collision on each of the red lines of the direction, the correction towards the trend line
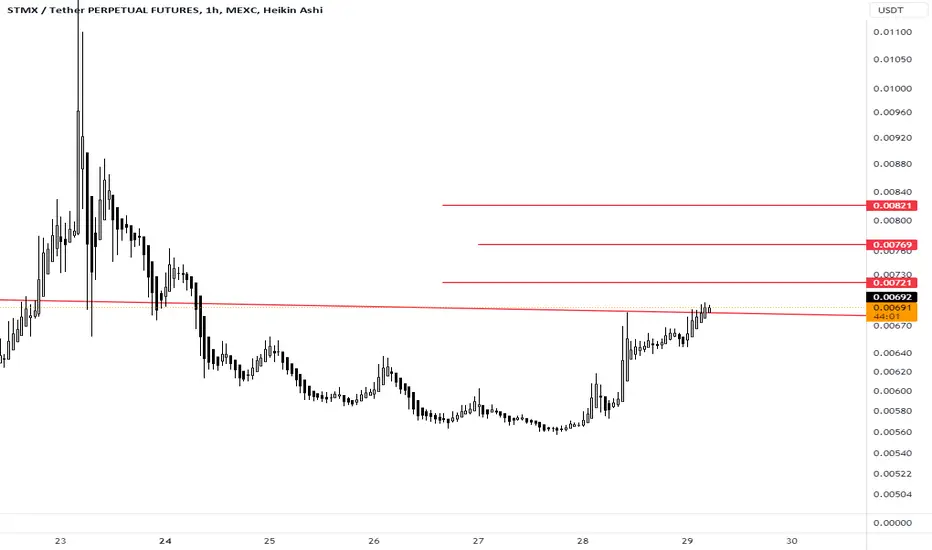
The support and resistance area around 0.007740 is importantHello?
Traders, welcome.
If you "Follow", you can always get new information quickly.
Please also click "Boost".
Have a good day.
-------------------------------------
(STMXUSDT chart)
(1M chart)
The key is whether it can find support above 0.005660 and rise above the MS-Signal indicator.
(1W chart)
Therefore, if it rises above 0.007740 and shows support, it is a buying time from a mid- to long-term perspective.
(1D chart)
From a short-term perspective, there is an uptrend as the price is holding above the HA-High indicator on the 1D chart.
However, if you refer to the explanations of the 1M chart and 1W chart, the important point is whether it can rise with support in the 0.005660-0.007740 range.
If supported and raised in this way,
1st: 0.012750
2nd: 0.019146-0.020898
The area around the 1st and 2nd above corresponds to the split selling section.
Therefore, it is recommended to proceed with buying when the HA-Low indicator or HA-High indicator on the 1D chart is newly created and shows support from the indicator.
------------------------------------------
There are a few coins (tokens) that are showing a lot of uptrend that I feel like I won't have a chance to buy unless I buy them right now.
However, if you look closely at support and resistance points, there are only a handful of coins (tokens) that break through significant support and resistance points upwards.
Therefore, you need to be very careful when trading coins (tokens) that are currently skyrocketing.
-------------------------------------------------- -------------------------------------------
** All descriptions are for reference only and do not guarantee profit or loss in investment.
** Even if you know other people's know-how, it takes a considerable period of time to make it your own.
** This is a chart created with my know-how.
---------------------------------

STMX COIN NEXT POSSIBLE MOVE!! STMX TRADE SETUP !$STMX Coin Update &Possible Move !!
• weekly candle bearish & almost in last 4 days price almost drop 37%+ without liquidation wick.
• MACD &RSI are Bearish on 1D &4H tf.
• Bounce back expected from its support area. ( fundametally weak so longterm trade not recomanded.
FOLLOW FOR MORE

STMX LIMIT SHORT FROM 0.0062STMX LIMIT SHORT FROM 0.0062 - STMX is very bullish, however it has some resistance
Put a limit sell to 0.0062 and wait
If BTC holds 29.5-30k range it could happen

STMX - short is possibleHI traders, short is possible here in my opinion. Only small position. This can be manipulated. Regards.

STMX/USDT Big Breakout Bull Flag So 12x Potential from My Entry? STMX/USDT Technical Analysis - Big Bull Flag Breakout Signals Potential 12x Gains!
Greetings, Crypto Traders! Today, we'll dive into a detailed technical analysis of the STMX/USDT trading pair, which has recently witnessed a significant bullish movement. As always, remember to exercise caution and follow proper risk management strategies. Let's explore the charts and identify potential entry and exit zones for maximum profit potential!
Weekly Time Frame Analysis
The STMX/USDT trading pair has just experienced a substantial breakout from a Big Bull Flag pattern on the weekly time frame. This bullish continuation pattern suggests the potential for further upward movement. However, we must exercise patience and avoid chasing the current price surge.
Buy Low, Sell High - Timing Matters
Considering the impressive 276% price surge in just 7 days, it is crucial to refrain from FOMO (Fear Of Missing Out). The smart approach is to wait for a retest of the breakout level before entering a position. Buying during a retest provides a more favorable risk-to-reward ratio and minimizes the risk of buying at the peak.
Best Accumulation Zone
In my opinion, the best accumulation zone lies in the range of $0.0042 to $0.0053. Waiting for the price to reach this zone will increase the likelihood of securing an advantageous entry position.
Long-Term Bullish Sentiment
The breakout from the Bull Flag pattern was accompanied by a significant surge in trading volume, indicating strong buying interest. This adds to the long-term bullish sentiment for STMX/USDT. However, a proper retest is essential to validate the strength of this breakout.
Price Targets and Potential Gains
Upon a successful retest, the next potential target for STMX/USDT lies around $0.060. This ambitious target represents a whopping 12x gain from the entry box. While aiming high is exciting, always remember to take profits along the way and adjust your stop-loss levels to secure your gains.
Critical Levels to Watch
Keep a close eye on the following levels:
Support: $0.0055 and $0.0042
Resistance: $0.0093, $0.025, and $0.058
These levels can offer valuable insights into market sentiment and potential price reactions.
Conclusion
The STMX/USDT trading pair has shown great potential with its recent Bull Flag breakout on the weekly time frame. However, exercising patience and waiting for a retest before entering a position is a prudent approach. Keep an eye on the critical support and resistance levels to gauge market dynamics. Remember, always trade responsibly, and stay informed about the latest market developments.
Happy trading and best of luck in your crypto endeavors!
Disclaimer: This analysis is not financial advice. Trading cryptocurrencies involves risk, and past performance is not indicative of future results. Always conduct your research and consult with a professional advisor before making investment decisions.
Follow us for More Quality Analysis.

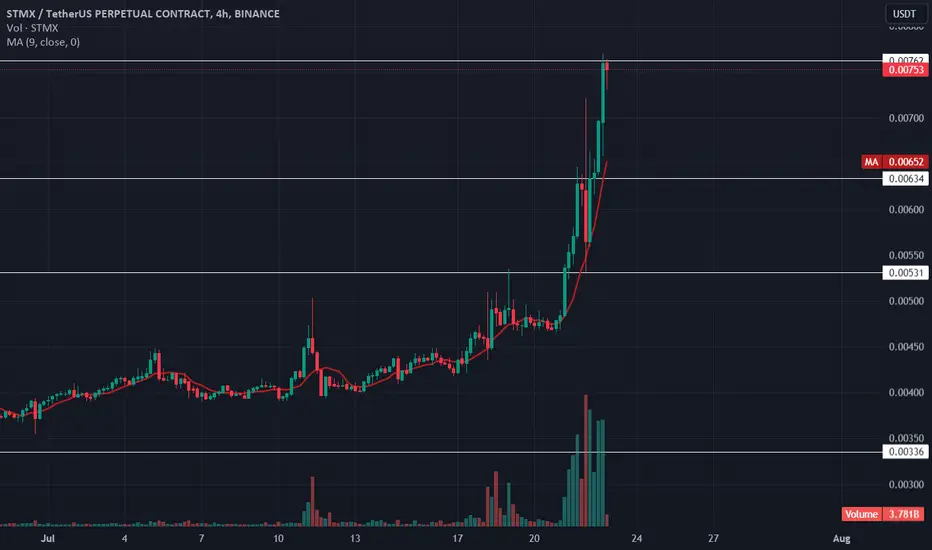
✴️ StormX | Highest Volume Since Aug 2022 Predicts Bullish WaveToday StormX (STMXUSDT) produced the highest daily volume since August 2022, the day might end up even higher.
This volume is coming as prices grow above EMA100, conquered yesterday, EMA50 and the rest of the short-term moving averages.
With the same pattern repeated, 1,2,3,4 steps, we know this pair to be entering #4, "A New Bullish Wave".
The volume is the only signal needed but a broken downtrend works as well.
Prepare for a bullish Storm, it is already taking place.
Namaste.

STMX continue pump after....STMX continue pump after squeze down i think
Possible move up minimum 30 %+

STMX USDT shortIn the chart, we can see that the resistance rejected STMX twice so we assume it will go and reverse.

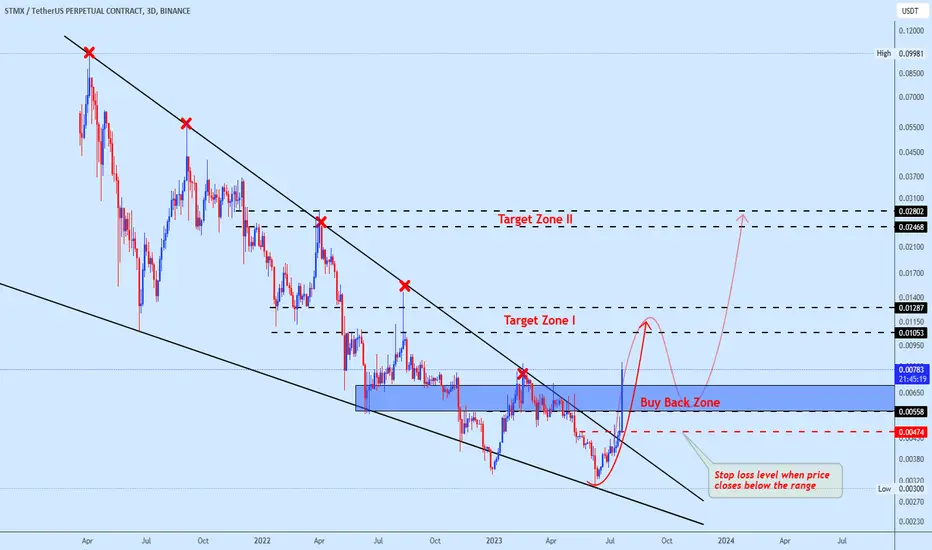
Stmxusdt trading opprotunityThis altcoin caught my attention after breaking out of strong downtrend, the volume look really strong and believe it still have more to offer. Immediate target area is shown as target Zone I and our final expected pattern target is around the target zone II.
Becareful and wait for potential pullback before picking your bags, suggest zone is given on the chart.
#STMX short#stmx short right now it having strong resistance upward that is not going to break easily. stay safe cheers.
STMXUSDT-END OF BULLISH TRENDSTMXUSDT in a 1-hour time frame is in a bullish trend but it may be the last HH as the rsi doesn't support the price action and makes the bearish divergence. We will wait for the price to make a LL.

STMXUSDT 3D#STMX has a Double Bottom pattern on high timeframe chart. Breaking of neckline will send it to the moon

STMX Short Scenario After close of first red candle on daily timeframe I will be looking for short position

STMX, Follow Up - TargetsHere are the projected targets for stmx, since i posted the educational on it, Take care guys\

STMX Thank you for the usdt- KnowledgeLets look at stmx and we are going to see how u trade the swing high. Now most of the coins I send are at the bottom waiting for the pump (more profit) but if u want to trade a pump this is what u look for:
You will notice that stmx is forming higher highs, you then want to find a position, Look for a period of consolidation on a support level in this case this was 0.00466, 40 hrs of consolidation testing support level 9 times. That is my first entry point.
I included another trade i sent in the bottom which will demonstrate this methodology
The second entry point for those who like to trade pump is on the breakout and retest, you will see we broke out and retested the trendline for 3 hours, then the pump. I presume everyone knows the right way to draw a trendline.
That is it basically, You need to hunt for trades that are "boring" and trade into the excitement.
I included another trade i sent in the bottom so u can see this trading method on a trade i sent

Stmx Getting Ready For Massive Recovery Seems Like Ready For Massive Recovery Macd Crossover Showing Bulls Strength
Formed Falling Wedge In 3 days Tf Incase Of Breakout Expecting 300 to 340% Bullish Rally In Midterm
