StorJ | Bullish Wave FractalThe altcoins are heating up but this is happening just now. As you can see from this chart, some are yet to start moving altogether, and this is good. Early is best for maximum growth and profits potential.
How are you feeling this Thursday?
As the summer goes into full swing, the high season, cryptocurrency starts move... Nice timing whales!
1) A massive downtrend comes first.
The market moves in cycles and within these cycles we have waves. A downtrend is also a down-wave. After a down-wave comes an uptrend.
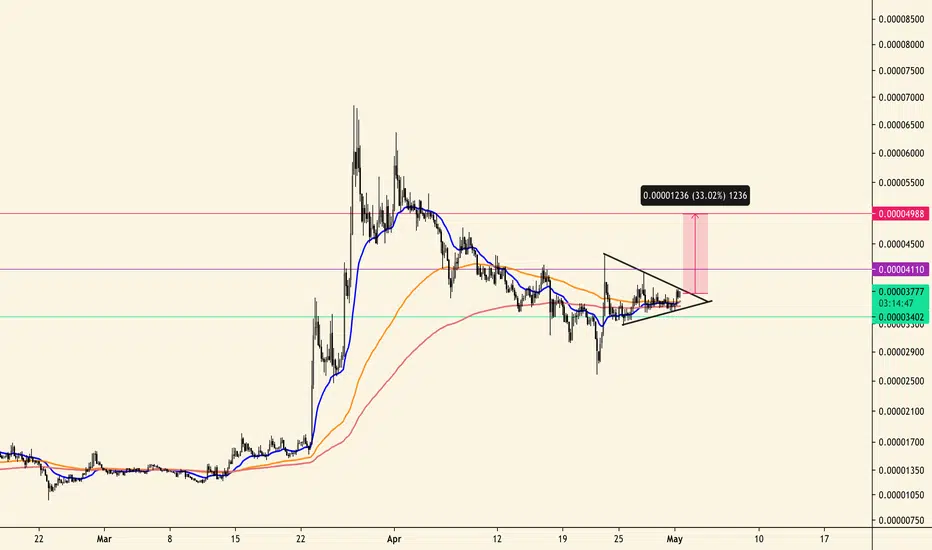
2) When the downtrend stalls, its bottom becomes flat, we have a consolidation phase.
Between each wave there is always a period of rest. Between each day, there is always a period of rest (sleep). Between each week, there is always a period of rest (the weekend). Between each year, there is always a period of rest (vacations). And so nature goes on reproducing its cycles all across.
There is a period of consolidation/accumulation before the market turns. StorJ is now in a two months long consolidation period; sideways price action.
3) After consolidation, a new bullish wave develops.
Invariably, when the bearish wave is over, the market experiences growth.
It can take longer than expected; market conditions can always change. There can be surprises and shakeouts, but growth is coming nonetheless. Patience is key.
Thank you for reading, and for thank you your continued support.
Remember to share.
Namaste.
STORJBTC trade ideas

✳️ Storj Activates 2021 Long-Term 700% Bullish Wave SupportMore than two years and a half ago, back in December 2020, STORJBTC hit a low that lead to a 720% bullish wave. Last month this same level was activated.
We don't have to go any deeper into technical analysis, this is quite telling.
The repeat of this pattern; The activation of this long-term support can lead to a very strong new bullish wave.
Use this information wisely.
The Cryptocurrency market offers endless opportunities, this is just one of those.
Namaste.

✳️ Storj Double Bullish ConfirmationHere we have a major jump June/July and this is followed by a 100%+ correction of this jump.
While the correction wicked lower in August compared to June, the trading volume is lower and the session close higher; which translate as a bullish bias.
This bullish bias is true and confirmed because today we have high volume as prices move above EMA50. Very strong bullish indicators.
As usual, when one Altcoin goes bullish many others tend to do the same and this happening true now, as we can see Altcoins growing daily in the high two digits, some even 3 digits in a single day.
Storj is getting ready for another one, a new bullish wave.
Namaste.

STORJBTC - Significant Break on Strong TrendlineSTORJBTC has been trending downward for the best part of a year now, after an explosive upward move previously.
With a bearish market around for so long and the descending trend line having been tested on many occasions, resulting in a price rejection every time, it has now finally broken through!
We've got a strong Buy signal from CTv2 and can see 3 clear Take Profit levels - 15%, 35% and 50% respectively, this could be a really nice trade here! ✌️
If you enjoyed or agree with this idea - drop us a comment, like & follow! :)

#STORJBTC - Retracement After BreakouttheCrypster -
After a nice 20% break upward of the pretty clear wedge #Storj had been trending for a while, we can now see a retracement forming as the price will be heading back down to recent support levels.
We should be expecting a drop of around 15% before support shows it's strength.
If you enjoyed or agree with this idea - drop us a comment, like & follow! :)

STORJBTC - Ascending triangle on the weekly! + Record volume- On the weekly chart we can see a beautiful ascending triangle - one of the most bullish pattern.
- If we take a look at the volume indicator - there is a massive volume spike, which is positive.
- The first impulse wave has been completed (hard to catch), but it doesn't matter, because the third wave is usually the strongest!
- You can buy a breakout above the ascending triangle and take profit at the all time high level.
- 20x is possible in next months!
- Look at my ideas about another interesting altcoins in the related section down below ↓
- For more ideas please hit "Like" & "Follow"!

Storj Goes Bullish vs Bitcoin (Easy 50% + More)When it comes to the BTC pair, STORJBTC, we can see the chart technicals going bullish...
Feel free to hit LIKE and let's look at those.
Our classic signals go as follows:
The RSI is now bullish/strong above 50.
The MACD is bullish above 0, with green histogram.
STORJBTC has gone above EMA10, EMA21 and EMA50.
Really high volume to break above EMA50.
We can see easily a 50% jump short-term, follow by more mid-term.
This is not financial advice.
Thank you, ALWAYS, for reading.
Namaste.

STORJ WHALEPreviously ...
For information on BTC volatility follow our BTC ROADMAP chart.
Apparently your likes makes me the best lol

STORJ ready to flySTORJ has now recovered with bullish candles from a downtrend after a bullish divergence appearing on 12hr and 4hr timeframes.
Storj is currently holding on to EMA50 and aiming to take EMA200.
Ichi span has exited out of a downtrend channel but still aiming downwards meaning it's too soon to enter this trade.
The recent buy-volume has secured Storj a double bottom since Aug 19th and we are to place our SL exactly under the range of the previous Ichi channel below the double bottom zone.
Keep in mind to profit-trail after your entry.
BTC's safe range for this trade is between 6800~8200.

Storj STORJBTC - Ascending triangle on the weekly scale!- STORJ - Rank #128 - Token.
- On the weekly scale we can spot a beautiful ascending triangle, bullish pattern.
- Also the price recently broke out of the falling wedge with a successful retest.
- We can target a previous all time high as a profit target.


STORJBTC Daily Technical AnalysisSTORJBTC Daily Technical Analysis
All indicators are POSSITIVE
Resistance: 0.00002791 - 0.00003550
Support: 0.00002158 - 0.00001887
If broke 2791 target be 3550

STORJ /BTC Bullish scenarioMaking higher lows on Monthly
Momentum shifting (MACD) on weekly
If we break 3045 this thing could fly fast to
TP lvls
4286
7012
11217


StorJ Can Easily Do 150%... See Inside (Explained)Here is one of those that peaked early...
STORJBTC peaked in March 2021 and has been consolidating for 5 months now... Quite the long while.
We are within a higher low when you look back at Jan. 2021, the low hit there.
The next low was hit June 2021, 6 months later.
The signal to look for in this chart are the Moving Average lines (MAs or EMAs).
We have EMA10, EMA21, EMA50, EMA100, EMA200, EMA300 and MA200.
All these lines are basically sitting at the same price, very close to each other in the 0.00002550 - 0.00002660 price range.
The bullish signal?
STORJBTC is now trading above all these...
After months of consolidation, this can lead to a strong price increase.
The RSI also supports such a move; price increase.
In this chart I am mapping a 150% jump... But there can surely be more.
Warning: Prices can also/always drop.
Make sure to build your own plan, plan ahead...
What to do if prices go down instead of up?
Will you wait patiently and hold?
Will you sell at a loss?
It is your job to plan and decide.
Thanks a lot for your support.
Namaste.


$STORJ, As example of what most alts are showing..$STORJ
As example of what most alts are showing..
Look for crosses/flips of current resistances as signal of strength/continuation...


STORJ: 6.5k - 10k - 13.5k - 15.5k stsSTORJ is ending correction: time to be pumped to:
6.5k - 10k - 13.5k - 15.5k sts

#STORJ #STORJBTC #STORJBTCLONG #BINANCEYOU CAN SEE THAT #STORJ IS VERY WELL SUPPORTED ON THE '' SUPPORT ZONE '' AND '' EMA 20 '' AND IT CAN ACHIEVE THE TARGETS.

STORJ starting a STRONG TRENDSTORJBTC is looking pretty strong
With a new and bullish uptrend, started with strong volume and pretty impressive PA, with a clear close above the 180 EMA
If we manage to turn the previous resistance into support, we might have a good shot at continuing this uptrend.

STORJ/BTC Triangle & EMA Support1. Triangle consolidation
2. 4H 21/100/200 EMA support
3. 4H supertrend
Target the red line @ 498 sats