STORJBTC trade ideas
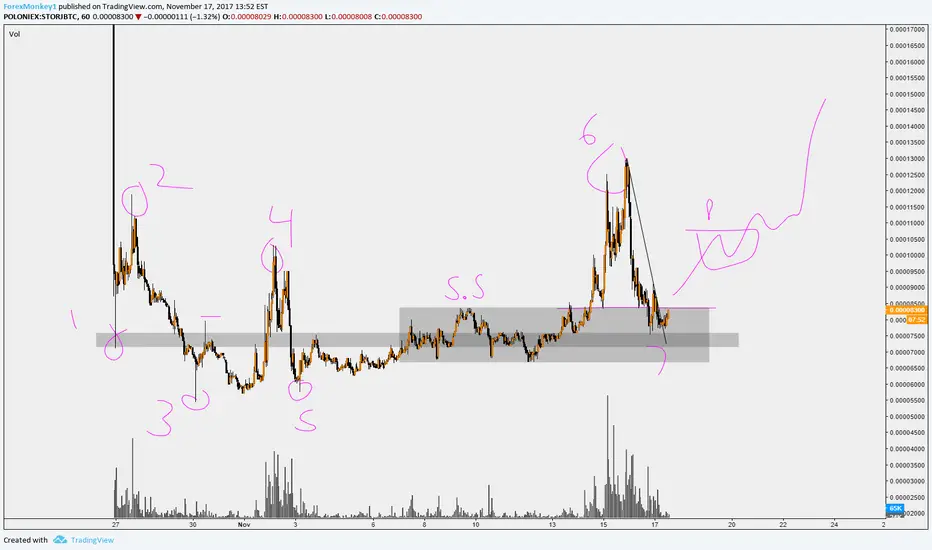
STORJBTC 12H Bittrex – falling wedge and trendlineSTORJ broke smaller falling wedge (red) yesterday with nice volume push against BTC. Now attempting the downtrend line of a broader falling wedge starting from 0.00023 level. I expect 2 scenarios for long:
1. The downtrend line of the broad falling wedge will not break now but there will be a retrace to the trend-line (blue line) first and then break-out of the falling wedge – in that scenario I would buy in the breakout (with BTC is being very close now to the angle of an ascending triangle and so potentially a decision will be coming shortly I would expect this scenario more likely than #2 below).
2. The downtrend line of the broad falling wedge will be broken very shortly without having a retrace to blue trend-line. In that case I would wait for a pull-back after break-out to the new support line and/or to the blue trend-line and looking for reversal.
I would set TP targets to 0.382, 0.618 and 1 fib levels of previous upswing – respectively 0.000121, 0.000161, 0.000231 levels. SL can be defined either by breaking the blue trend-line or wait until reaching levels under 0.0008 (depending the risk I might be willing to take) that would negate the possibility of having a double-bottom scenario and would point to a further downtrend possibly.
Please note – these are my own views on my potential trade setup. Please do your own research and trade carefully!
STORJ Bull - The Ratio is on our sideSTORJ tingles the trading instincts.
Oversold daily RSI,
MACD crossing could mean weeks of bullish movement,
Falling Wedge (bullish pattern),
.786 Fibonacci bounce,
In summation: Great Risk:Reward Ratio.
This project is NOT going to zero; time to buy the on-sale STORJ Tokens.
Storj/Bitcoin Long Setup This coin has a lot of bullish potential, as you can see from the chart the price has painted a huge triangle which can indicate a breakout and profit opportunity. You can set buy orders in the green box between 8,000 - 10,000 satoshies and set a target of 20,000+ satoshi. I would also like to mention bullish MACD cross upcoming if the price in fact would breakout, I have included two scenarios because a potential lower low is possible which being aware of multiple possibilities can give you confidence in your trading. :D
Storj (STORJ) Technical Analysis and Trade Set-up. Tune In!Welcome to my TA on BINANCE:STORJBTC ! I've been long this coin November of last year, but this is my first public analysis on it. I'm long-term bullish about this asset, as it seems to solve an actual problem facing us in the future. Considering the rise of IOT devices, it makes sense that even storage should be distributed with the ability to charge very small amounts of money for services. BINANCE:STORJBTC has taken a beating since COINBASE:BTCUSD took down the whole market, but I'm seeing a slowing of a downtrend in, what I think, is a preparation for a rebound. This has been a common trend that I've seen in smaller-cap cryptos experiencing a downtrend. Here are the key characteristics that I've been seeing:
Established downward-trending channel
Pattern of touches on a parabolic line, showing a flattening towards the right
Healthy swings in RSI, with oversold indicators towards this flattening region
What I'm seeing here is strong evidence of a flattening region in preparation for a reversal. The coming days will show us which direction we're headed. If we do see a reversal, I'll post another trade idea with buy in, stop loss, and trading targets. I'd like to hear your thoughts on BINANCE:STORJBTC , especially if you're trading/looking to trade! Please comment below, as the more input we see, the more informed we are!
*** This is not a recommendation to buy or sell, this is for educational purposes only! ***
STORJ/BTC - 2/13/2018After reacting well to a double top pattern, STORJ/BTC began its decline like every other coin currently. Since January it has been forming consolidation in the form of a descending triangle. Although the prices match the pattern in the forms of higher lower highs and relatively the same lows, this is not a great sign for holders of the coin. In the long-term, because the descending triangle is a continuation pattern, this means the price is expected to continue in this downtrend for the length of the breakout of this triangle IF it is broken (and accurate). Inside the triangle though, lies some hope. There is an ascending triangle formation that is forming inside of the larger scale triangle. If this ascending triangle is broken correctly, the price may be able to escape its current drought and prevent the price from entering a major decline if the descending triangle is broken. Although, the RSI (debatably) shows a triple top that may indicate a reversal, in this case, continuing to form the descending triangle and perhaps break.
Important Resistance Levels: 12110, 14361, 16336
Important Support Levels: 9918, 8059
DISCLAIMER
WITH THIS CONTENT CRYPTOCURRENCY CAPITAL LLC OR ITS AFFILIATES DO NOT PROVIDE INVESTMENT, TAX, LEGAL OR ACCOUNTING ADVICE. THIS MATERIAL HAS BEEN PREPARED FOR INFORMATIONAL PURPOSES ONLY AND IS NOT INTENDED TO PROVIDE, AND SHOULD NOT BE RELIED ON FOR, TAX, LEGAL, ACCOUNTING OR INVESTMENT ADVICE. YOU SHOULD CONSULT YOUR OWN INVESTMENT, TAX, LEGAL AND ACCOUNTING ADVISORS BEFORE ENGAGING IN ANY TRANSACTION AT YOUR OWN RISK.
CONFLICTS OF INTEREST
GIVEN THE NATURE OF THE FUND’S BUSINESS MODEL, IT IS NOT POSSIBLE TO FORESEE AND PREVENT ALL POSSIBLE CONFLICTS OF INTEREST THAT MIGHT ARISE OVER THE LIFESPAN OF THE COMPANY. AT THE TIME MATERIAL WAS PUBLISHED, CRYPTOCURRENCY CAPITAL LLC, ITS AFFILIATES, OR ITS PRINCIPALS, MAY HOLD LONG/SHORT POSITIONS IN THIS PARTICULAR COIN.
Written by:
Arham Bheda
Senior Research Analyst
The Support Line: EP2 -- Price Action & Naked Charts!Howdy Yall!
Today on The Support Line we are going to walk through Price Action, what it means, and how to find a trend using nothing but the price action. Furthermore its going to help us keep our charts clean, and can help us remove some silly indicators which we may not need! Whoa!
Remember, if you click the share button towards the top right of this write-up you can choose "Make it Mine" and look at this chart in your own window, and you'll be able to edit it, and use the "camera" button to post it back here in the comments section... to ask questions, or ask for more advice. That is a great feature -- and I can't wait for one of you to use it! (Hint!)