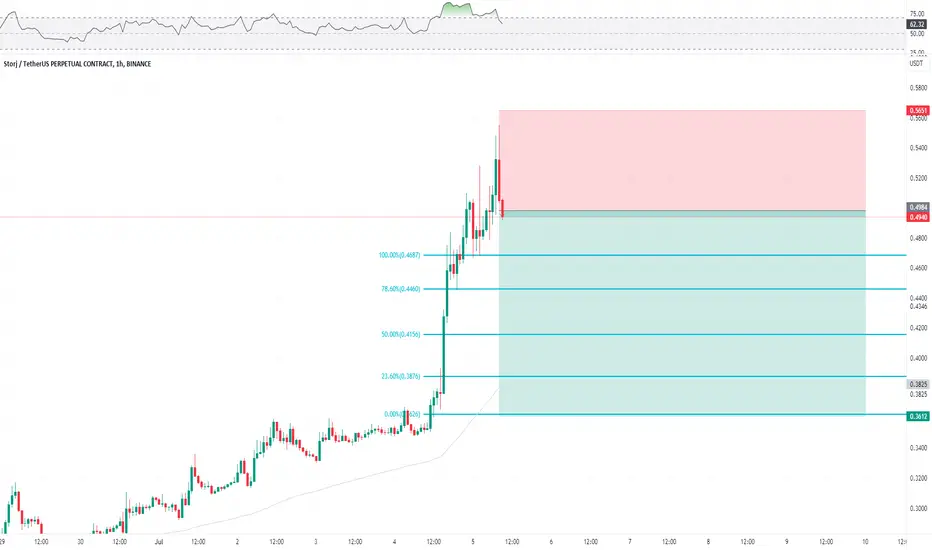
STORJUSDTHello friends. I hope you all made a profit from this scary Bitcoin candle. In this post, we will review the BINANCE:STORJUSDT . The conditions of this currency are as follows:
We had a big sharp move that led to a 185% increase in price.
But since then, the price has been falling without a retracement to this day.
This is a sensitive and important point for this currency.
Why?
Because in this range we have a strong weekly support area with high density, and this point is also the location of the 0.786 Fibonacci line, which can really be a good support.
I myself bought at 0.295 and consider the Fibonacci upper lines as my target.
Good luck and profit!
⚠️ "Daily crypto market analyses I provide are personal opinions & not financial advice. Trading carries risks, so do your own research & seek advisor's help."
Don't forget to like and comment
STORJUSDT trade ideas


STORJ GOING SHORTSTORJ going short now, this setup will trigger down with bearish divergence at resistance

SELL SIGNAL The information I share on this platform is based on my personal opinion and experience, and should not be considered as financial advice. You are responsible for your own investment decisions and should always do your own research before making any trades. I do not guarantee the accuracy or validity of any data or analysis I provide. Please use your own judgement and caution when following any call or signal I post. #imo
NOTE:
25% PROFITS AT EVERRY FIBONACCI RETRACEMENT LEVEL.
USE ISOLATED (FOR CRYPTO EXCHANGE)
USE CAPITAL RATIO (5 - 10 % OF YOUR CAPITAL)
DONT FOMO (FEAR OF MISSING OUT)
If you want to trade crypto successfully, you need to follow some basic rules. One of them is to use isolated margin for your trades. This means that you only risk a fixed amount of your capital for each trade, and you don't borrow more than you can afford to lose. This way, you can avoid liquidation and protect your account balance.
Another rule is to trust the process. Trading is not a get-rich-quick scheme, but a long-term game that requires patience and discipline. You need to have a trading plan and stick to it, regardless of the market fluctuations. Don't let your emotions get the best of you and don't chase unrealistic profits.
A third rule is to use capital ratio for your trades. This means that you divide your capital by 10 and use only one-tenth of it for each trade. This will help you diversify your portfolio and reduce your risk exposure. You can also adjust your position size according to the market conditions and your risk appetite.
Finally, a fourth rule is to avoid FOMO (fear of missing out). This is a common psychological trap that makes traders enter or exit trades based on hype or panic, rather than logic or analysis. FOMO can lead to overtrading, poor decision making, and unnecessary losses. You need to be confident in your own strategy and not follow the crowd blindly.
By following these four rules, you can improve your chances of success in crypto trading and enjoy the benefits of capital ratio.
STORJUSDTBig bearish divergence shown in RSI.
After that trend is reverse.
we wait for the breakout of last LL.


Storj must be squeze up 20 %+
Storj must be squeze up, for liquidation shorts
1 TP - real target
2 TP - possible

storjIt reacted in the first resistance zone. I am waiting for the correction for each of the green lines and even the green box to buy for higher goals. Of course, confirming the movement and trend is very important.

STORJ SHORT SIGNALShort the weekly lvl and make good profits from the market today.
In case of breakout I marked on the chart also the second and third entry to get out in profits.
Trade just the money that you can afford to lose. Peace.

STORJUSDTHello Crypto Lovers, This is a 1D frame analysis for STORJUSDT After breaking the white resistance line, the price was able to experience a good rise. Currently, the price is in a resistance area and a supply area, and there is a possibility of price correction to our first support area and then bouncing back to its own breakdown point. If the daily candle cannot establish above the resistance line, the possibility of price correction towards our support line will be stronger. However, if it can establish above the resistance line, it can touch higher numbers. Warning: This is just a suggestion and we do not guarantee profits. We advise you to analyze the chart before opening any positions. Take care

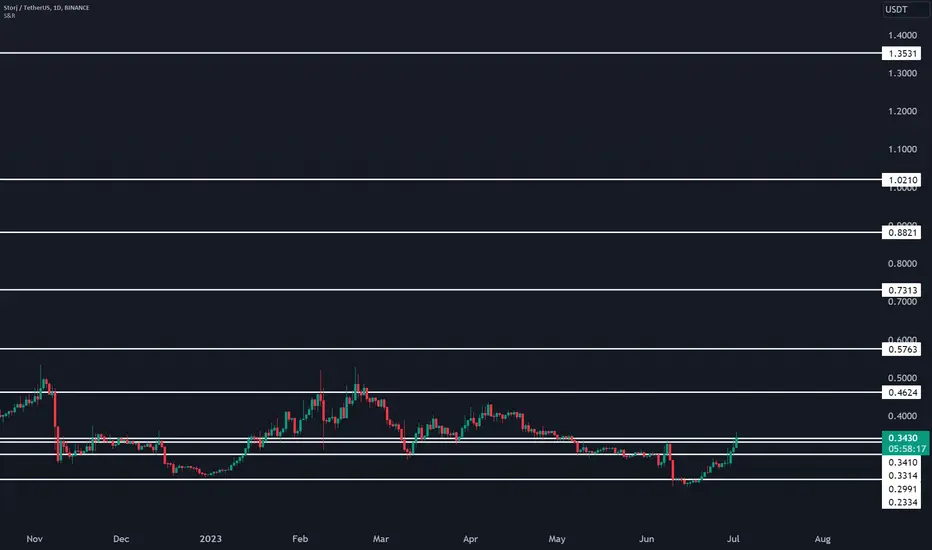
Storj support & resistance Storj support & resistance
0.233354204
0.299111269
0.331423762
0.341017554
0.462350692
0.57633271
0.731297968
0.882091972
1.021039544
1.353053449

Storj Looks Promising For MidtermStill Consolidating In Falling Wedge The More It Will Consolidate The Higher Chances Will Be For Breakout
Incase Of Successful Breakout Expecting 260 - 300% Bullish Rally


STORJ Looking bullish (Long Entry Setup)Looks like this is a bearish market manipulation to hunt the stops and start to rally from the highlighted entry area.
NFA

Storj Breakout Storjusdt
Breaking out the trendline resistance on higher time-frame incase of succesful breakout expecting massive bullish move

Storj Showing bullish Signs
Decent Volume Coming In Macd Crossover Confirming Bullish Strength
While Formed Text Book Descending Channel & Building Up For Massive Breakout
Incase Of Breakout Expecting 300 - 320% Bullish Wave In Midterm

STORJUSDTSTORJUSDT seems to be retesting resistance. So far the resistance seems to be holding, I am expecting a drop from the current position. A move a above the previous high would negate this plan. I expect a drop to make a new lower low.

STORJ sat on key support looking to push upSTORJ sat on key support looking to push up
Everything is lining up for STORJ to bounce from a key support with an oversold divergence showing
| Untested Weekly Pivot
| Long Term Support
| Bullish Signal
| Breakout on Key CVD Trendline
| Bullish Divergence + Oversold

STROJ to the Moon Really good buy opportunity ...
Buy now or wait till price will touch Trendline...
We have really good support zone

Storj (STORJ) to $2. SoonishSo much going on in the above daily chart, multiple reasons to be bullish.
1) There was a ‘incredible buy’ signal, just did not get around to sharing. See 2-day chart below.
2) Price action has broken out from long term resistance since November 2021 as shown by the black arrow, do you see it?
3) Most recently price action has broken out from a bull flag formation during a month long consolidation period.
4) The Bull flag ‘flagpole’ extension measures a target to around $2, that’s almost 200% from current levels.
5) Price action consolidates on the golden ratio.
6) The Fibonacci golden ratio extension (1.618) measures out to the same target!
Is it possible price action falls further? Sure.
Is it probable? No
Ww
Type: trade
Risk: 6% of portfolio
Timeframe: no idea
Return: 200%
2-day chart

StorJ coming downmeasured move to the downside 0.3556 then move downside momentum to follow stay tuned... happy trading folks

STORJ/USDT broke the trend! Good morning guys
STORJ had a nice breakdown here which has been confirmed as well for now. We are looking for the price to reach for those blue lines on the upcoming week so let's wait and see!
If you like ideas provided by our team you can show us your support by liking and commenting.
Yours Sincerely,
Swallow Team 🔱
Disclamer:
We are not financial advisors. The content that we share on this website are for educational purposes and are our own personal opinions.
