STRAXBTC - Long - Potential 13.80%STRAXBTC - Long - Potential 13.80%
Exchanges: Binance
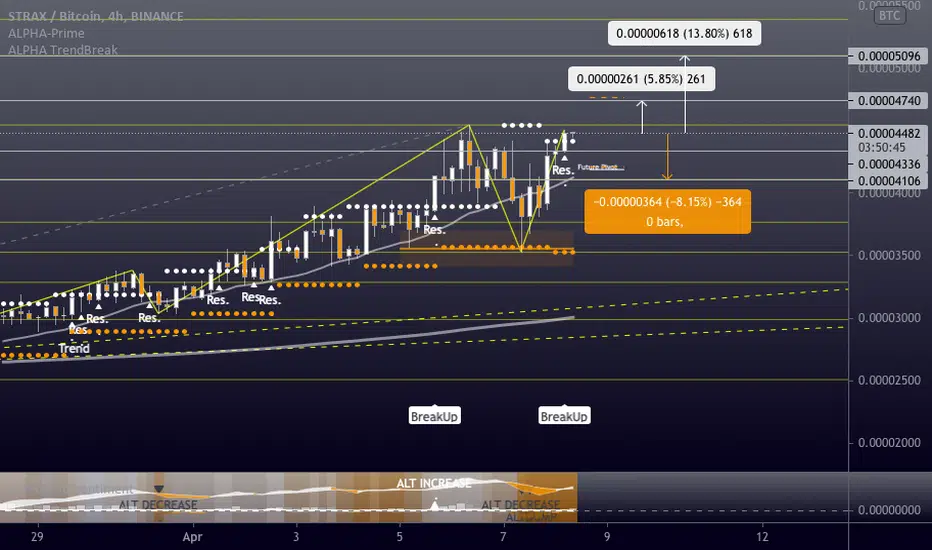
Signal Type: Regular (Long)
Entry Zone:
0.00004336 - 0.00004477
Take-Profit Targets:
1) 0.00004740
2) 0.00005096
Stop Targets:
1) 0.00004106
Trailing Configuration:
Entry: Percentage (0.0%)
STRAXBTC trade ideas
STRAX - Bullish Breakout, Huge Potential!I really like this entry on Stratis vs BTC. We have a bullish breakout on on the weekly and a bullish MACD about to cross the zero-line. I think the price could really fly. I'm long here.

STRAX/BTC huge upside potentialTo see its true upwards potential you need to take a look at #BTC pair. On the monthly chart there is basically no resistance until 20k ($12 at current rates), on weekly there only is 8k resistance on the way to 20k. USDT pair has already broken out of the longterm downtrend and now we just have to wait for this one to follow. The upside potential is huge!
This is not a financial advise, always DYOR!


STRAXBTC Daliy bullish right after breaking R
this is how i see it after breaking R WHICH IS around 0.00003448 do you agree?

STRAXBTCThere's a daily MA200 that needs to be broken, there's also a long support line that has started in Jan but maybe breaks it
Not financial advice, do your research


STRAX/BTC Are you looking for 10-50x ? There you goThere was no nice chart for STRAX/USDT so I had to take BTC.
Stratis is on the way upwards and is just starting its bullrun so it maybe will make its 10x move the next weeks.
We just broke out of the last small downtrend.
Enjoy the ride and don't be too greedy.
If you like the content, please like, comment and give this channel a follow.
Always do your own research and keep in mind that my charts and comments cannot be considered financial advice.
Cheers
ps.
Chart explanation:
Main lines:
- Green lines are tested support lines.
- Orange lines are resistance lines or, if we are above, possible support lines which were not tested yet.
- Cyan line is for volume trendline.
Helplines:
- Purple lines are trendlines we take a look at.
- Yellow lines are for visual help only.


STRAX BTC LONG SIGNAL"strax " uniswap announcement.
Blueline: safe enter but you can enter in actual price and take TP in the blue line.

STRAX looks great hereYOUR LIKE OR COMMENT IS MY FUEL FOR NEXT ANALYSIS :) IF U HAVE ANY QUESTION REACH ME HERE
This is not a financial advice. Always do your own research and always put stoploss in your trade (SL) :) If you want more detailed info how to study and read charts or just need help with some coin, just write to me here a comment, i will try to answer to everybody... i can help you :) all for free, don't worry, BE HAPPY!
If u like the analysis, please feel free to ask any question about this TA or crypto or any coin - leave a comment or like or share the idea, i really appreciate it because then my work makes sense :) thanks!

STRAX can be doing very well in the upcoming days/weeks#STRAX / BTC ( BINANCE )
Buy Range : 0.00002460-2480
Stop Loss : Daily close below 0.00001990
Target 1: 0.00002790
Target 2: 0.00003150
- Good moment to trade STRAX once again after have around 40% profit in our last spot trade
- STRAX is bouncing from the MA200 in 4h and looking to the recent past this could be the lowest point to buy while we stay in a bull market.
- RSI touched oversold zone and price action back above MA200
- In hourly timeframes we could be looking for a retest ( Double bottom ) or a higher low before have a go higher. But this zone should be good place to buy as others does.
Good risk/reward. Looking for a upside movement in the following days.
More spot and futures trades in my premium service.

stratis i think it could bounce off this level, should it not , it will fall straight to the next so keep checking how it develops

STRAX/BTC MID TERM TARGETSTRAX/BTC is taking preparation for a major big pump. take your position for the long term. Red zone is the target zone.

STRAX can do it !#STRAX / BTC ( BINANCE )
Buy Range : 0.00002425
Stop Loss : Daily close below 0.00001900
Target 1: 0.00003310
- STRAX still looking for higher level after a perfect pullback in daily MA50
- Big resistance at daily ma200 and last support is my logical target to take profit. We could be looking for more upside if is able to break above and stay.
- Altcoins still looking good against bitcoin, so that's a great r/r
- MACD turned quickly to bullish way means upside hasn't ended yet.
- Bullish price action in weekly scale too
- We can a clear resistance in our target. However, i think it could be flying to 5800 sats perfectly as next target.
- Indicators looks bullish here too
GL !
More trades in our premium service.

STRAX / BTC Looking good for a try !#STRAX / BTC ( BINANCE )
Buy Range : 0.00001382-1450
Stop Loss : Daily close below 0.00001175
Target 1: 0.00001986
STRAX is performing really well in the last week. We see how price is trying to break above moving averages while oscilators are pushing higher
- RSI leave oversold area pointing up
- Momentum indicators suggesting turning into green territory
- MACD , STOCH and CCi looking bullish
- RSI bullish divergency in Weekly chart
- Last week candle suggest bear action has ended and we can expect some bounce up
- Dominance is going down and many alts are outperforming bitcoin. I think this target is perfectly reachable for strax ( old strat ) . If we see a closed candle below daily MA , then we have to be a bit careful.
Remember use correctly your funds.
Good luck

STRAXBTC - Long - Potential 13.65%STRAXBTC - Long - Potential 13.65%
Entry- 1883
TP1- 2024
TP2- 2146
SL-
- Trigger - Harmonics
- BTC - Dominance stablising - Price stabilising
- RR - 1.65
- Trailing Buy - 1%
- Trailing Profit - 1%
- Trailing Stop-Loss - no

STRAXBTCThis very calmly has come across the MA360 but at one point it may have a jump which it hasn't made yet

STRAX / BTC LONG Breakout on usd pair. volume increasing, good announcements and big partnership coming next week.

STRAX ( THE FORGTTEN COIN )Strax shows a nice pattern and ready to take off soon
Are u ready?
Seat belt and enjoy!

Stratis STRAX/BTC -45 % in 2 monthPrice of STRAX/BTC (old Stratis) can go down to 1000 sat easy.
Possible unregistered security token.
Ideal bay area between 800-1000 satoshi
Not a financial advisor, just my idea.

STRAX Gains Bullish Momentum, Will Grow Strong! (333%+)STRAXBTC is now showing really strong bullish momentum developing.
We can see the highest volume this week in several months.
The price is currently above EMA21 (this signal only confirms after the weekly candle closes).
A strong RSI and bullish divergence with the MACD.
The targets are marked on the chart based on Fibs.
-----
I love you, my fellow cryptocurrency trader.
Stay strong...
Keep growing!
Accept wealth!
You are the best!
You deserve the best... Always!
Namaste.
