My Long Shot This Cycle Starknet's Post-Listing Crucible: Forging a Bottom for the Next Rally
From Airdrop Volatility to a Foundational Base: Starknet's Path Forward in 2025
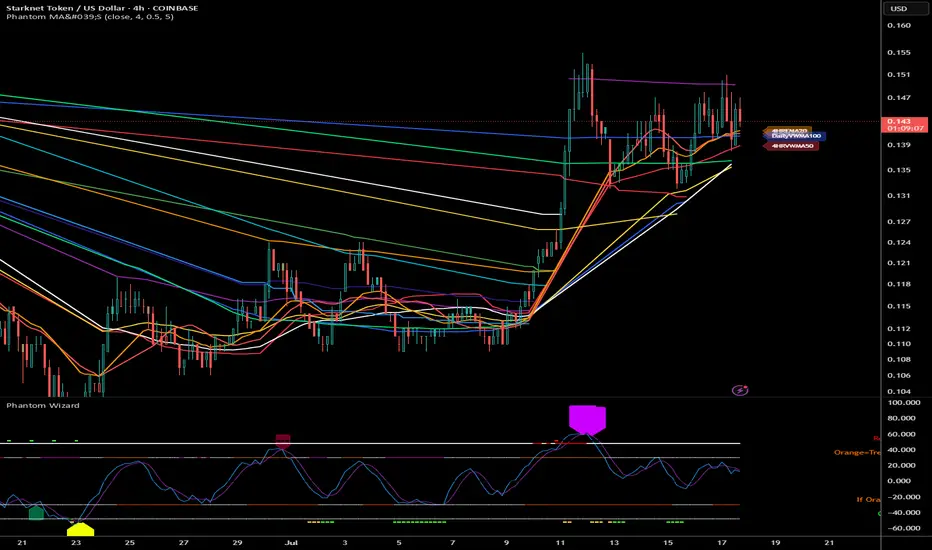
Starknet (STRK) is currently navigating the most critical phase of its young market lifecycle: the post-listing price discovery. Trading at approximately $0.143 as of July 17, 2025, the asset is emerging from the crucible of its initial token generation event. The preceding price action was not a traditional bear market but a period of intense supply absorption, primarily driven by airdrop recipients and early-stage investors. The chart now suggests this initial selling pressure is waning, and a structured accumulation base is being forged.
Current Market Context
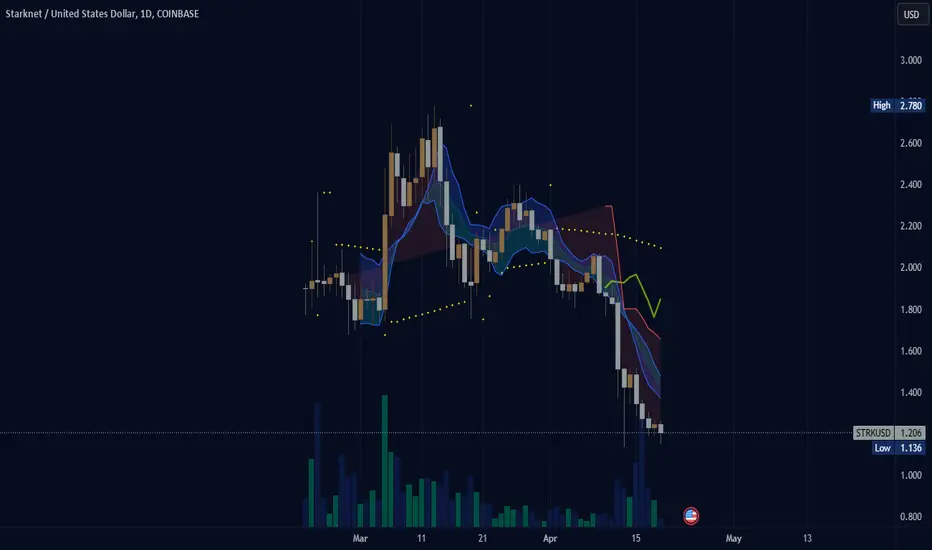
The data captures the aftermath of STRK's launch. After an initial period of high volatility, the price entered a significant downtrend, culminating in a capitulation low of $0.096 in March 2025. This level represents the point of peak supply saturation, where the last of the short-term sellers likely capitulated into the hands of long-term conviction buyers. The subsequent price action has been a slow, methodical grind upwards, a textbook sign that the market is building a cause for a future, more sustainable trend.
Wyckoff Accumulation Schematic: Interpreting the Post-Launch Bottom
The price action from February to July 2025 aligns perfectly with a Wyckoff accumulation schematic, providing a powerful framework for understanding the market's behaviour after the initial listing supply shock.
Selling Climax (SC): The low at $0.096 represents the climax of airdrop-related selling pressure. This is the genesis low where the market first found significant, high-conviction demand.
Automatic Rally (AR) & Secondary Test (ST): The bounce to ~$0.13 (the AR) and the subsequent retest of the lows (the ST) established the boundaries of the new accumulation trading range. This phase defined the battlefield between residual supply and emerging demand.
Phase C - The Spring: The dip to $0.121 in late April served as a classic "Spring." This final shakeout was designed to liquidate late short positions and induce panic from weak hands before the true upward move began, effectively clearing the path.
Phase D - Last Point of Support (Current Phase): The current consolidation around $0.143 is a textbook "Last Point of Support" (LPS). The market is coiling, building energy, and undergoing a final test of supply within the range. This phase is critical as it demonstrates the market's ability to absorb any remaining sell-side pressure before attempting to leave the accumulation zone.
A decisive breakout above the range high near $0.24 would confirm the completion of this multi-month accumulation and signal the start of a new major uptrend (Phase E).
Moving Average & Ichimoku Cloud Analysis: A Trend in Transition
Key trend-following indicators are beginning to reflect this potential shift from a post-listing downtrend to a new uptrend.
Moving Averages (4-Hour Chart): The price is currently battling to establish the 50-period moving average (MA) as support. The 200 MA still looms overhead as the primary long-term trend resistance. The most anticipated technical event in the coming weeks is a "Golden Cross" (50 MA crossing above the 200 MA). This would serve as a widely recognized technical confirmation that the asset is exiting its bottoming phase.
Ichimoku Cloud (4-Hour Chart): Price is currently interacting with the Kumo (Cloud). A definitive break and close above the cloud would be a powerful signal, flipping the cloud from resistance to a dynamic support zone and confirming a bullish trend change on this timeframe.
Price Projection Timeline
Q3 2025 (July - September):
The primary objective is to complete Phase D with a sustained move above the $0.154 (38.2% Fib) and $0.172 (50% Fib) resistance levels. This would constitute the "Sign of Strength" (SOS) that signals an imminent attempt to break out of the accumulation range.
Q4 2025 (October - December):
Following a successful Q3, the focus will shift to conquering the major resistance at $0.24. This level represents the top of the Wyckoff range and a key psychological area from the initial listing period. A breakout above this zone would confirm the accumulation thesis and likely trigger a rapid expansion towards the first major target of $0.28 - $0.32.
Key Levels to Monitor
Support Zones:
Primary: $0.121 (The "Spring" level; must hold to maintain immediate bullish structure).
Major: $0.096 (The Post-Airdrop Low; the definitive floor of this market cycle).
Resistance & Target Zones:
Immediate: $0.154 (Fibonacci and structural resistance).
Target 1: $0.172 - $0.190 (The "Golden Pocket" resistance cluster).
Target 2 / Major Resistance: $0.24 (Top of the accumulation range).
Blue Sky Target 1 (Post-Breakout): $0.28 - $0.32.
Conclusion: The Foundation is Set, Awaiting Ignition
The technical evidence strongly indicates that Starknet has successfully navigated the initial, chaotic phase of its public life and has spent months building a robust accumulation base. The price action is not random but a structured absorption of the initial supply overhang.
While the path to $1.00 is a long-term journey that depends heavily on fundamental execution and market-wide sentiment, the technical roadmap for the remainder of 2025 is clear. The immediate goal is to validate the Wyckoff accumulation pattern by breaking out of the current range and reclaiming the $0.24 level. Achieving this would signal that the market has fully digested the launch-day supply and is ready to price the asset based on its future potential, setting the stage for a true bull run.
STRKSUSD trade ideas
STRKThis was a little more sense now a good little is on a good note I a little more about the election results on a little more about the same time zone on a little bitty and a good time

Long Term Starknet, Newbie PerspectiveFor many alts its showing that September 2025 and March 2026 are crucial dates.
there are 6 important levels to watch:
TP1 = 0.8$
TP2 = 1.23$
TP3 = 1.89$
TP4 = 3$
TP5 = 4.5$
TP6 = 7.66$
We are going to have a wave to 1.89$, then fall to 1.23$ and then a last push that will go into beginning of 2026.
The final wave will end at one of those three levels:
TP4 = 3$
TP5 = 4.5$
TP6 = 7.66$
After that we are going to have a long bear market, that will bring us to a new ATL under 0.1$.
Sell beginning of 2026,
Buy in end of 2028
not financial advice, i am a noob, learning to chart from youtube videos

[STRK] STARKNET could increase between (+117%) to (+160%)STRK is holding above value area high from jun 2024 and if it could manage to close a weekly candle above $0.66 will indicate a possible move towards apr/may 2024 highs, it is above anchored vwap from jun 2024 and trying to flip an important region into support, moneyflow increasing and turning into bullish momentum in the higher timeframes. The target is between fibonacci retracement levels from apr 2024 high to aug 2024 lows, value area high/poc from apr to jun 2024 and daily level.
TARGET: $1.306 to $1.575 up to (+160%)

Starknet: The New ETH Layer 2 Poised for a BreakoutStarknet, a groundbreaking layer-2 scaling solution built on Ethereum, is revolutionizing the way we interact with decentralized applications. By leveraging cutting-edge ZK-STARK technology, Starknet offers unparalleled scalability, security, and privacy, making it a cornerstone for the future of Web3.
As the demand for faster, cheaper, and more secure blockchain transactions continues to soar, Starknet emerges as a dominant force. With its ability to process thousands of transactions per second, Starknet unlocks the potential for mass adoption of decentralized finance (DeFi), non-fungible tokens (NFTs), and other innovative applications.
TA:
The formation of a bullish breakout pattern suggests that STRK may be ready for a price surge. This potential breakout, coupled with Starknet's robust technology and growing ecosystem, positions STRK as a compelling investment opportunity for those seeking exposure to the future of blockchain technology and exposure to the growth of ETH layer 2 solutions

Testing Strong Base of SupportAfter a little breakout move above .45 we have since come back and tested prior years resistance level, and looks like we have confirmed some support here.
Looking long now to make new relative highs above .50 and eventualy towards that 1$ mark. Ideally we get consistent breakouts that pullback just enough to test prior highs and keep rolling forward through this market cycle. Consistent and strong is better then quick and reckless.

Starknet — Bullish BreakoutAnother great opportunity.
Trendline breakout and since Bitcoin has finished its correction, reversal is likely to follow here.
Target: $10 (2000%).

STRK/USDIn the main trend, there is a selective descending channel with a 40% step. The large player operates by accumulating, pushing, and so on until there is an exit from the channel. Afterward, the chart is highly likely to transition into a "saucer" pattern. The pattern will play out up to the previous highs. It’s better to start trading on the breakout or a pullback after the breakout of this descending channel.

STARKNET (STRK)starknet token is most active in the Russian Federation according to information from crunchbase.com HQ is the other title.

(STRK) starknetStarknet; most active users appear to be coming from Russian Federation (16%) and secondly from Vietnam (10%), Brazil (9%), Ukraine (9%).

Starknet In a Fallen Channel We are ready for a bounce back to upper channel and carry on falling downwards.
Trade Safe
Not Financial Advise

STRKUSD Bullish Study Case
On the daily timeframe, STRK was in a bearish trend. Then, it started forming the Wyckoff accumulation pattern, which included a bearish candle with a long wick, marked on the graph as SC for Selling Climax. Then, we had the AR for Automatic Reaction, followed by the ST for Secondary Test, UT for Upthrust, and another STB for Secondary Test in Phase B.
Currently, I'm waiting for the retest that aligns with an inverse head and shoulders pattern in the 4-hour timeframe. Additionally, it aligns with a Fibonnaci's zone of interest.

(STRK) starknet tokenStarknet token on Base chain. Is it a viable contender in the future for cryptocurrency? I do'nt see why not. Why would coinbase add this token to their ... does Coinbase add or do people build on Base whether Base likes it or not? There was a problem with Binance Chain now BNB chain in the past with too many bad programs using BNB chain for their ill willed intentions.
STRK-USD: StarkNet ready to excel?2024-03-11 Starknet STRK
Starknet is a coin that has been on major exchanges for only a few weeks.
Some analysts speak highly of it, as potential multiplier of our funds.
After some struggles getting a footing, it appears ready for a breakout for 2x gain.

$STRK upside $4-9?IDX:STRK looks like it has the potential to make a strong move here. It has a very similar look to SPARKS:AERO before it went up ~7x.
While I don't think it'll be as strong of a move, I do think there's good potential for upside.
Let's see what happens. Price needs to confirm resistance as support before it has the chance to move.
I've entered from $2.27.
