STX Bulls Beware: Is This the Calm Before a Massive Drop?Yello, Paradisers! Are you seeing what we’re seeing on STXUSDT? If not, now’s the time to pay attention—our recent predictions on bearish setups are starting to unfold again, and this one might catch many off guard. Let’s break it down.
💎Currently, STXUSDT is flashing some serious warning signs. We’re spotting a clear bearish Change of Character (CHoCH) in play, which is being reinforced by a Head and Shoulders pattern—a combination that significantly increases the probability of a downside move.
💎To make things worse for the bulls, there’s an unfilled Fair Value Gap (FVG) sitting just below the current price. This acts like a magnet and could drag the price downward as liquidity gets targeted.
💎However, if STXUSDT manages to bounce from current levels, we’ll be closely watching the Order Block (OB) and Fibonacci Golden Zone as potential entry points. These could offer an excellent risk-to-reward (RR) setup if the bearish scenario gets temporarily rejected.
💎But here’s the key invalidation point: if price breaks and closes above the OB zone, the entire bearish thesis falls apart. In that case, we’ll step aside and wait for stronger confirmation before jumping back in. No need to rush—better opportunities always come with clear setups.
🎖Trade smart, Paradisers. The market doesn't care about your bias—it rewards only patience, precision, and discipline. Stick to your trading plan, and don’t let FOMO or fear drive your decisions.
MyCryptoParadise
iFeel the success🌴
STXUSDT.P trade ideas

#STX/USDT#STX
The price is moving within a descending channel on the 1-hour frame, adhering well to it, and is heading for a strong breakout and retest.
We are experiencing a rebound from the lower boundary of the descending channel, which is support at 0.600.
We are experiencing a downtrend on the RSI indicator, which is about to break and retest, supporting the upward trend.
We are looking for stability above the 100 moving average.
Entry price: 0.670
First target: 0.691
Second target: 0.714
Third target: 0.739

STX Breaking | BTC | ETH | XRPSTX breaking local resistance and closed 4hr candle above it
if Price holding here would see a run to 4hr 200MA and then Next target around .830
will buy if its retrace to 15min 50ma


STXUSDT 1WSTX ~ 1W Analysis
#STX Buy gradually from here if you still have a Conviction on this coin with a short -term target of at least 20%+.

Time to buy? STXUSDT
You can see the support line is broken down last week. Now, it's trading around 0.62x, do you think can buy this time, this price?
I think not yet. I expect BINANCE:STXUSDT hit the first all time high zone 0.4-0.5
So wait and see

[LONG] STX - STACKS on support and ready for a bounceSTX is another beaten up coin that this year alone lost more than 60% of it's already beaten up marketcap. From the peak on April of 2024 to January of this year STX was already down 50%. Bulls got completely obliterated, but not everything is lost for STACKS: Sitting at $0.75 is now testing (and holding) for second time the previous 2023 resistance, now turned support. A bounce here doesn't immediately mean the end of the fall, but we can catch a good counter-trend move to retest the distribution zone on the $1.44 to $2.00 range
1st Entry: $0.75 (previous resistance, now support)
2nd Entry: $0.65 (most traded zone)
move SL to Break even if price breaks the previous high at $1.00
1st TP: $1.34
2nd TP: around $1.80 or look for signs of weakness in lower timeframes at this area

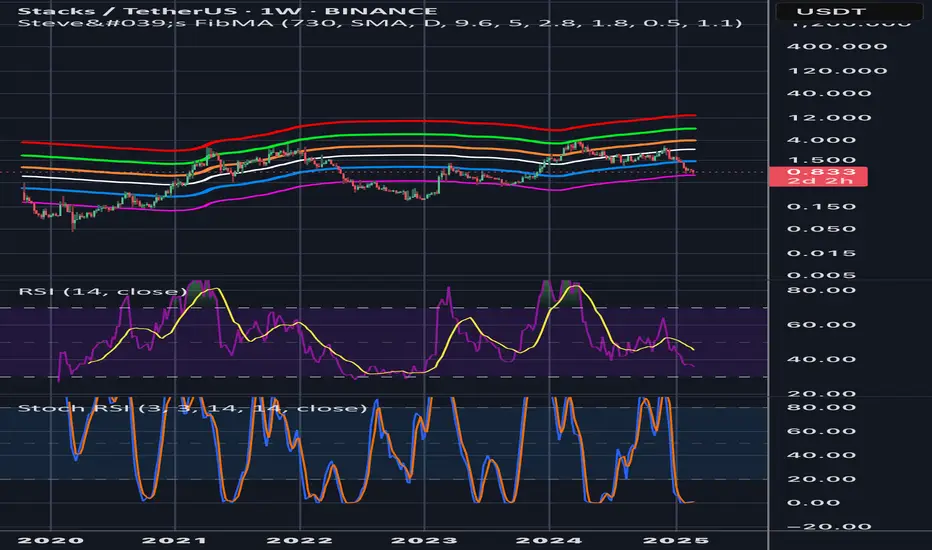
Bullish on STX: Massive Support Just Hit – $15 Is Actually PossiStacks (STX) is flashing strong bullish signals, and the charts are aligning for a major move to the upside. Here’s why $15 isn’t just a dream—it’s a real possibility.
1. Strong Support at Key Levels
STX has just bounced off a critical support zone, aligning with the pink and blue moving averages, which have historically acted as reversal points. This suggests a potential bottom formation and a springboard for the next leg up.
2. Fibonacci Bands Indicate a Huge Upside
The price is sitting below the white mid-band, a level that has consistently preceded major breakouts. With the next Fibonacci resistance around $3-$4, once that is cleared, momentum could push STX toward its previous highs and beyond.
3. RSI & Stochastic RSI Reset for a Surge
• RSI (Relative Strength Index) has cooled off to neutral territory, meaning there’s room for upward movement.
• Stochastic RSI is approaching oversold levels, a classic signal that price is ready to rebound hard.
4. Historical Price Action Suggests a Parabolic Move
Looking at past cycles, STX has surged 10x+ after bouncing from these levels. If this pattern holds, a move toward $10-$15 is entirely feasible in the next few months.
Final Thoughts
STX has all the ingredients for a massive rally: strong technical support, bullish momentum indicators, and historical price action that favors explosive moves. If Bitcoin and the overall market remain strong, we could see STX skyrocket toward double-digit territory sooner than expected!
Key Levels to Watch:
• Support: $0.80 - $1.00
• Breakout Zone: $3 - $4
• Ultimate Target: $15 🚀
Do you think STX can hit $15? Let me know in the comments!
STXUSDT UPDATESTXUSDT is a cryptocurrency trading at $0.900. Its target price is $1.600, indicating a potential 90%+ gain. The pattern is a Bullish Falling Wedge, a reversal pattern signaling a trend change. This pattern suggests the downward trend may be ending. A breakout from the wedge could lead to a strong upward move. The Bullish Falling Wedge is a positive signal, indicating a potential price surge. Investors are optimistic about STXUSDT's future performance. The current price may be a buying opportunity. Reaching the target price would result in significant returns. STXUSDT is poised for a potential breakout and substantial gains.

Will STXUSDT recover from a failed fifth Elliott wave?
We start our Elliott wave count at the bear market lows (Nov 2022). The first wave tops in March 2023 starting the second wave that bottoms at the 0.618 Fib (typical second wave). The third wave tops along with most of the crypto market in end of March or early April 2024. Then the fourth wave corrects more than expected barely holding the 0.382 Fib, the first wave high and the pitchfork median line support. The fifth wave starts in August 2024 and tops in December 2024, below the third wave high and rejecting from a pitchfork resistance. From here STX tumbled down.
STX recently found support at the outer line of a macro modified Schiff pitchfork. We can see that the price action interacted with the median line of this pitchfork throughout the bull run. If we are to hit that median line again, we get a pretty ambitious target at around 5$ by the end of July 2025.
Below I examine other pitchforks for more realistic price targets.
Looking at the same pitchfork on linear scale we again see price action interacting with median, 0.5 and outer lines of the pitchfork. This chart gives us a target price of around 1.9 by the end of July 2025.
Changing the pitchfork type to Schiff and looking at the log chart again shows price action interacting with median and 0.5 lines of the pitchfork. This chart gives us a target price of around 2.44 by the end of July 2025.
Some smaller pitchforks on the log chart provide us with additional resistance levels to keep in mind.
Similarly on the linear chart. Here we also see a pitchfork median line that served as support.
In recent price action we can see bullish divergence in RSI and SRSI. In addition, at the daily close, one should watch for bullish crosses in RSI and SRSI.
Will this be the turning point for STX? Time will tell.

Univers Of Signals | STXUSDT Reached Weekly SupportLet's go together to analyze and review one of the popular cryptocurrency coins and Bitcoin's second layer and update our triggers
🌐 Overview Bitcoin
Before starting the analysis, I want to remind you again that we moved the Bitcoin analysis section from the analysis section to a separate analysis at your request, so that we can discuss the status of Bitcoin in more detail every day and analyze its charts and dominances together.
This is the general analysis of Bitcoin dominance, which we promised you in the analysis to analyze separately and analyze it for you in longer time frames.
📊 Weekly Timeframe
On the weekly time frame, stx is one of the coins that started its upward trend before the start of 2024, which caused the formation of its ATH and new ceiling
You can also see one of the best weekly trends in this coin, which is that after each time we hit this support trend line, we rose and made a sharper move.
Also, when this trend line was broken, we made a pullback to it and as we had given the weekly exit trigger with a break of 1.299 in the previous analysis, after the break of the trigger of the trend line, we experienced a sharp decline and reached the support level of 0.796 and now we need to form a structure.
📈 Daily Timeframe
On the daily time frame, but after the rejection of the important weekly resistance 2.745 and getting rejected, we started to correct the price and fall until this price correction turned into a trend change in the daily time frame
After forming the lower ceilings and floors, we reached important support and the trigger for the spot exit, which after the daily failure and pullback to that daily candle, engulfed the previous 3 candles and caused further decline, which led to us reaching the important support of 0.859
Currently, after hitting the support of 0.859 twice, our fall volume has not increased much and it can be said that the sellers do not intend to take the price below 0.859 for the time being, and this will cause us to go into the range and form a new structure. However, I will open a short with a failure of 0.859, but there is no buying at the moment.
⏱ 4-Hour Timeframe
We suffered enough in the four-hour time frame and formed a structure and we are in a range box that we can take a position from both sides
📉 Short Position Trigger
For my short position I open a position with a break of 0.859 and accept the stop loss. Since it is an important support, I try to place my stop loss in a logical space and not make it small.
📈 Long Position Trigger
For the long position, we have two triggers, one risky and one somewhat certain. You can open a position with a break of 0.953 and 1.005, respectively. The difference is that with a break of 0.953, the possibility of a stop loss is higher, and with a break of 1.005, the possibility of losing the position is higher. I choose to take the stop loss myself.
📝 Final Thoughts
Stay calm, trade wisely, and let's capture the market's best opportunities!
This analysis reflects our opinions and is not financial advice.
Share your thoughts in the comments, and don’t forget to share this analysis with your friends!

TradeCityPro | STXUSDT Reached Weekly Support👋 Welcome to TradeCityPro Channel!
Let's go together to analyze and review one of the popular cryptocurrency coins and Bitcoin's second layer and update our triggers
🌐 Overview Bitcoin
Before starting the analysis, I want to remind you again that we moved the Bitcoin analysis section from the analysis section to a separate analysis at your request, so that we can discuss the status of Bitcoin in more detail every day and analyze its charts and dominances together.
This is the general analysis of Bitcoin dominance, which we promised you in the analysis to analyze separately and analyze it for you in longer time frames.
📊 Weekly Timeframe
On the weekly time frame, stx is one of the coins that started its upward trend before the start of 2024, which caused the formation of its ATH and new ceiling
You can also see one of the best weekly trends in this coin, which is that after each time we hit this support trend line, we rose and made a sharper move.
Also, when this trend line was broken, we made a pullback to it and as we had given the weekly exit trigger with a break of 1.299 in the previous analysis, after the break of the trigger of the trend line, we experienced a sharp decline and reached the support level of 0.796 and now we need to form a structure.
📈 Daily Timeframe
On the daily time frame, but after the rejection of the important weekly resistance 2.745 and getting rejected, we started to correct the price and fall until this price correction turned into a trend change in the daily time frame
After forming the lower ceilings and floors, we reached important support and the trigger for the spot exit, which after the daily failure and pullback to that daily candle, engulfed the previous 3 candles and caused further decline, which led to us reaching the important support of 0.859
Currently, after hitting the support of 0.859 twice, our fall volume has not increased much and it can be said that the sellers do not intend to take the price below 0.859 for the time being, and this will cause us to go into the range and form a new structure. However, I will open a short with a failure of 0.859, but there is no buying at the moment.
⏱ 4-Hour Timeframe
We suffered enough in the four-hour time frame and formed a structure and we are in a range box that we can take a position from both sides
📉 Short Position Trigger
For my short position I open a position with a break of 0.859 and accept the stop loss. Since it is an important support, I try to place my stop loss in a logical space and not make it small.
📈 Long Position Trigger
For the long position, we have two triggers, one risky and one somewhat certain. You can open a position with a break of 0.953 and 1.005, respectively. The difference is that with a break of 0.953, the possibility of a stop loss is higher, and with a break of 1.005, the possibility of losing the position is higher. I choose to take the stop loss myself.
📝 Final Thoughts
Stay calm, trade wisely, and let's capture the market's best opportunities!
This analysis reflects our opinions and is not financial advice.
Share your thoughts in the comments, and don’t forget to share this analysis with your friends!

STX Buy level | BTC | ETH | XRPI'm investing a portion of my portfolio to STX
resting on uptrend line
not using stoploss.

Bitcoin's Leading L2Crazy to see STX took a hit this hard, maybe because it's just another EVM.....but is it? This may just be BTC's quantum computing shield in the future. This large discount brings you great opportunity. May take up to two years for 450% gains. I have started accumulating.

STXUSDT on the Edge: Massive Rally or Sharp Drop Incoming? Yello! Are you prepared for what’s about to unfold with #STXUSDT? The price action is heating up, and the next move could be explosive. #STX is flashing signs of a critical Elliott Wave structure, and what happens next will determine whether we’re headed for a massive rally or a sharp correction. Let’s dive into the details.
💎#STXUSDT has just completed a corrective Wave 4 within the Elliott Wave structure. Right now, we’re expecting an impulsive 5th wave to kick in, supported by key indicators. Both RSI and MACD are showing bullish divergence, suggesting that the corrective ABC wave may be complete, setting the stage for a potential bullish breakout.
💎However, the critical support level at $0.915 will be key. If this level holds, we expect bullish momentum to continue, confirming the start of Wave 5. But if $0.915 fails, we’ll be watching for a bullish rebound from the imbalance zone. A break below this area could invalidate the bullish wave count and open the door for further downside.
The next move will separate the pros from the amateurs. Stay sharp, stay strategic, and as always trade smart, Paradisers. 💪
MyCryptoParadise
iFeel the success🌴


STXUSDT BINANCE:STXUSDT
Potential reversal from here. Volume features not favouriing the SHORTing too much. Short term upmove could be forseen
On the monthly time frame


STX at Key Support: Perfect Spot for Accumulation!STX is currently trading within the blue support zone at $1.279–$1.364, an ideal range for accumulating spot positions. This higher timeframe support has historically held the price multiple times. Waiting for a clear reversal confirmation before entering is recommended.
The green resistance zone at $1.873–$1.954 is a critical level to watch. A breakout above this zone, accompanied by strong volume and momentum, could pave the way for further price movement. Potential targets include the pink resistance zone at $2.396–$2.467 and the yellow resistance zone at $3.018–$3.111.

TradeCityPro | STXUSDT Sellers Final Attempt👋 Welcome to TradeCityPro Channel!
Let’s analyze one of my favorite coins, STX, which serves as Bitcoin's layer 2 and is currently in a better condition compared to other altcoins.
🌐 Overview Bitcoin
As always, before analyzing STX, we’ll take a quick look at Bitcoin on the 1-hour timeframe. Bitcoin bounced off the 102873 support, with its recent fluctuations caused by the Trump-related events and their accompanying market noise.
Bitcoin dominance continues to climb, and it’s likely we’ll see a new high along with bullish movement in Bitcoin dominance. It’s a good idea to either open long positions on Bitcoin or hold your existing long positions. Altcoins paired with Bitcoin that are showing bullish signs might also see upward movement.
📊 Weekly Timeframe
On the weekly timeframe, STX stands out as one of the most bullish coins in the market, alongside Solana, Doge, and Sui. This highlights the strong current position of this project.
The key resistance level is at 2.708, while the 3.696 ATH can be considered a fake breakout. For trading, it’s better to base your entries and positions on the 2.708 resistance.
The coin has been moving along an important supportive trendline that had multiple successful retests. However, this trendline has been broken, a pullback occurred, and the trendline trigger activated with the breakout at 1.299, which currently serves as a critical support.
This level is both a major weekly support and the 0.382 Fibonacci level. If broken, the price could drop further to 0.738.
For new entries, either wait for the 1.765 level in lower timeframes or the primary trigger at 2.708. Exiting below 1.299 in profit might be a smart move. If the price reclaims this box, you can re-enter. Although this strategy reduces the number of coins, it ensures no USD losses.
📈 Daily Timeframe
On the daily timeframe, the price is at the 1.355 significant support level, with lower highs and relatively flat lows forming a compression pattern and a trendline.
I won’t exit my spot holdings below 1.355, but I may take the risk of opening a short position after breaking this trigger. Part of the profits from this short position can be used to accumulate more STX coins for long-term holding.
For re-entry on the daily timeframe, momentum or a trend reversal is necessary. This could happen with a fake breakout of 1.355, which is a critical support level.
Buyers will likely make an effort to defend it. Alternatively, you can wait for the trendline breakout and the 1.674 level to open your spot positions with a risky stop-loss below 1.355. A breakout above RSI 50 can also serve as confirmation.
⏱ 4-Hour Timeframe
On the 4-hour timeframe, the chart shows consolidation near the 1.355 critical support, oscillating within the 1.355 to 1.674 box, with sellers slightly stronger.
📉 Short Position Trigger
The short position trigger is clear. After breaking 1.355, I’ll open a short position. If the price moves closer to this level, I might also place a stop-sell order if bearish volume increases.
📈 Long Position Trigger
Long positions are trickier with this chart. For such positions, I’d either check other charts or wait for a higher high and low or a fake breakout of 1.355 before considering opening a long position.
www.tradingview.com
📝 Final Thoughts
Stay calm, trade wisely, and let's capture the market's best opportunities!
This analysis reflects our opinions and is not financial advice.
Share your thoughts in the comments, and don’t forget to share this analysis with your friends!

STX 1$ Resistence ZoneBINANCE:STXUSDT
✅Before we start to discuss, I would be glad if you share your opinion on this post's comment section and hit the like button if you enjoyed it. Thank you.
Possible Targets
➡️globally we came in to -0.27 Zone (usually play like accumulation zone for investors)
➡️Main support area in case if BTC drop again to test 19-17K STX should hold 0.30 cent
➡️ We going out of global downtrend line since November 2021
➡️ Next resistance zones where we can going down again marked on chart
➡️ Main resistance zone and psychological level is 1$ where I think we will find huge sales and come back to test main support zone in September-October again.
Hope you enjoyed the content I created, You can support with your likes and comments this idea so more people can watch!
✅Disclaimer: Please be aware of the risks involved in trading. This idea was made for educational purposes only not for financial Investment Purposes.
* Look at my ideas about interesting altcoins in the related section down below ↓
* For more ideas please hit "Like" and "Follow"!

STX/USDT Trade IdeasSTX moving towards weekly demand !!
It was respected before also so it is a high probability trade !!

