✴️ Stacks To Hit New All-Time High?If Stacks goes to a new All-Time High it is likely that the other Altcoins will do the same.
Why do I mention this?
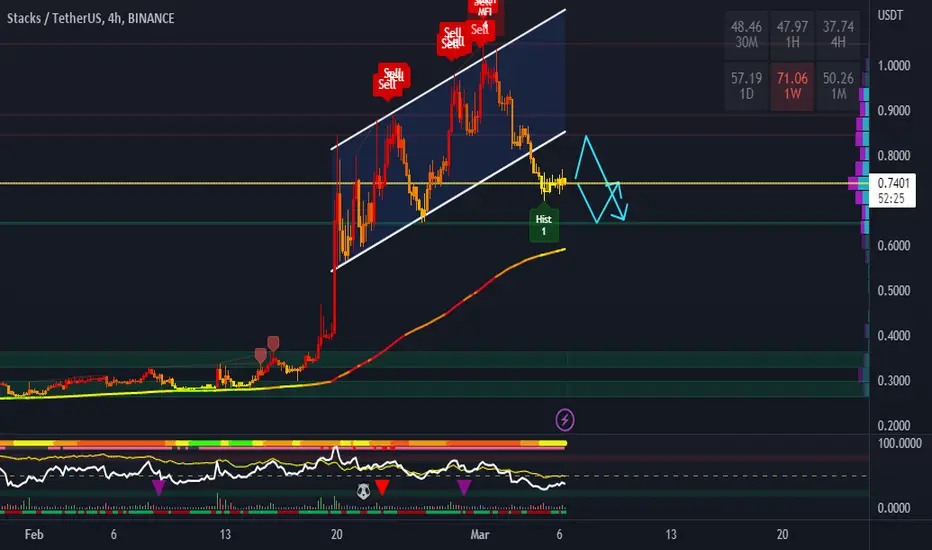
Because of the volume... Look at the incredibly high volume.
Is all this buying just to sell in a few days?
Or likely whales loading up knowing something we don't know?
We do know the market is set to grow, we just don't know by how much.
Still, this is really high volume.
Be prepare for anything and everything.
Just as thing can get really bad out of nowhere, by surprise, things can also get really good out of nowhere, by surprise.
Just think Covid, we were all really happy an then the pandemic hit.
Now, something else might show up...
Yes the banks are burning but out of the ashes something good might be borne.
Namaste.
STXUSDT.P trade ideas
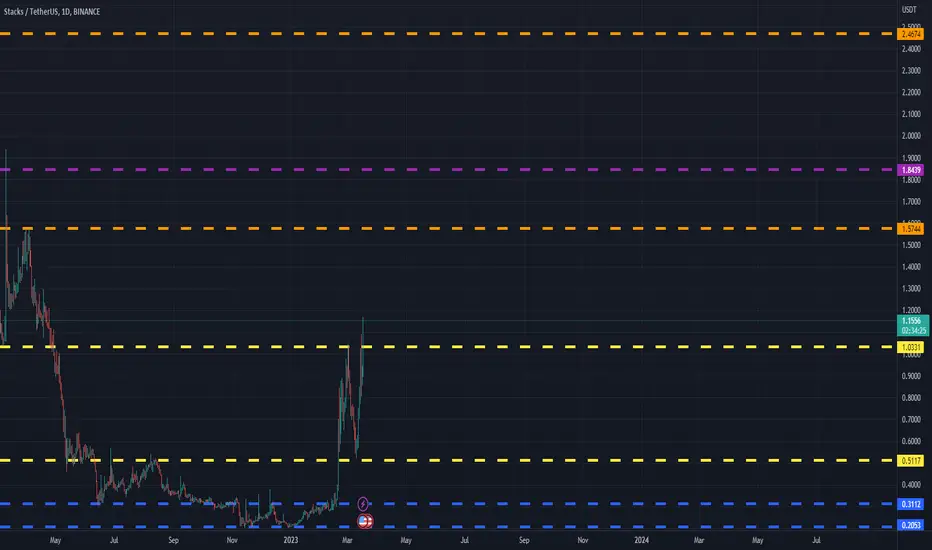
STX: Resistance BreakoutTrade setup : Price bounced off of $0.60 support and broke above $1.05 resistance where it got rejected in February. That indicates that buyers are still in control and price resumed its Uptrend. Next major resistance is around $1.75 and then $2.75.
Trend : Uptrend across all time horizons (Short- Medium- and Long-Term).
Momentum is Bullish ( MACD Line is above MACD Signal Line and RSI is above 55).
Support and Resistance : Nearest Support Zone is $0.60, then $0.40. The nearest Resistance Zone is $1.05, which it broke.

STX ShortRSI divergence, in chart higher high but RSI is going down which is bearish, STX can be dump 0.7 if BTC is down, not a financial advice, trade by your own analysis

STXUSDT(Stacks) Daily tf Range Updated till 18-03-23STXUSDT(Stacks) Daily timeframe range. it got some good volume now trying for a clean break above #1.0331. its 3rd attempt here, a close above open a space till #1.5744 but need to keep at this buying power or back to lower levels.
STXIdea: The price forms a strong bearish divergence on several oscillators - a signal for the weakness of sellers. Get ready for a strong correction. The price will be able to continue to grow if it fixes above the weekly 100 MA

STX USDTSTX USDT sell/short idea
confluence of AST + potential bearish harmonic crab
entry zone on BRD
details on chart.

STX POTENTIAL 15% SHORTprice rising on low volume
money flow is decreasing while price decreases
idk what else to think but for it to retest Weekly High

STX SHORT - TEXTBOOK PLAY will this textbook bear flag play out for stx - low risk - high reward if everything dumps

STACKS & BITCOIN 💎If you have been following crypto market in the last 3 weeks, you will certainly notice the crazy $STX performance, there were red days in crypto market meanwhile $STX was doing daily +10%
We have seen how solid Bitcoin was during USDC depeg and during the collapse of $SIVB and Silvergate bank! SPX down while $BTC doing +20% in few days.
In a nutshell, only few crypto projects will survive and more chance for those who co-exist with Bitcoin dominance, here comes Stacks.
Stacks is a Bitcoin Layer for smart contracts; it enables smart contracts and decentralized applications to use Bitcoin as an asset and settle transactions on the Bitcoin blockchain.
Looking for 3X on this one, holding above $0.5555 is my only buy-condition as this investment is for the long term.
Make sure you follow me for price update alerts!

STX: Approaching ResistanceTrade setup : Price bounced off of $0.60 support and is again trying to break above $1.05 resistance where it got rejected in February. Wait for price to either 1) break and close above $1.05 to resume uptrend, or 2) pull back near $0.60 support for another swing entry. Fibonacci retracement levels (potential support) are $0.73 (38.2%) and $0.63 (50%).
Trend : Uptrend across all time horizons (Short- Medium- and Long-Term).
Momentum is Bullish ( MACD Line is above MACD Signal Line and RSI is above 55).
Support and Resistance : Nearest Support Zone is $0.60, then $0.40. The nearest Resistance Zone is $1.05, which it broke.

stx short ideastx short target is in above risk to reward
stx money flow over bought and rsi also over bought .
on daily bearish divergence

STX have strong level for crackThe coin has formed an aggressive preload on increased volumes to local price highs, beyond which I expect to see the stops of participants who opened short positions. Due to the abrupt approach, I expect a slight correction and only after it the continuation of the upward movement.


STX - FILLING THE GAPbased on the RSI and volume, we should be filling the gap before a potential new high
have a tight SL but at some point FVG will be filled

STX: Pullback in UptrendTrade setup : After sizeable gains (~400% YTD 2023), price was met with selling pressure around $1.05 resistance area. Pullback near $0.60 support could be a swing entry. Momentum (MACD Histogram) has also inflected bullish again. Fibonacci retracement levels (potential support) are $0.73 (38.2%) and $0.63 (50%).
Trend : Neutral on Short-Term basis and Uptrend on Medium- and Long-Term basis.
Momentum is Mixed as MACD Line is below MACD Signal Line (Bearish) but RSI ~ 50 (Neutral).
Support and Resistance : Nearest Support Zone is $0.60, then $0.40. The nearest Resistance Zone is $1.05.

STXUSDT || Price return to trendOn the daily timeframe , the price trended back to 38% + EMA .
Stochastic in oversold
On 4h the price breaks the trend line with many touches.
Price above major EMAs
Stochastic is high.

stx bllishstx going to 1 again after big market crash
china ai stx
lets hit the 1$ again
chart looks bullsih
15m chart closing above vwap

STX POTENTIAL ENTRY & DEMAND ZONEif you're not in the short, price might retrace to the golden pocket for a new short entry
if we break 0.6275 there's not much support until the bottom demand zone

Utilizing Angles W/ GeometryNote:
The angle spanning from .7242 Mon 06 Marc '23 21:30 and .7547 Tue 07 Mar '23 3:00
- It is about 19 on this scaling
The next angle below it is 1/2 of that; 19/2 = 9.5
These intersect the price at .7547 and create time objectives; these time objectives were used concurrently with price to note times of major change.

STX - Corrective wave endedWe can see how we clearly have 5 waves (Yellow line) with 3 impulsive moves.
We can observe how each impulsive move is followed by another 5 clear waves with its respective higher highs (Blue Aqua line).
Those are then followed by 5 corrective waves also (Qhite line).
Adding 2 Fib retracement patters we get a range of what, in my opinion, could be the bottom for the current corrective wave we are experiencing right now.
We the get a price range between the short term move fib (38.20%) and the long term fib (23.60%).
What could be next?
This should come followed by a new 5 small waves and possibly form another 5 corrective waves, creating a new accumulation schematic.
Like and follow
Raf

$STX/USDT 2h (#Bybit) Rising wedge breakdown and retestStacks seems locally topped here and a retracement down to 100EMA would make sense.
⚡️⚡️ #STX/USDT ⚡️⚡️
Exchanges: ByBit USDT
Signal Type: Regular (Short)
Leverage: Isolated (3.0X)
Amount: 5.0%
Current Price:
0.94020
Entry Targets:
1) 0.95080
Take-Profit Targets:
1) 0.76145
Stop Targets:
1) 1.07745
Published By: @Zblaba
$STX #STXUSDT #Stacks #PoX
Risk/Reward= 1:1.5
Expected Profit= +59.7%
Possible Loss= -40.0%
www.stacks.co

Stacks STX price predictionThis is what I see, I drew the big wave, I skipped small waves
thxxxxxxxxxxxxxxxxxxx

STXIdea: the price has broken through the lower border of the rising channel. It is possible to retest the lower border of the channel and continue the fall. The $0.65 level is the nearest strong support, coinciding with the weekly 100 EMA