Stacks · Major Flush Reveals End of Correction · New CycleStacks all-time high was hit April 2024. This ATH comes as a long-term double-top because it happened within the same November 2021 peak price range.
After a major wave there is always a correction. A correction can happen in any direction. If the trend is bearish, the correction is an up-move. If the trend is bullish, the correction is a down-move. Very simple.
The 2021 all-time high is the natural end of a major bullish cycle and thus a correction follows. The correction lasted from November 2021 until November 2022. Naturally, a major market bottom signals the start of a change of trend.
Here STXUSDT produced a bullish cycle from November 2022 until April 2024, 504 days. In April 2024 we have a new major high and this signals the start of a bearish wave. The bearish wave went from April 2024 through April 2025. The end of the down-move would signal the start of a new bullish cycle but, how do we know the down-move is over? Answer: A major market flush.
On the 12-May week there was a major market flush with a session reaching lower than the 7-April low. This is the bottom signal. It reveals itself as a bottom signal because instead of a new lower low close the week recovered and closed very high. After a higher low in June compared to April we now have four green weeks and we know what the rest of the market is doing so we can predict easily a bullish continuation; a price increase.
The size of the drop between April 2024 and May 2025 reached -92.49%. That's a huge drop. Almost all the gains from the previous 504 days bullish cycle was erased. The market has no reason nor need to move lower, for what? There is no need to dig for anything down there and that's the signal that reveals the bottom is in. Because the correction was so strong, we can expect a change of trend. We are aiming up.
Stacks major market flus in May 2025 reveals the correction is over. With the end of a strong bearish cycle confirmed, we can now expect a strong bullish cycle to develop next. If we go by past history, we can see sustained growth, it can happen for years or in the least many months.
How long will the bullish cycle last?
I don't know.
From March 2020 to November 2021 we have 630 days. The other cycle I just mentioned lasted 504 days. We can use these numbers to make some predictions but it is hard to say because market conditions are not the same.
504 days from May's low into the future gives us a date of September 2026. 630 days puts us at February 2027.
If we go by the law of alternation, we had a long cycle in 2020/2021 so this time we get a short one, say 38% or half the past bull market, this would give us 239 and 315 days. These two will give us dates between January and March 2026 for a new all-time high or cycle top.
Now, I cannot predict how long the bull market will last but I can predict that prices are going up. Since we know we will have a major rise lasting at least 6 months, the next logical step is to buy and hold. When Stacks starts trading 1,000% up, you won't care how the long bull market will last, you will just be very happy and grateful with the results.
The easy target is $6.19, but if we get an extended bull market we can go to $9.83 or even $13, or higher. It all depends on how it all develops, but we are going up. We are talking profits between 600% and 1,400% coming from current prices.
Thanks a lot for your continued support.
Namaste.
STXUSDT trade ideas

STX/USDT - 30-Minute Chart: Bearish Divergence Short SetupAnalysis & Rationale:
A high-probability short opportunity is forming on the STX/USDT 30-minute chart, primarily driven by a clear Bearish Divergence signal. While the price has registered a Higher High (HH), the Relative Strength Index (RSI) has failed to confirm this momentum, printing a Lower High (LH). This divergence indicates weakening buying pressure and a potential trend reversal or significant correction.
The price is currently reacting to a key supply/resistance zone (red box), which coincides with the RSI exiting the overbought territory. This confluence of signals strengthens the case for a bearish move.
Trade Setup:
Asset: STX/USDT
Timeframe: 30 Minutes
Direction: Short / Sell
Signal: Bearish Divergence
Execution Plan:
Entry Zone: Enter the short position near the current levels, within the supply zone (approximately $0.785 - $0.801).
Stop Loss: Place the Stop Loss just above the recent swing high to protect against a setup invalidation (e.g., at $0.805 or slightly above).
Take Profit Targets: Targets are based on the Fibonacci Retracement levels drawn from the previous swing low to the current high.
TP1: $0.769 (38.2% Fib. level)
TP2: $0.759 (50.0% Fib. level)
TP3: $0.749 (61.8% Fib. level)
Disclaimer: This analysis is for educational purposes only and does not constitute financial advice. Trading involves significant risk. Always conduct your own research and manage your risk appropriately.

$STX Stacks Bullish Continuation? 70% retracement from ATHNASDAQ:STX (Stacks) – Bigger Picture: Uptrend/Bullish Continuation
3-Day Timeframe
Current Price: $1.00
NASDAQ:STX has retraced over 70% from its all-time high of $3.80, indicating a deep correction phase that may now be reaching exhaustion.
If the price breaks out of this falling channel, which is often a bullish reversal signal. This breakout, if sustained, could set the stage for a move toward previous all-time highs and beyond.
🚀 Bullish Targets (TP):
$2.60 – Previous resistance level
$3.70 – Near the all-time high
$5.20 – Extended target on strong momentum
Invalidation Level:
The bullish thesis is invalidated if price falls below $0.80, signaling potential continuation of the downtrend.
#STX #Stacks #Crypto #Altcoins #Breakout #BullishSetup #CryptoTrading
@Stacks

Technical Analysis of an STX/USDT Short Trade Setup in a DescendPlease provide a detailed technical analysis of the short trade setup illustrated in the attached image for STX/USDT on the 30-minute chart.
Your analysis should break down the following key components of the setup:
Market Structure and Pattern: Describe the dominant chart pattern, which is a descending channel. Explain how the price action confirms this pattern.
Entry Strategy: Explain the logic behind the entry point. Specifically, discuss how it creates a "confluence of resistance" by aligning the channel's upper trendline with the Fibonacci retracement levels (drawn from the 0.740 high to the 0.714 low).
Risk Management (Stop Loss): Analyze the placement of the stop loss, indicated by the red box above the 0.740 swing high. Explain why this level serves as a logical invalidation point for the bearish trade idea.
Profit Target (Take Profit): Detail the rationale for the take-profit target, indicated by the green box. Explain how it aligns with the Fibonacci extension levels (specifically the 1.618 level at 0.697) as a potential target for the next bearish impulse wave.
Overall Assessment: Provide a summary of the trade's logic, evaluating its strengths, such as trading with the short-term trend and having a favorable risk/reward ratio.

STX/USDT Weekly Outlook Golden Accumulation Zone
📌 Overview:
STX (Stacks) is currently retesting a crucial demand zone in the $0.63 – $0.72 range — the same area that previously served as the launchpad for a massive rally toward the $3.80 highs. This chart highlights a strategic opportunity for swing traders and long-term investors who understand market cycles.
🧠 Price Structure Insight:
A well-established demand zone (highlighted in yellow) has acted as a base of accumulation since late 2022 through mid-2023.
Price is now consolidating above this zone, suggesting a potential bullish reversal.
A potential Double Bottom pattern is forming, with a neckline around the $1.00 level — a breakout above this could spark a significant bullish impulse.
🟢 Bullish Scenario (Upside Potential):
If STX maintains support and bounces from this accumulation zone, we could see a stair-step rally toward the following targets:
1. $0.90 – $1.00 → Psychological resistance & neckline of reversal pattern
2. $1.2975 → Historical supply and consolidation area
3. $1.9447 → Previous lower-high resistance zone
4. $2.20 – $2.71 → Key Fibonacci retracement levels from prior highs
5. $3.66 – $3.84 → All-Time High resistance, long-term bull target
🔍 A confirmed weekly close above $1.00 would significantly strengthen the bullish thesis and validate the reversal structure.
🔴 Bearish Scenario (Downside Risk):
If price breaks down below $0.6380, this could invalidate the current structure and lead to deeper corrections, targeting:
$0.45 → Minor support from early 2023
$0.20 → Historical macro bottom and extreme support
❗ A breakdown below this accumulation zone could trigger a longer-term bearish continuation.
🔄 Strategic Trading Notes:
This is a high-probability reversal zone, ideal for gradual accumulation (DCA) or swing entries with tight stop losses below support.
Watch for a spike in volume as a signal for institutional or smart money involvement.
Confirmation from bullish candlesticks (e.g., bullish engulfing on weekly) could provide additional entry confidence.
📚 Conclusion:
STX is testing a key structural level that previously led to exponential price growth. As long as the $0.63–$0.72 zone holds, the mid-to-long-term bias remains bullish. However, traders should remain disciplined and responsive to any invalidation signals.
#STXUSDT #Stacks #CryptoAnalysis #AltcoinSetup #TechnicalBreakout #WeeklyChart #BullishReversal #AccumulationZone #SmartMoney

Stacks Short- Mid- & Long-Term Bullish Signals (PP: 900%+)Stacks is a very interesting project and I believe it has many fans. Here the signals are really good and by good I mean strong.
This pair, STXUSDT, has been a top performer but the action bearish since March 2024.
Between March 2024 and April 2025 we have a classic ABC correction, a long-term one. Needless to say, this type of correction is always followed by an impulse, a bullish impulse and this is a sequence of 1,2,3,4,5 waves. Three waves up and two waves down in-between.
The August 2023 low produces a rounded bottom and then a new wave of growth. This low is preceded by another bullish wave. This pair has been growing long-term.
Then a new rounded bottom shows up but this one a long-term higher low compared to August 2023. That is April and June 2025. So mixed bullish signal. Short-term, mid-term and long-term all being combined to give us a bullish mix. Ultra-bullish in short.
The last all-time high happened around $3.84, so the next one can happen around $7.11 or $9.65. The $7.11 projection gives more than 900% profits potential.
Oh, and this week is young and already full green. The candle's real body trades above the two previous weeks open and close.
Thank you for reading.
Your support is appreciated.
Namaste.

STXUSDT 1W Analysis STX ~ 1W Analysis
#STX Buy back gradually from here with a short-term target of at least 20%++.

STXUSDT LONGPrice has broken out of a consolidation range and retested previous structure support at 0.6299. Bullish momentum followed with a clean engulfing candle on the 1H timeframe, confirming potential continuation.
Entry: $0.6299 (demand zone retest)
Stop Loss: $0.6186 (below demand)
Target: $0.6900 zone (key resistance, can be extended depending on the market conditions)

Potential 40x, if...if it reaches to my accumulation level, I believe STX has a 40x potential.
from $0.225 all the way to $9.25
The risk is yours to take.
Do not invest more than you can afford to lose.

SPOT STX LONG 12.06.2025Pinning after abnormal activity.
💰I enter at the market price.
I'll let you know when I record it manually.
‼️Risk per trade: 2% of the allocated funds for spot trading.
Thank you!

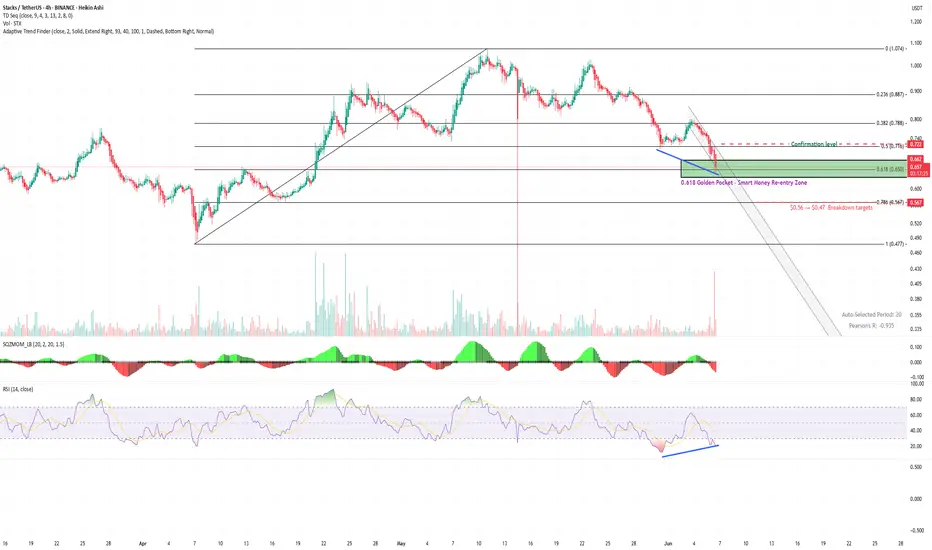
$STX / USDT (4H) – Golden pocket re-entryCOINBASE:STXUSD is testing the 0.618 Fib retracement ($0.65)
A zone where smart money often re-enters after corrections.
Confluence:
🔹 TD9 buy
🔹 RSI divergence
🔹 Fading momentum
🔹 Volume pickup near support = early demand?
Reclaim $0.72 could trigger a relief rally to $0.78–$0.80
Break $0.65 opens $0.56 and $0.47.
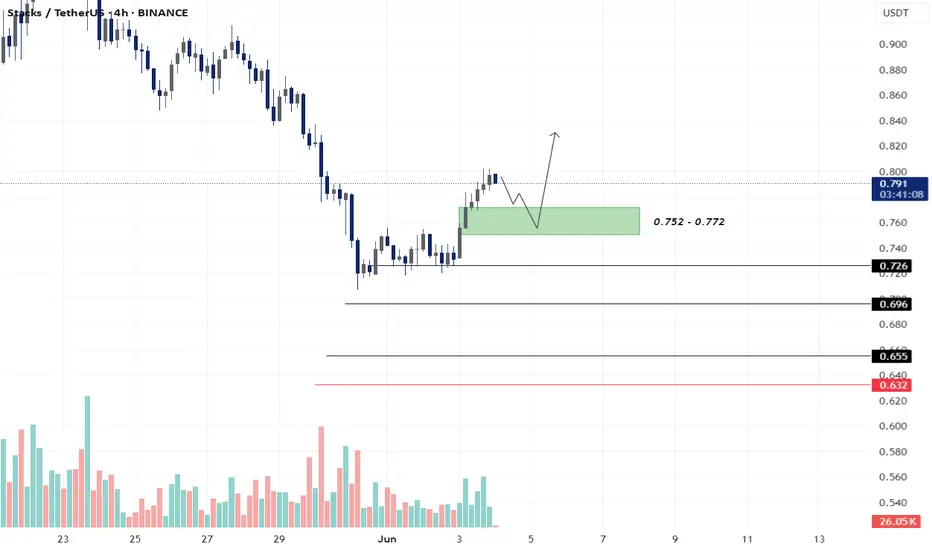
STX - LONG SET-UPBINANCE:STXUSDT
Green Zone (Demand Zone): 0.752 – 0.772
This is a bullish demand zone or entry zone where buyers previously stepped in.
Price may retest this zone before moving higher (as shown by the curved arrow).
Ideal area to deploy entries (25–50%) for a long position.
Acts as a support zone for potential reversal
Average Levels - 0.726 , 0.696 , 0.655
Stoploss - 0.632
SXT | Long | At Reclaim VWAP | (May 22, 2025)SXT | Long | Reclaiming VWAP & Eyeing Resistance Zone | (May 22, 2025)
1️⃣ Quick Take: SXT is showing strength, climbing toward a key resistance area while holding bullish structure on higher timeframes. Liquidity remains on the bulls' side despite a brief corrective signal on the 30-min chart.
2️⃣ Trade Parameters:
Bias: Long
Entry Zone:
✅ Early Entry: Around $0.84
✅ Main Entry: $0.74
Stop Loss: Below VWAP and recent low – structure-based, ideally near $0.70 zone
TP1: $1.00 (Partial Exit)
TP2: $1.37
TP3: $1.47
🪙 Holding 5% of position for extended move potential
3️⃣ Key Notes:
SXT bounced from VWAP, showing continuation toward the Value Area Low, POC, and higher resistance levels.
Inverse head & shoulders pattern forming – would prefer a dip below VWAP for re-entry confirmation.
Order flow shows aggressive spot selling, possibly by a single player. Liquidations noted, but broader sentiment remains long-biased.
On higher timeframes, liquidity still supports bullish continuation.
Watch overall market mood and correlation with BTC/NQ/SPX for additional confidence.
4️⃣ Follow-up: I’ll be monitoring for that re-entry opportunity near VWAP and updating the setup if structure shifts.
Please LIKE 👍, FOLLOW ✅, SHARE 🙌 and COMMENT ✍ if you enjoy this idea! Also share your ideas and charts in the comments section below! This is best way to keep it relevant, support us, keep the content here free and allow the idea to reach as many people as possible.
Disclaimer: This is not a financial advise. Always conduct your own research. This content may include enhancements made using AI.

STXUSDT | Heavy Resistance AheadSTXUSDT is now approaching a critical resistance zone . This red box isn’t just any level — it’s where price has previously stalled or reversed .
I’m watching closely, but I won’t chase into strength blindly. Only if this level breaks with volume and flips to support will I consider a long setup .
“I will not insist on my short idea. If the levels suddenly break upwards and do not give a downward break in the low time frame, I will not evaluate it. If they break upwards with volume and give a retest, I will look long.”
Patience and confirmation are what keep the win rate high. Most traders forget that. I never do.
📌I keep my charts clean and simple because I believe clarity leads to better decisions.
📌My approach is built on years of experience and a solid track record. I don’t claim to know it all but I’m confident in my ability to spot high-probability setups.
📌If you would like to learn how to use the heatmap, cumulative volume delta and volume footprint techniques that I use below to determine very accurate demand regions, you can send me a private message. I help anyone who wants it completely free of charge.
🔑I have a long list of my proven technique below:
🎯 ZENUSDT.P: Patience & Profitability | %230 Reaction from the Sniper Entry
🐶 DOGEUSDT.P: Next Move
🎨 RENDERUSDT.P: Opportunity of the Month
💎 ETHUSDT.P: Where to Retrace
🟢 BNBUSDT.P: Potential Surge
📊 BTC Dominance: Reaction Zone
🌊 WAVESUSDT.P: Demand Zone Potential
🟣 UNIUSDT.P: Long-Term Trade
🔵 XRPUSDT.P: Entry Zones
🔗 LINKUSDT.P: Follow The River
📈 BTCUSDT.P: Two Key Demand Zones
🟩 POLUSDT: Bullish Momentum
🌟 PENDLEUSDT.P: Where Opportunity Meets Precision
🔥 BTCUSDT.P: Liquidation of Highly Leveraged Longs
🌊 SOLUSDT.P: SOL's Dip - Your Opportunity
🐸 1000PEPEUSDT.P: Prime Bounce Zone Unlocked
🚀 ETHUSDT.P: Set to Explode - Don't Miss This Game Changer
🤖 IQUSDT: Smart Plan
⚡️ PONDUSDT: A Trade Not Taken Is Better Than a Losing One
💼 STMXUSDT: 2 Buying Areas
🐢 TURBOUSDT: Buy Zones and Buyer Presence
🌍 ICPUSDT.P: Massive Upside Potential | Check the Trade Update For Seeing Results
🟠 IDEXUSDT: Spot Buy Area | %26 Profit if You Trade with MSB
📌 USUALUSDT: Buyers Are Active + %70 Profit in Total
🌟 FORTHUSDT: Sniper Entry +%26 Reaction
🐳 QKCUSDT: Sniper Entry +%57 Reaction
📊 BTC.D: Retest of Key Area Highly Likely
📊 XNOUSDT %80 Reaction with a Simple Blue Box!
📊 BELUSDT Amazing %120 Reaction!
📊 Simple Red Box, Extraordinary Results
I stopped adding to the list because it's kinda tiring to add 5-10 charts in every move but you can check my profile and see that it goes on..

TradeCityPro | STX: Watching Triangle Breakout and RSI Reaction👋 Welcome to TradeCity Pro!
In this analysis, I’m going to review the STX coin, which belongs to the Stacks project—a Layer 2 solution for Bitcoin.
🔍 STX, with a market cap of $1.45 billion, is currently ranked 59 on CoinMarketCap.
🔄 In the previous analysis, I drew an expanding triangle and mentioned that if this triangle breaks to the upside, we can enter a long position or even make a spot purchase.
✨ The trigger for the triangle breakout was at the 0.731 level. After breaking out and pulling back to this level, the price moved up to 1.049 and is now once again in a consolidation phase.
📅 Daily Timeframe
Currently, after RSI got rejected from the 73.58 zone and exited the overbought area, the price has undergone some correction. A pullback to the 0.871 level is possible.
🧩 If a pullback or deeper correction occurs, as long as RSI remains above 50, I still consider the market momentum to be bullish and believe the price can continue moving upward.
📈 If we see a solid bullish candle confirming continuation, we can enter a long position. However, the main long trigger is the breakout of 1.049. The RSI trigger for sharper moves would also be a breakout above 73.58.
📊 The next resistance level is at 1.332. If this level breaks, the coin enters a new price zone, and we’ll need to see whether it can establish support above that area.
🔽 For a bearish scenario, we should wait for the market to form a structure and provide a valid trigger to confirm a short position. At the moment, it’s better to wait for that setup.
🔑 If the market turns bearish, the key support zones to watch are 0.731, 0.571, and 0.453, which could potentially halt further decline.
📝 Final Thoughts
This analysis reflects our opinions and is not financial advice.
Share your thoughts in the comments, and don’t forget to share this analysis with your friends! ❤️

STX ANALYSIS (2D)The STX pair has reached a demand zone.
A price movement fractal seems to be repeating (highlighted by the orange and white boxes).
In the orange boxes, every time STX has dropped more than 72%, it has made a rebound move to the upside.
We are looking for buy/long positions around the demand zone.
The targets for STX are $0.93 - $1.10 - $1.30.
A daily candle close below the invalidation level will invalidate this analysis.
For risk management, please don't forget stop loss and capital management
When we reach the first target, save some profit and then change the stop to entry
Comment if you have any questions
Thank You

STXUSDT Potentially BullishWe saw BTCUSDT gain some momentum and this effect is being seen on many ALT coins. BINANCE:STXUSDT is no different!!! At the moment, STX is breaking out of a consolidation phase on the Daily TF. Will this breakout mean #STXUSDT is regaining its bullish momentum? That remains to be seen, However a close above the 0.78 will likely bring us into the bullish phase.
Until then, fingers crossed.
Do your analysis before taking any trade, results are not typical, past results does not guarantee future results

STXUSDT Potentially BullishBINANCE:STXUSDT is beginning to take shape and is looking good to go long. Broken the consolidation phase and retested it. The bulls are setting in however, we just might see the market slow down around the 1.152 area which turns out slightly below the EMA 200 and also aligns with a resistance point on the weekly TF. On futures trade, I will target this area while i will lock down some profits on my spot trading at this point.
This is not a trade advice as such do your due diligence
Past results does not guarantee future results

STX entry 1.8 to 2.06 through 4.Stacks ($STX) is a layer 2 (or as described by Stacks as a Layer 1.5) smart contract protocol that lives on the Bitcoin blockchain. Via Stacks DeFI and other utility/protocols including City Coins (currently being minted by New York City and Miami and soon Austin and others), while other DeFi platforms built for Bitcoin live on other layer 1's (i.e. Badger on Ethereum), a smart contract protocol on top of the most secure blockchain may or should not only assist in avoiding a "flippenning" but is critical at a time where multi/cross/para chains are the current solutions to avoid bouncing protocol to protocol.
Additionally Stacks was both the first cryptocurrency to be acknowledged by the SEC as a security and also to be no longer recognized as a security by the SEC after successful adoptions. DYOR, Grayscale and partners have significant involvement in Stacks and was instrumental in the SEC approvals. This is pure gut but my gut says Grayscale will be the first BTC ETF approved by the SEC due to familiarity, etc.
Fractals show a similar pattern having already taken place, expect a full push or a pullback and then push to and through $4. Naturally as tied to Bitcoin, BTC volatility could slow or speed up the growth of STX, but smart contracts on the Bitcoin blockchain is powerful and not discussed nearly as much as one would expect.
The stacking opportunities and ecosystem being built around Stacks i.e. City Coins (read NY and Miami Mayoral comments on plans) make this a long term hold for those who want, as blockchain continues to proliferate real world applications beyond just crypto.

Stacks: Psychological Effects Of Trading & Technical AnalysisI was about to call it quits for now but I saw Stacks.
There was a guy here, a few years back. You know these people that are a true pain in the muladhara? That type of guy. He was always going about STXUSDT and as usual, I would give him the entry, the levels, the exit and he would always get it wrong.
Write, write, write, comment, comment; back and forth but never right, always wrong.
Jesus Christ!
Brahman please help!
I have positive impressions on my mind for this pair. That is because some time ago I shared a chart and it did great. This happens. When the prediction goes as planned, it records pleasant memories and each time I go through the pair the sanskaras are activated. It also works the other way. When a trade goes wrong, when I see the pair I tend to feel, "Yuck!"
Each time, good or bad, I have to overcome my mental attachments to be able to look a the pair fresh, with a new perspective, new!
If you get attached to the positive outcome, you are likely to jump in before the time is right.
If you get attached to the negative outcome, you are likely to miss it the next time prices are about to rise.
Both these need to be avoided if you are looking at charts or doing your own numbers. Detach completely and look at it fresh.
Today it is a new day. Whatever happened in the past, good or bad, has nothing to do with this present moment.
I am looking at Stacks, STXUSDT, what does the chart have to say?
A long-term support zone, mid-2023, has been activated.
All the action in 2024 has been removed. We are back to baseline, back to baseline is good for the bulls.
This pair allows buying at support in expectation of long-term growth.
Namaste.

STX Downtrend Breakout + 2x Bull RSI Divergences (1D)BINANCE:STXUSDT broke out of its downtrend after printing two Bull RSI Divergences in a row, and retesting a demand zone dating back to 2019.
Key Levels to Watch
• $0.45: Main Demand Zone, relevant since 2019. A break below it would invalidate the setup.
• $1.20: Arguably the most important S/R throughout STX's history, in place since March 2021 and potentially a strong resistance, also currently reinforced by the 200-day EMA. If reclaimed, it would most likely shift the bias to bullish.
• $2.70-$3.00: Main Supply Zone to overcome for new ATHs, dating back to April 2021.
Definitely worth taking a look at the chart on the monthly timeframe as well, to grasp the full significance of these levels.
All things considered, this seems a high-conviction trade, with a clean invalidation and a very good R/R.

STXUSDT is showing bullish divergence in 1d Time frame STXUSDT is showing bullish divergence in 1d Time frame and also broke LH

STXUSDT - LongLong entry at 0,533 USDT with a stop loss at 0,386 USDT.
Profit taking: 1,236 USDT, 1,78 USDT and 2,472 USDT.
